. 2023 Dec 1;3(12):2430-2446.
doi: 10.1158/2767-9764.CRC-23-0424.

CAR T-cell Design-dependent Remodeling of the Brain Tumor Immune Microenvironment Modulates Tumor-associated Macrophages and Anti-glioma Activity

Affiliations

CAR T-cell Design-dependent Remodeling of the Brain Tumor Immune Microenvironment Modulates Tumor-associated Macrophages and Anti-glioma Activity

Dalia Haydar et al. Cancer Res Commun. .

Abstract

Understanding the intricate dynamics between adoptively transferred immune cells and the brain tumor immune microenvironment (TIME) is crucial for the development of effective T cell-based immunotherapies. In this study, we investigated the influence of the TIME and chimeric antigen receptor (CAR) design on the anti-glioma activity of B7-H3-specific CAR T-cells. Using an immunocompetent glioma model, we evaluated a panel of seven fully murine B7-H3 CARs with variations in transmembrane, costimulatory, and activation domains. We then investigated changes in the TIME following CAR T-cell therapy using high-dimensional flow cytometry and single-cell RNA sequencing. Our results show that five out of six B7-H3 CARs with single costimulatory domains demonstrated robust functionality in vitro. However, these CARs had significantly varied levels of antitumor activity in vivo. To enhance therapeutic effectiveness and persistence, we incorporated 41BB and CD28 costimulation through transgenic expression of 41BBL on CD28-based CAR T-cells. This CAR design was associated with significantly improved anti-glioma efficacy in vitro but did not result in similar improvements in vivo. Analysis of the TIME revealed that CAR T-cell therapy influenced the composition of the TIME, with the recruitment and activation of distinct macrophage and endogenous T-cell subsets crucial for successful antitumor responses. Indeed, complete brain macrophage depletion using a CSF1R inhibitor abrogated CAR T-cell antitumor activity. In sum, our study highlights the critical role of CAR design and its modulation of the TIME in mediating the efficacy of adoptive immunotherapy for high-grade glioma.

Significance: CAR T-cell immunotherapies hold great potential for treating brain cancers; however, they are hindered by a challenging immune environment that dampens their effectiveness. In this study, we show that the CAR design influences the makeup of the immune environment in brain tumors, underscoring the need to target specific immune components to improve CAR T-cell performance, and highlighting the significance of using models with functional immune systems to optimize this therapy.


Figures

FIGURE 1
FIGURE 1
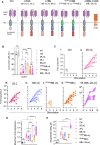
Generation and functional characterization of syngeneic B7-H3 CAR T-cells with different CAR structural designs. A, Scheme of mB7-H3-CAR constructs. Created with BioRender.com. B, MTS cytotoxicity assay against GL261 tumor cells at an E:T ratio of 0.25:1 (n = 7, mean ± SD, two-way ANOVA with Tukey test for multiple comparisons). C, T cells expressing different mB7-H3 CAR constructs were cocultured with GL261 tumor cells at a 2:1 ratio with restimulation every 3 days against fresh tumor cells until they no longer killed and/or expanded. Graphs show fold expansion of different T-cell donors upon successive stimulations (x-axis: each stimulation is a 3-day coculture with fresh GL261 tumor cells, n = 7). D, Summary of the maximum fold expansion of mB7-H3 CAR T-cells from individual donors upon repeat stimulation with GL261 tumor cells (n = 7, minimum to maximum range, one-way ANOVA with Tukey test for multiple comparisons). E, Maximum number of times CAR T-cells were able to kill Gl261 tumor cells (n = 7, minimum to maximum range, one-way ANOVA with Tukey test for multiple comparisons).
FIGURE 2
FIGURE 2
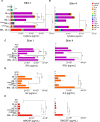
Surface expression of 41BBL on CD28-based mB7-H3-CAR T-cells enhances effector cytokines release in repeat stimulation assay. Culture supernatants were collected at 24 hours after repeated stimulation with GL261 tumor cells at 2:1 ratio and analyzed using Multiplex assay. Summary plots of cytokines and chemokines produced by CAR T-cells after first stimulation (A) and fourth stimulation (B) against GL261 tumor cells (n = 4, mean ± SEM, two-way ANOVA with Tukey test for multiple comparisons). C–E, CAR T-cell production of IFNγ, IL2, and GMCSF at 24 hours’ after stimulations one and four (n = 4, mean ± SEM, two-way ANOVA with Tukey test for multiple comparisons).
FIGURE 3
FIGURE 3
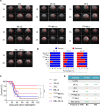
CAR structural design significantly impacts anti-glioma efficacy of mB7-H3 CAR T-cells in the GL261 immunocompetent model. Albino C57BL/6 mice were transplanted with 1 × 10⁵ GL261 cells orthotopically, followed 7 days later by intratumoral injection of 3 × 10⁶ mB7-H3-CAR T-cells transduced with different constructs and adjusted to 40% CAR expression. A, Axial brain MRI images from 3 representative mice per treatment group at days 16 and 29 after tumor implantation. B, Summary plots showing percentage of survival and deceased mice within each treatment group at days 16, 29, and 45 after tumor implantation. C, Kaplan–Meier survival curve (n = 11, log-rank Mantel–Cox test with Bonferroni correction for multiple comparisons, *, P < 0.05; ***, P < 0.001). Experiments were repeated twice with CAR T-cells generated from 2 different T-cell donors. D, Summary table for performance of different mB7-H3 CAR designs from in vitro and in vivo data [(−) means no response, increasing number of (+) signs mean better response].
FIGURE 4
FIGURE 4
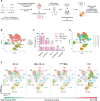
TIME heterogeneity after CAR T-cell treatment. A, Experimental scheme. Albino C57BL/6 mice were transplanted with 1 × 10⁵ GL261 cells orthotopically, followed 25 days later by intratumoral injection of 3 × 10⁶ mB7-H3-CAR T-cells (28.mζ, BBL-28.mζ,CD8tmBB.ζ, or Ctrl). Tumors were collected at 4 days after treatment and processed for scRNA-seq. Scheme created with BioRender.com. B, UMAP with major cell subsets in all tumor samples. C, Bar graph showing the percentage of each major cell type per treatment group. D, UMAP dimensionality reduction of single-cell data from all tumors clustered into 21 Seurat clusters annotated by number. E, UMAP visualization of the 21 Seurat clusters by treatment group from the best to the worst functioning CARs. Mac, macrophages; Mono, monocytes; MG, microglia; DC, dendritic cells.
FIGURE 5
FIGURE 5
Successful responses with 28.mζ CAR T-cells are associated with balanced proinflammatory and anti-inflammatory myeloid cell responses. Seurat clusters 0, 7, 10, 14 were reclustered into 10 Mac/MG subclusters to further define the diversity of myeloid responses after CAR T-cell treatment. A, UMAP plots of the Mac/MG subclusters visualized by treatment group. B, Summary plot of Mac/MG subcluster 2 and 7 frequencies per treatment. Volcano plots showing differentially upregulated and downregulated genes in macrophage subclusters C2 in C, C7 in D as compared with all other myeloid subclusters. E, Dot plot depicting expression of myeloid lineage markers, genes associated with protumorigenic responses, antitumorigenic, and differentiation genes. Dot size represents the percentage of cells expressing each gene and dot color represents mean expression level with a gradient of lowest expression in blue to highest expression in red. F, Dot plot depicting differentially expressed genes associated with immunosuppression, invasion, recruitment, M1-like and M2-like macrophage responses per treatment group.
FIGURE 6
FIGURE 6
Comprehensive flow cytometry analysis of the TIME from tumors at endpoint. Unsupervised clustering analysis of flow data from tumors at endpoint was done using algorithmic analysis with FlowJo software for phenotyping heterogenous populations based on multi-parameter marker expression. A, Experimental scheme. B, Representative cluster plot showing diversity of CD45+ cells from tumors with bar graph depicting quantitative analysis in each treatment group (Microglia CD45low; Activated microglia CD45low, F4/80low, MHCIIhigh, CD11blow; Immune cells CD45high). C, Graphical representation of the frequencies of major immune cell subsets per treatment group as defined by canonical cell surface markers. D and E, Quantitative plot of the CD4 and CD8 cell subsets after supervised subclustering analysis of lymphoid populations. F, Quantitative plot of myeloid cell populations per treatment group after supervised subclustering analysis. (cDC, conventional dendritic cells; pDC, plasmacytoid dendritic cells; TipDCs, TNF/iNOS-producing dendritic cells; PMN-MDSC, polymorphonuclear myeloid-derived suppressor cells; M-MDSC, monocytic myeloid-derived suppressor cells; MO-TAMs, monocyte-derived tumor associated macrophages; MG-TAMs, microglia-derived tumor associated macrophages).
FIGURE 7
FIGURE 7
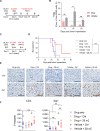
Global Mac/MG depletion abrogates effective CAR T-cell responses. GL261 glioma-bearing mice were treated with BLZ945 at 200 mg/kg starting 5 days after tumor implantation. A, Experimental scheme of BLZ945 macrophage depletion kinetics experiment. Daily drug dosing via oral gavage was for 2 weeks and tumors were harvested for FACS analysis at days 9, 16, and 20 after tumor implantation. B, Summary plot showing frequency of TAMs infiltrating tumors as percentage of live CD45+ immune cells. C, Experimental scheme for combination study. Glioma-bearing mice were treated with BLZ945 at 200 mg/kg starting 5 days after tumor implantation and continued daily for 3 weeks. B7-H3 CAR T-cells with Ctrl or 28.mζ constructs were then injected intratumorally at day 16. D, Kaplan–Meier survival curve (n = 11, log-rank Mantel–Cox test with Bonferroni correction for multiple comparisons, ***, P < 0.001). E, Representative images from immunostaining for T-cell and macrophage markers from tumors at endpoint showing CD3 and Iba1 staining in brain samples from each treatment group at 40x magnification (scale bar = 100 µm). F, H-scores depicting quantitative analysis of CD3 and Iba1 staining in brain tumor samples at endpoint from E as evaluated by blinded pathologist.

Update of

References

    1. Kline C, Felton E, Allen IE, Tahir P, Mueller S. Survival outcomes in pediatric recurrent high-grade glioma: results of a 20-year systematic review and meta-analysis. J Neurooncol 2018;137:103–10. - PMC - PubMed
    1. Nehama D, Di Ianni N, Musio S, Du H, Patané M, Pollo B, et al. . B7-H3-redirected chimeric antigen receptor T cells target glioblastoma and neurospheres. EBioMedicine 2019;47:33–43. - PMC - PubMed
    1. Nguyen P, Okeke E, Clay M, Haydar D, Justice J, O'Reilly C, et al. . Route of 41BB/41BBL costimulation determines effector function of B7-H3-CAR. CD28ζ T cells. Mol Ther Oncolytics 2020;18:202–14. - PMC - PubMed
    1. Chow KK, Naik S, Kakarla S, Brawley VS, Shaffer DR, Yi Z, et al. . T cells redirected to EphA2 for the immunotherapy of glioblastoma. Mol Ther 2013;21:629–37. - PMC - PubMed
    1. O'Rourke DM, Nasrallah MP, Desai A, Melenhorst JJ, Mansfield K, Morrissette JJ, et al. . A single dose of peripherally infused EGFRvIII-directed CAR T cells mediates antigen loss and induces adaptive resistance in patients with recurrent glioblastoma. Sci Transl Med 2017;9:eaaa0984. - PMC - PubMed

Publication types