. 2023 Dec 1;150(23):dev202070.
doi: 10.1242/dev.202070. Epub 2023 Dec 6.

Heparin-binding epidermal growth factor and fibroblast growth factor 2 rescue Müller glia-derived progenitor cell formation in microglia- and macrophage-ablated chick retinas

Affiliations

Heparin-binding epidermal growth factor and fibroblast growth factor 2 rescue Müller glia-derived progenitor cell formation in microglia- and macrophage-ablated chick retinas

Heithem M El-Hodiri et al. Development. .

Abstract

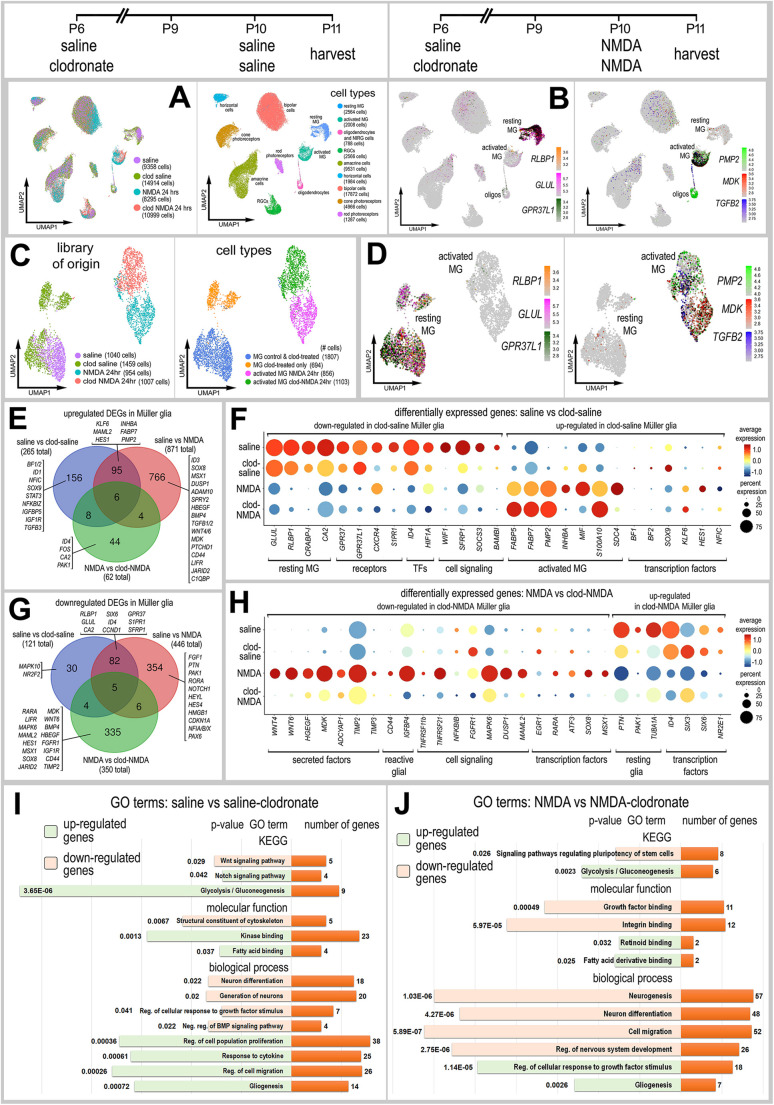
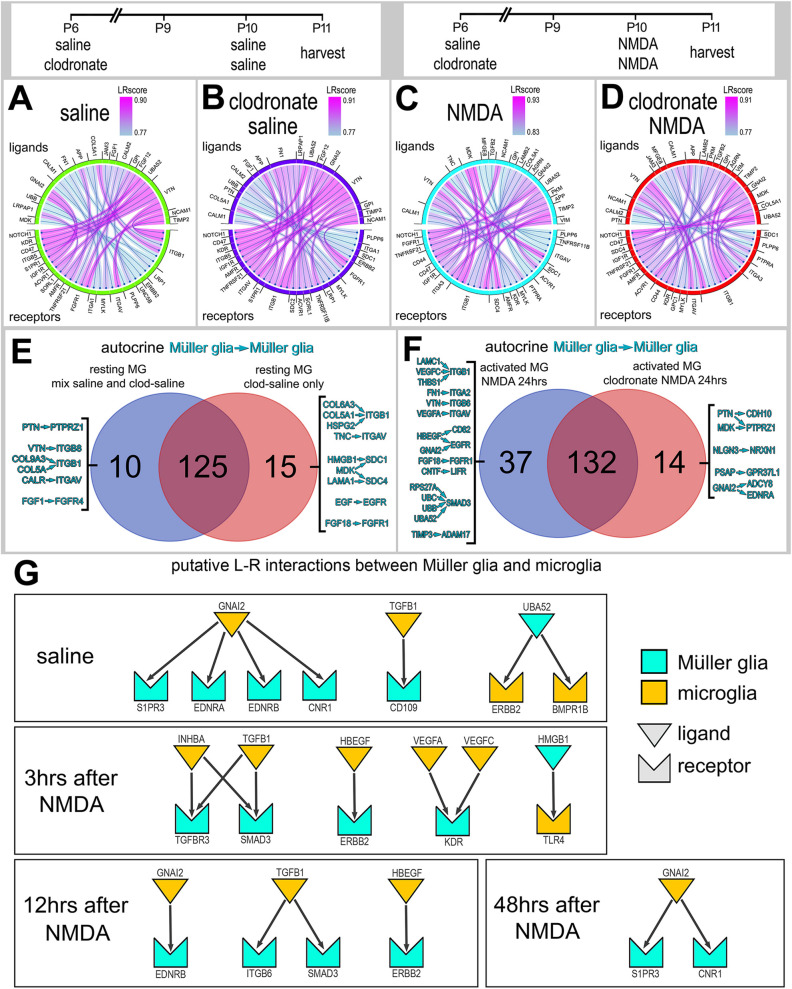
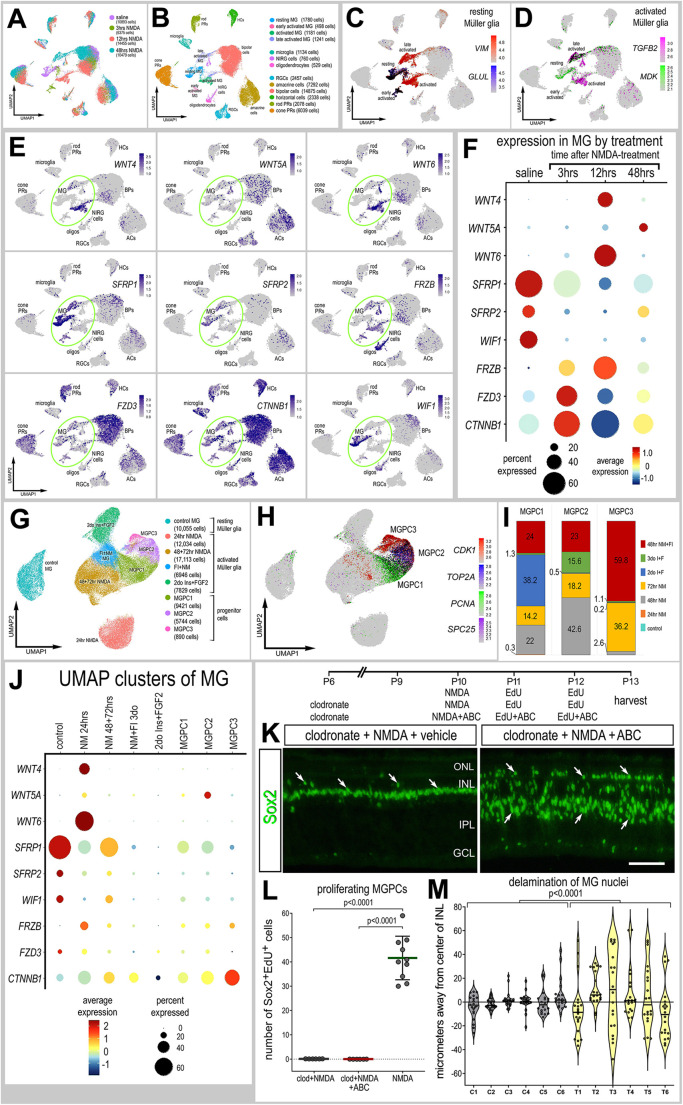
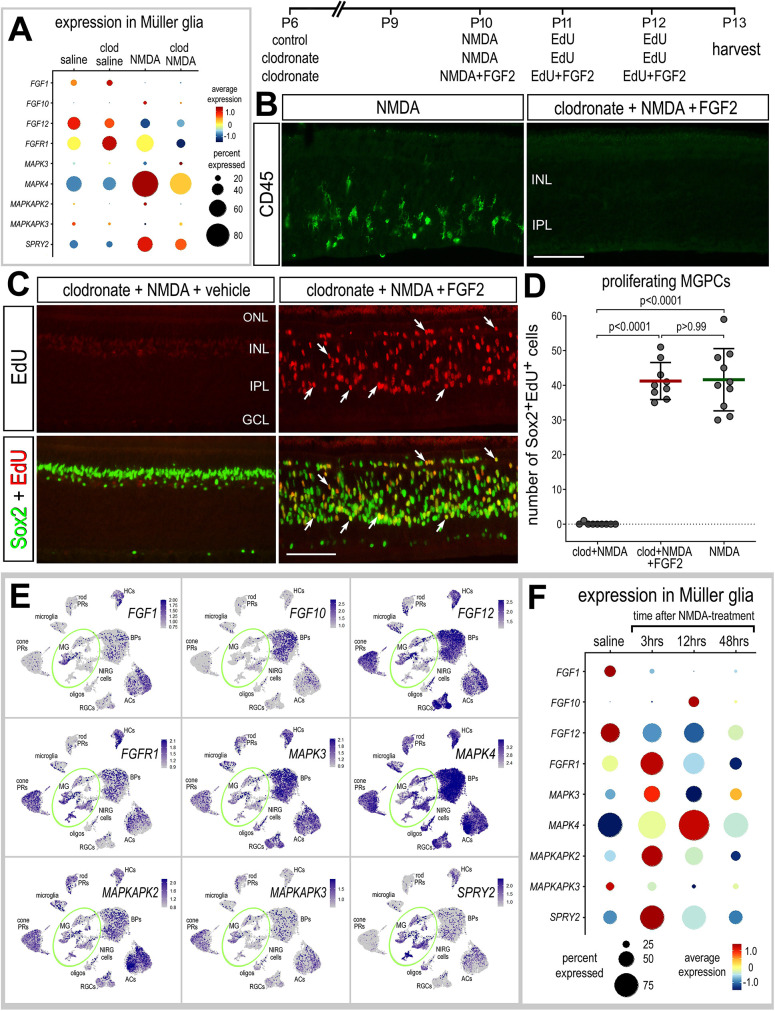
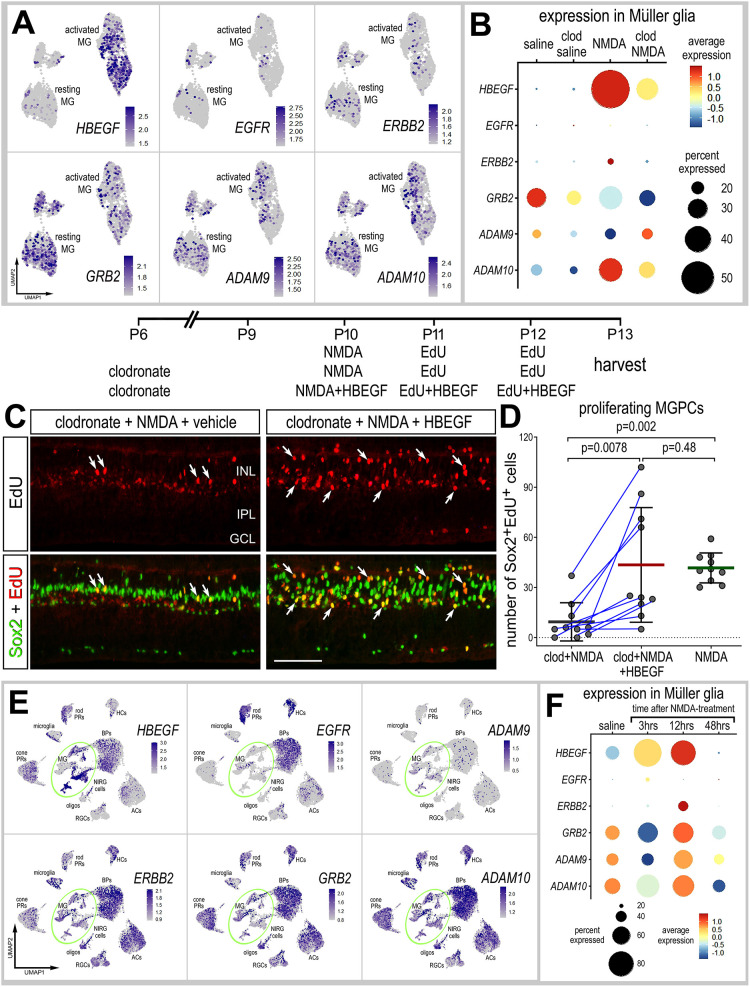
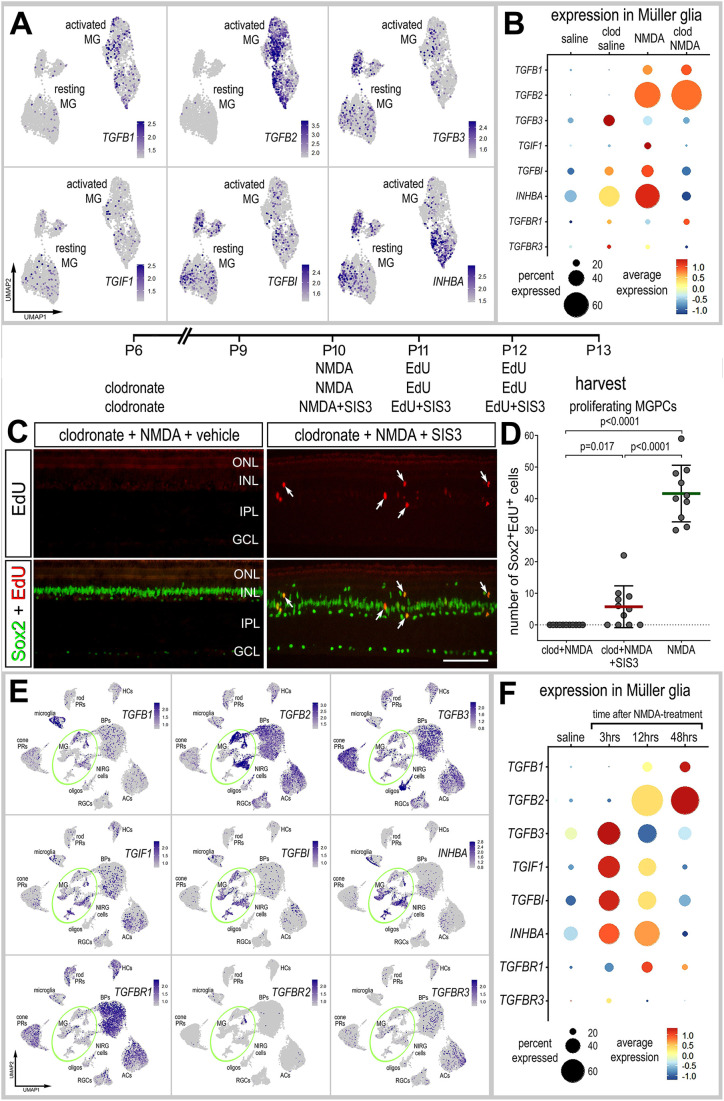
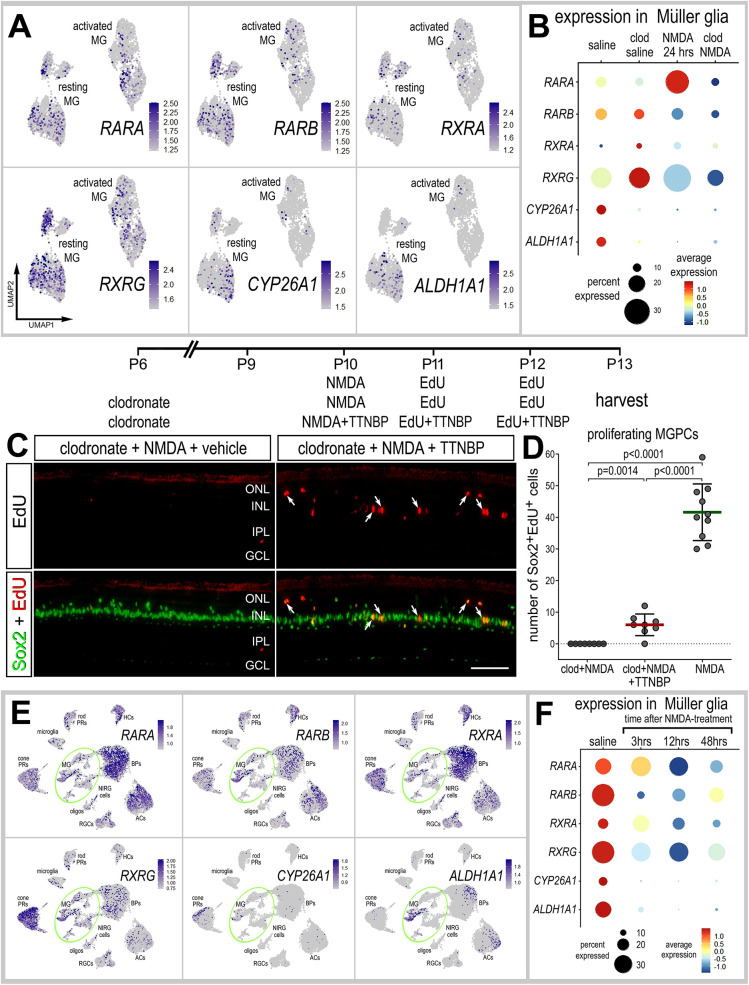
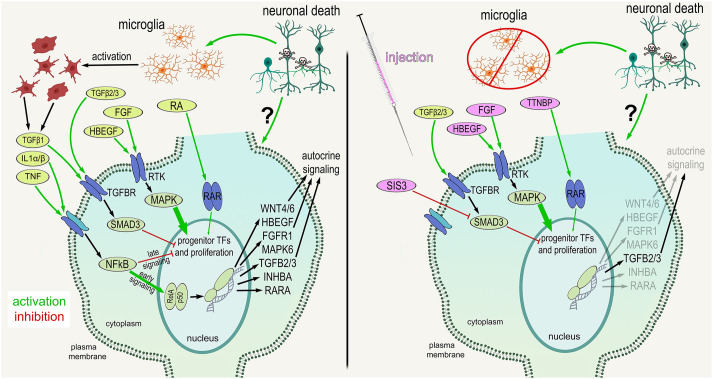
Recent studies have demonstrated the impact of pro-inflammatory signaling and reactive microglia/macrophages on the formation of Müller glial-derived progenitor cells (MGPCs) in the retina. In chick retina, ablation of microglia/macrophages prevents the formation of MGPCs. Analyses of single-cell RNA-sequencing chick retinal libraries revealed that quiescent and activated microglia/macrophages have a significant impact upon the transcriptomic profile of Müller glia (MG). In damaged monocyte-depleted retinas, MG fail to upregulate genes related to different cell signaling pathways, including those related to Wnt, heparin-binding epidermal growth factor (HBEGF), fibroblast growth factor (FGF) and retinoic acid receptors. Inhibition of GSK3β, to simulate Wnt signaling, failed to rescue the deficit in MGPC formation, whereas application of HBEGF or FGF2 completely rescued the formation of MGPCs in monocyte-depleted retinas. Inhibition of Smad3 or activation of retinoic acid receptors partially rescued the formation of MGPCs in monocyte-depleted retinas. We conclude that signals produced by reactive microglia/macrophages in damaged retinas stimulate MG to upregulate cell signaling through HBEGF, FGF and retinoic acid, and downregulate signaling through TGFβ/Smad3 to promote the reprogramming of MG into proliferating MGPCs.

Keywords: Cell signaling; Microglia; Müller glia; Retinal regeneration; scRNA-seq.


Conflict of interest statement

Competing interests The authors declare no competing or financial interests.

Figures

Fig. 1.
Fig. 1.
scRNA-seq of normal and damaged retinas with and without microglia. Retinas were treated with saline or clodronate liposomes at P6, followed by saline or NMDA at P10, and tissues harvested at 24 h after the last injection. (A) UMAP ordering of cells for libraries of origin and distinct clusters. (B,D) In UMAP heatmap plots, resting MG were identified by elevated expression of RLBP1, GLUL and GPR37L1, and activated MG were identified by elevated expression of PMP2, MDK and TGFB2. (C,D) MG were bioinformatically isolated and re-embedded in UMAP plots. (E,G) Lists of DEGs were generated (Tables S1-S3) for MG from retinas treated with saline versus clodronate+saline, saline versus NMDA, and NMDA versus clodronate+NMDA. Numbers of up- and downregulated DEGs are plotted in Venn diagrams with representative unique genes listed. (F,H) Dot plots illustrating the percentage of expressing MG (size) and significant (P<0.01) changes in expression levels (heatmap) for genes in MG from retinas treated with saline versus saline+clodronate (F) and NMDA versus NMDA+clodronate (H). (I,J) GO enrichment analysis was performed for lists of DEGs in MG treated with saline±clodronate and NMDA±clodronate. Gene modules for upregulated (green) and downregulated (peach) genes were grouped by GO category with P-values and numbers of genes in each category. Clod, clodronate; KEGG, Kyoto Encyclopedia of Genes and Genomes; Neg., negative; oligos, oligodendrocytes; Reg., regulation; TF, transcription factors.
Fig. 2.
Fig. 2.
Inferred autocrine ligand-receptor (LR) interactions. (A-D) SingleCellSignalR was used to identify putative LR interactions. Chord diagrams illustrate the top 30 most significant autocrine LR interactions between MG in retinas treated with saline (A), clodronate+saline (B), NMDA (C) and clodronate+NMDA (D). (E,F) Autocrine interactions were compared for saline versus clodronate+saline and NMDA versus clodronate+NMDA. Venn diagrams illustrate the numbers of unique and common LR interactions between treatment groups, and list representative LR interactions unique to MG in undamaged retinas with and without microglia (E) and NMDA damaged retinas with and without microglia (F). (G) Representative LR interactions between microglia and MG for undamaged and damaged retinas at different times after NMDA treatment. We analyzed an aggregate library with neurons and glia from control undamaged retinas and retinas at 3, 12 and 48 h after NMDA, which included a total of 1134 microglia and 4700 MG for SingleCellSignalR analyses.
Fig. 3.
Fig. 3.
Patterns of expression of Wnt-related genes. (A) scRNA-seq was used to identify patterns and levels of expression of Wnt-related genes in control and NMDA-damaged retinas at 3, 12 and 48 h after treatment. (B) UMAP clusters of cells were identified based on well-established patterns of gene expression (see Materials and Methods). (C,D) MG were identified by expression of VIM and GLUL in resting MG (C), and TGFB2 and MDK for activated MG (D). Each dot represents one cell and black dots indicate cells that express two or more genes. (E) UMAP heatmap plots illustrating patterns and levels of expression for Wnt-related genes. Green ovals highlight clusters of MG. (F,J) Dot plots illustrating average expression (heatmap) and percent expressed (dot size) in MG. (G-J) MG were bioinformatically isolated from scRNA-seq libraries of control retinas, retinas at 24, 48 and 72 h after NMDA treatment, retinas treated with two or three doses of insulin and FGF2, and retinas treated with insulin, FGF2 and NMDA at 48 h after NMDA for a total of 70,032 MG. (G,H) MG formed distinct UMAP clusters that correlated with different treatments (G), and MGPCs clustered by progression through the cell cycle (H). (I) Clusters of MGPCs were occupied by cells from different treatment groups. (K) We applied clodronate liposomes at P6, NMDA a cocktail of GSK3β inhibitors at P10, EdU±GSK3β inhibitors at P11 and P12, and harvested retinas at P13. Retinal sections were labeled for EdU accumulation and immunolabeled for Sox2 (green; K). Inhibition of GSK3β to stimulate Wnt signaling failed to stimulate MGPCs proliferation, but induced delamination of MG nuclei. Arrows indicate the nuclei of MG. Scale bar: 50 µm. (L) Mean MGPC proliferation (±s.d.); significance of difference (P-values) was determined using a Mann–Whitney U-test with Bonferroni correction. (M) Violin plot representing MG nuclear delamination; significance of difference (P-values) was determined using one-way ANOVA. In L,M, each dot represents one biological replicate. ABC, GSK3β inhibitor cocktail; C, control; GCL, ganglion cell layer; INL, inner nuclear layer; IPL, inner plexiform layer; ONL, outer nuclear layer; T, treated.
Fig. 4.
Fig. 4.
Activation of FGF2 rescues the deficit in MGPC proliferation in damaged retinas missing microglia. (A,E,F) Patterns and levels of expression of FGF/MAPK-related genes in scRNA-seq libraries of retinas treated with saline±clodronate and NMDA±clodronate (A), or different times after NMDA treatment (E,F). UMAP heatmap plots (E) and dotplot (F) illustrate patterns, percent expressed and levels of expression for FGF/MAPK-related genes in retinal neurons and glia in control retinas and retinas at 3, 12 and 48 h after NMDA treatment. The dot plots in A and F illustrate expression levels (heatmap) and percent expressed (dot size) for different genes in MG. (B-D) Retinal sections were labeled for EdU accumulation (red; C) and immunolabeled for Sox2 (green; C) and CD45 (green; B). Arrows indicate the nuclei of MG. The graph in D illustrates the mean (±s.d.) and each dot represents one biological replicate. Significance of difference (P-values) was determined using Mann–Whitney U-test with Bonferroni correction. Scale bars: 50 µm.
Fig. 5.
Fig. 5.
Activation of HBEGF rescues the deficit in MGPC formation in damaged retinas missing microglia. (A,B,E,F) Patterns and levels of expression of EGF-related genes in scRNA-seq libraries of retinas treated with saline±clodronate and NMDA±clodronate (A,B), or different times after NMDA treatment (E,F). UMAP heatmap plots (feature plots) illustrate patterns and levels of expression for EGF-related genes in MG only (A) or across all types of retinal neurons and glia (E). UMAP heatmap plots (E) and dotplot (F) illustrate patterns, percent expressed and levels of expression for HBEGF-related genes in retinal neurons and glia in control retinas and retinas at 3, 12 and 48 h after NMDA treatment. The dot plots in B and F illustrate expression levels (heatmap) and percent expressed (dot size) for different genes in MG. (C,D) Retinal sections labeled for EdU accumulation (red; C) and with antibodies to Sox2 (green; C). Arrows indicate the nuclei of MG. Scale bar: 50 µm. The graph in D illustrates the mean (±s.d.) and each dot represents one biological replicate. Significance of difference (P-values) was determined using an unpaired t-test with Bonferroni correction (D).
Fig. 6.
Fig. 6.
Activation of TGFβ/Smad3 signaling partially rescues the deficit in MGPC formation in damaged retinas missing microglia. (A,B,E,F) Patterns and levels of expression of TGFβ-related genes in scRNA-seq libraries of retinas treated with saline±clodronate and NMDA±clodronate (A,B), or different times after NMDA treatment (E,F). UMAP heatmap plots illustrate patterns and levels of expression for TGFβ-related genes in MG only (A) or across all types of retinal neurons and glia (E). UMAP heatmap plots (E) and dotplot (F) illustrate patterns, percent expressed and levels of expression for TGFβ-related genes in retinal neurons and glia in control retinas and retinas at 3, 12 and 48 h after NMDA treatment. The dot plots in B and F illustrate expression levels (heatmap) and percent expressed (dot size) for different genes in MG. (C,D) Retinal sections labeled for EdU accumulation (red; C) and with antibodies to Sox2 (green; C). Arrows indicate the nuclei of MG. Scale bar: 50 µm. The graph in D illustrates the mean (±s.d.) and each dot represents one biological replicate. Significance of difference (P-values) was determined using Mann–Whitney U-test with Bonferroni correction (D).
Fig. 7.
Fig. 7.
Inhibition of retinoic acid signaling partially rescues the deficit in MGPC formation in damaged retinas missing microglia. (A,B,E,F) Patterns and levels of expression of retinoic acid- related genes in scRNA-seq libraries of retinas treated with saline±clodronate and NMDA±clodronate (A,B), or different times after NMDA (E,F). UMAP heatmap plots (feature plots) illustrate patterns and levels of expression for retinoic acid-related genes in MG only (A) or across all types of retinal neurons and glia (E). UMAP heatmap plots (E) and dotplot (F) illustrate patterns, percent expressed and levels of expression for RAR-related genes in retinal neurons and glia in control retinas and retinas at 3, 12 and 48 h after NMDA treatment. The dot plots in B and F illustrate expression levels (heatmap) and percent expressed (dot size) for different genes in MG. (C,D) Retinal sections were labeled for EdU accumulation (red; C) and immunolabeled for Sox2 (green; C). Arrows indicate the nuclei of MG. Scale bar: 50 µm. The graph in D illustrates the mean (±s.d.) and each dot represents one biological replicate. Significance of difference (P-values) was determined using a Mann–Whitney U-test with Bonferroni correction (D).
Fig. 8.
Fig. 8.
Schematic summarizing the factors and cell signaling pathways downstream of activated microglia that are key to the formation of MGPCs. The schematic summarizes some of the ligands, receptors and pathways that are activated in MG in damaged retinas. The factors that rescue the deficit in MGPC proliferation that occurs in damaged retinas missing microglia are illustrated in the panel to the right.

Similar articles

Cited by

References

    1. Antenos, M., Zhu, J., Jetly, N. M. and Woodruff, T. K. (2008). An activin/furin regulatory loop modulates the processing and secretion of inhibin α- and βB-subunit dimers in pituitary gonadotrope cells. J. Biol. Chem. 283, 33059-33068. 10.1074/jbc.M804190200 - DOI - PMC - PubMed
    1. Bernardos, R. L., Barthel, L. K., Meyers, J. R. and Raymond, P. A. (2007). Late-stage neuronal progenitors in the retina are radial Müller glia that function as retinal stem cells. J. Neurosci. 27, 7028-7040. 10.1523/JNEUROSCI.1624-07.2007 - DOI - PMC - PubMed
    1. Butler, A., Hoffman, P., Smibert, P., Papalexi, E. and Satija, R. (2018). Integrating single-cell transcriptomic data across different conditions, technologies, and species. Nat. Biotechnol. 36, 411-420. 10.1038/nbt.4096 - DOI - PMC - PubMed
    1. Cabello-Aguilar, S., Alame, M., Kon-Sun-Tack, F., Fau, C., Lacroix, M. and Colinge, J. (2020). SingleCellSignalR: inference of intercellular networks from single-cell transcriptomics. Nucleic Acids Res. 48, e55. 10.1093/nar/gkaa183 - DOI - PMC - PubMed
    1. Campbell, W. A., Deshmukh, A., Blum, S., Todd, L., Mendonca, N., Weist, J., Zent, J., Hoang, T. V., Blackshaw, S., Leight, J.et al. (2019). Matrix-metalloproteinase expression and gelatinase activity in the avian retina and their influence on Müller glia proliferation. Exp. Neurol. 320, 112984. 10.1016/j.expneurol.2019.112984 - DOI - PMC - PubMed