

doi: 10.1128/mbio.02204-23.
Epub 2023 Nov 16.
Viral and host factors drive a type 1 Epstein-Barr virus spontaneous lytic phenotype
Affiliations
- PMID: 37971257
- PMCID: PMC10746244
- DOI: 10.1128/mbio.02204-23
Item in Clipboard
Viral and host factors drive a type 1 Epstein-Barr virus spontaneous lytic phenotype
mBio.
.
Abstract
Epstein-Barr virus (EBV) infects over 95% of adults worldwide. Given its connection to various cancers and autoimmune disorders, it is important to understand the mechanisms by which infection with EBV can lead to these diseases. In this study, we describe an unusual spontaneous lytic phenotype in EBV strains isolated from Kenyan endemic Burkitt lymphoma patients. Because lytic replication of EBV has been linked to the pathogenesis of various diseases, these data could illuminate viral and host factors involved in this process.
Keywords: Epstein–Barr virus; burkitt lymphoma; herpesvirus; lytic replication.
Conflict of interest statement
The authors declare no conflict of interest.
Figures
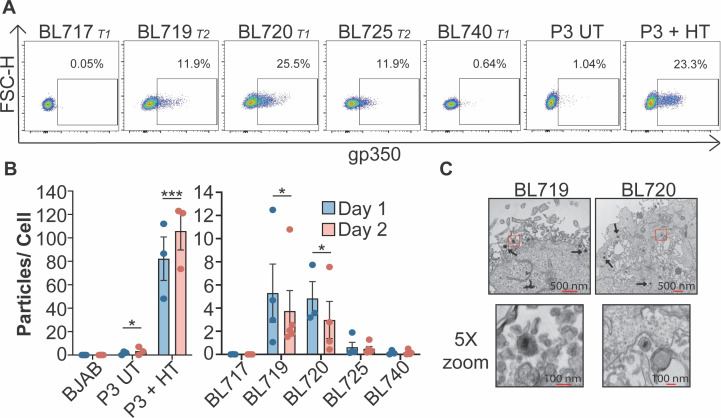
New EBV strains are spontaneously lytic. (A) Gp350 FACS of newly established EBV-infected BL cell lines (BL717, BL719, BL720, BL725, and BL740) compared to untreated and P3-ZHT cells treated with 50 nM 4-HT. The EBV strain genetic type and the percentage of gp350(+) cells in the lymphocyte, single-cell population are noted. (B) EBV particles produced per cell 1 and 2 days after plating. DNase-resistant viral particles in the supernatants were quantified by DNA qPCR for the viral BALF5 gene and a standard curve made from the 2089 BAC harboring the EBV genome. A two-way ANOVA test revealed that strain is significant but day is not. Subsequent unpaired t tests show significant increase in particle production from UT and 4HT-treated P3-ZHT, BL719, and BL720 compared to BJAB but no significant difference from BL717, BL725, and BL740 compared to BJAB; *P < 0.05, ***P < 0.009. (C) Electron micrographs of EBV particles in BL719 and BL720. The boxed portion of the top images is shown at 5× zoom in the bottom images.
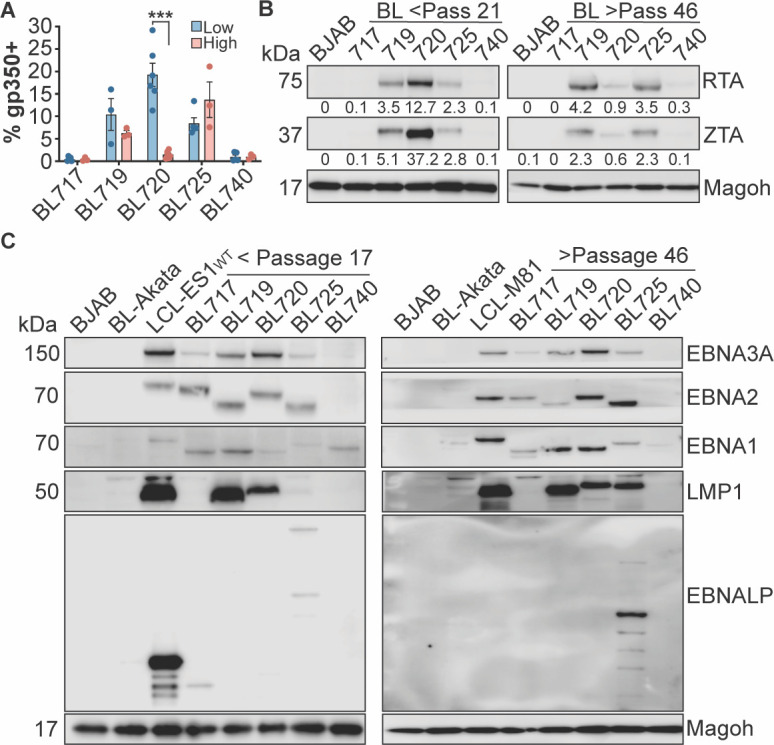
Lytic and latency states of the new EBV strains. (A) Gp350 FACS results from low (<passage 25) and high (>passage 58) passage BL cell lines reveal that the spontaneous lytic phenotype in BL720 is significantly diminished over time in culture. ***P < 0.0001. (B) Western blots of the immediate early lytic transcription factors RTA and ZTA from low passage (left) and high passage (right) cell lysates. The numbers under the blots indicate the percentage of viral protein expression compared to the cellular protein Magoh. BJAB-EBV-negative B cell line. (C) Western blot of EBV latency proteins expressed in the low passage (left) and high passage (right) BL cell lysates. BL-Akata is a latency I control, LCL-ES1-WT and LCL-M81 are latency III controls, and BJAB is an EBV-negative B cell line. Only presence vs absence of protein should be interpreted (rather than relative expression between targets) as the contrast was adjusted for each target to better visualize the bands.
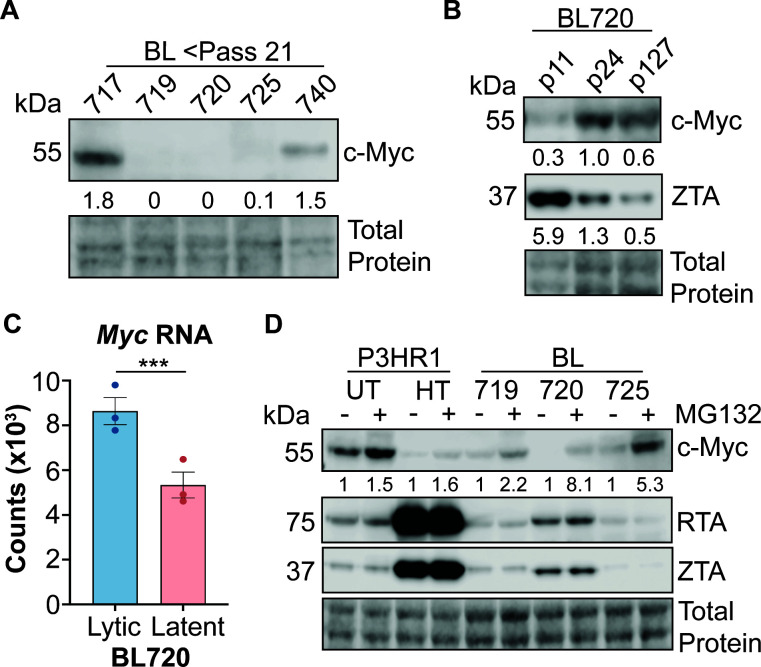
Lytic BL Cells have lower c-Myc stability. (A) Western blot of c-Myc protein expression in low passage, lytic BL cells. The lysates in this blot are the same as those in Fig. 2B left panel. The numbers under the blot are c-Myc expression as a percentage of total protein. (B) Western blot of c-Myc and ZTA protein expression in low, mid, and high passage BL720. The numbers under the blots are c-Myc expression as a percentage of total protein. (C) Myc RNA expression counts from lytic vs latent BL720 RNA sequencing experiment. *** indicates an adjusted P value of 0.007. (D) Cells plated the previous day were either treated with 10 µM of MG132 or DMSO (UT) for 2 h then harvested to assess c-Myc stability. P3-ZHT cells were treated with 50 nM 4-HT at the time of plating (~24 h 4-HT treatment before addition of MG132). The numbers under the blot are normalized c-Myc expression relative to untreated cells within each cell type (i.e., there is a 5.3× relative increase in c-Myc expression upon MG132 treatment in BL725 compared to untreated BL725). Note that there is no apparent difference in RTA or ZTA expression upon MG132 treatment as 2 h of proteasome inhibition is likely too short of a time to affect turnover of these proteins.
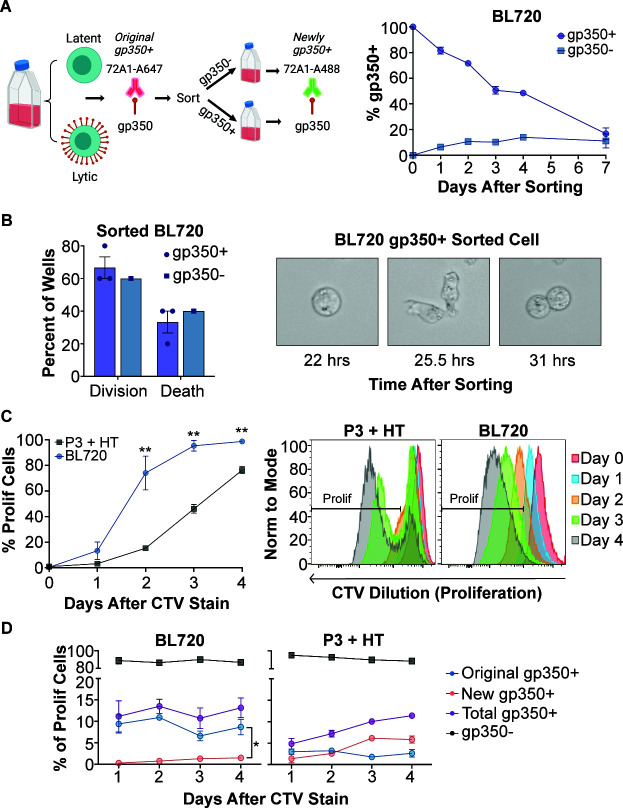
BL720 reverts to a basal lytic state after sorting into gp350±subpopulations. (A) Left—Schematic of sorting and follow-up FACS strategy (made with Biorender). Right—Percentage of total gp350(+) cells (both original and new) over time following sorting of BL720 into pure gp350(+) and gp350(−) subpopulations. (B) Left—BL720 cells from the d0 sorted populations in panel (A) were seeded into live cell imaging plates and 10 wells were recorded for each sample. The data displayed are the percentage of these 10 wells where any cell in the well divided (division) vs the percentage of the wells where the cells died without any division occurring (death). N = 3 for gp350(+) sorted cells, N = 1 for gp350(−) sorted cells. Right—Live cell image of a cell from the gp350(+) sorted population dividing. (C) Left—Proliferation of low passage (lytic) BL720 compared to P3-ZHT cells stimulated with 4-HT. Proliferation was measured by CTV dilution over time. Right—Representative proliferation FACS plots of the graphical data. (D) Proportions of lytic vs latent subpopulations in the proliferating cells in panel (C). Similar to the sorting strategy in panel (A), cells were stained with 72A1-A647 immediately after CTV staining then with 72A1-A488 on the days after CTV staining. This staining strategy allows tracking of cells that were gp350(+) then subsequently divided (original gp350+) vs cells that divided then became gp350(+) (new gp350+). Total gp350(+) is the sum of the original and new gp350(+) signals. There were significantly more proliferating original gp350(+) cells compared to newly gp350(+) cells in BL720 at day 4 after CTV staining (P = 0.0164). In the P3 + HT samples, there were relatively more proliferating new gp350(+) cells compared to original gp350(+), though this difference was not quite significant (P = 0.0578).
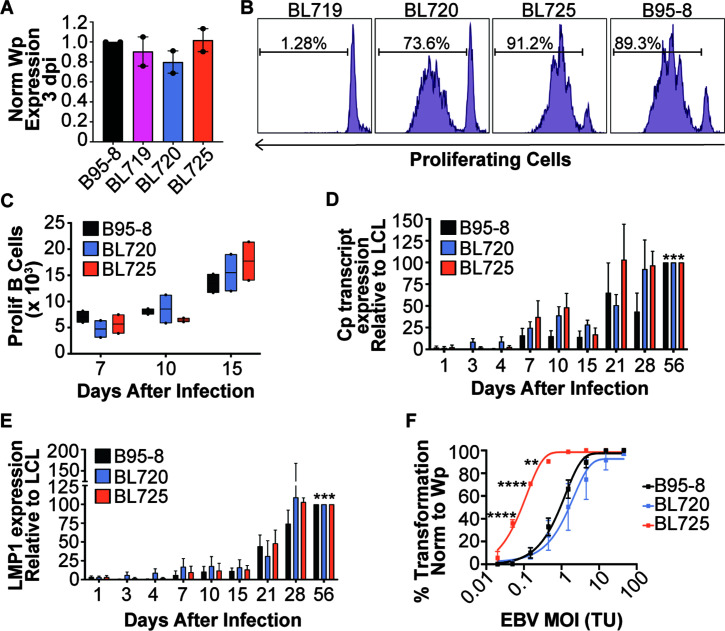
Spontaneously lytic BL-derived strains are transforming in vitro. (A) Infectivity of viral stocks derived from BL719, BL720, and BL725 compared to B95-8 as measured by qPCR for Wp transcripts 3 days after infection of PBMCs from two blood donors. The qPCR results are displayed as Wp equivalents for 100 µL of virus per 1 million PBMCs normalized to B95-8. (B) Representative FACS plot of proliferating B cells 7 days after infection with the indicated strains. The percentage of proliferating B cells is noted on the plots. (C) Number of proliferating B cells 7, 10, and 15 days after infection of PBMCs from two donors with the indicated strains. A two-way ANOVA analysis shows a significant increase in the number of proliferating B cells over time after infection (P = 0.0128) but no significant differences between strain or PBMC donor. (D) qPCR for EBV C promoter (Cp) derived transcripts infection of three PBMC donors with the indicated strains. Cp transcript abundance was measured periodically early after infection until LCLs were formed by day 56 post-infection. The data are normalized to the expression level in the LCL state at day 56. A two-way ANOVA analysis indicates significant differences in Cp expression between days after infection (P < 0.0001) and between PBMC donors (P = 0.0013), but not between strains. Subsequent paired t tests show a significant increase in Cp transcript expression for each strain between days 1 and 56 (B95-8 P = 0.0004; BL720 P = 0.0003; BL725 P = 0.0006). (E) LMP1 transcript expression from the same samples as in (D). A two-way ANOVA analysis indicates a significant difference in LMP1 expression between days after infection (P = 0.009) but not between strain or donor. Subsequent paired t tests show a significant increase in LMP1 transcript expression for each strain between days 1 and 56 (B95-8 P = 0.0003; BL720 P = 0.0002; BL725 P = 0.0005). (F) Transformation assay of three PBMC donors infected with the indicated strains at the indicated MOIs. Infections were done with equivalent volumes of virus then normalized to Wp equivalents as in (A). One-way ANOVAs at the discrete MOIs show that strain BL725 is significantly more transforming than strains B95-8 and BL720, while there is no significant difference in transformation between strains B95-8 and BL720.
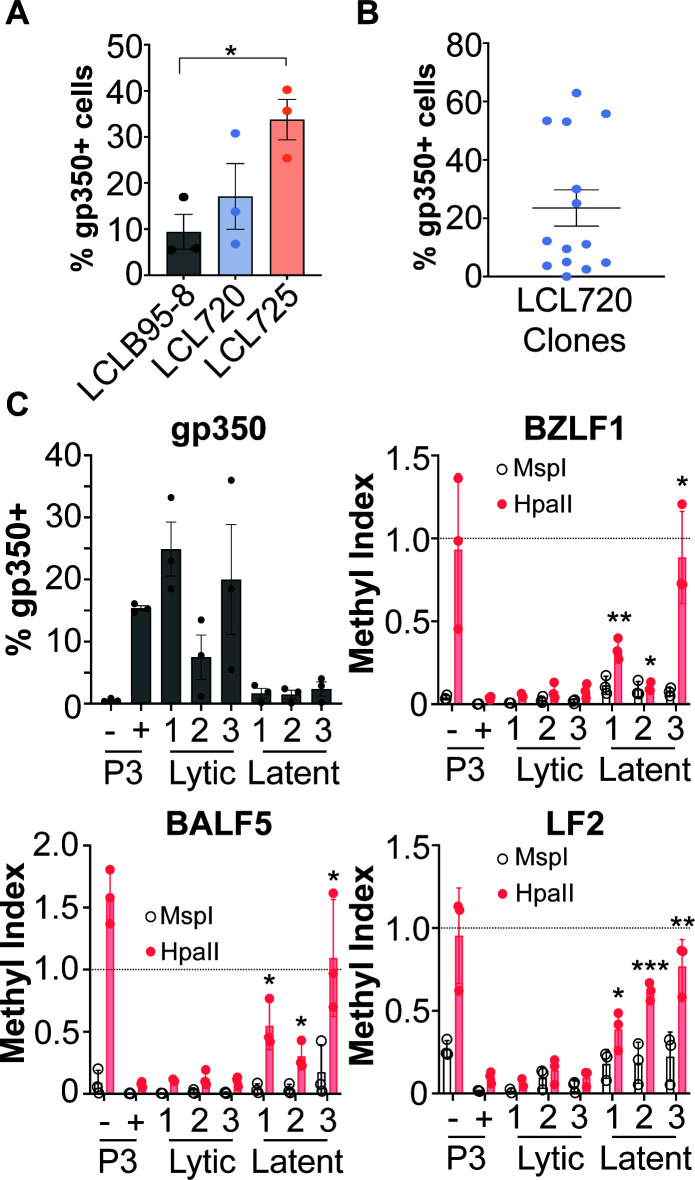
LCLs derived from strains 720 and 725 are spontaneously lytic. (A) Gp350 FACS analysis of bulk, donor-matched LCLs derived from infection with strains B95-8, 720, and 725. There is a significant increase in gp350-positive cells in LCL725 compared to LCLB95-8 (*P = 0.0136). (B) Gp350 FACS analysis of LCL720 clones derived from infection with a limiting dilution of strain 720. (C) gp350 FACS (top left) paired to methyl-qPCR of CpG sites within the viral BZLF1, BALF5, and LF2 promoters of three lytic and three latent LCL720 clones. A methylation index of 1 indicates methylation, an index of 0 indicates no methylation. MspI digests are an internal control as this enzyme digests at the CCGG CpG site regardless of methylation status, so it should always be near 0. In contrast, HpaII only digests when the site is unmethylated. P3 (−) = untreated P3HR1 cells, P3 (+) = P3 HR1 cells treated with 50 nM 4HT for 24 h. *=P < 0.05, **=P < 0.005, ***=P < 0.0005 in comparison to P3HR1 + 4HT by unpaired t test.
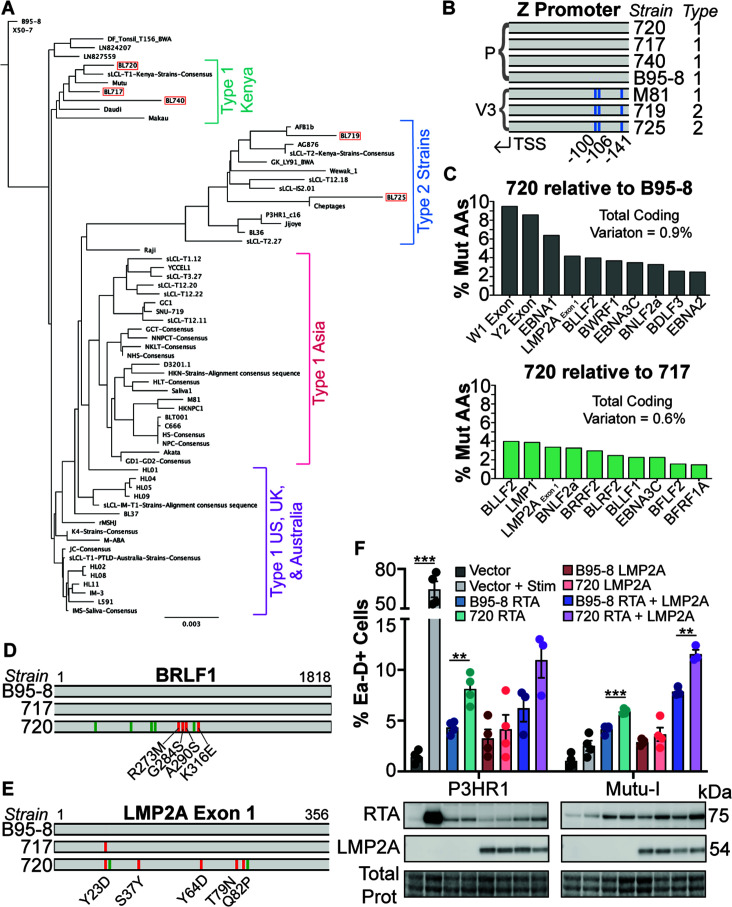
Strain 720 viral genetic analyses. (A) Phylogenetic tree of publicly available EBV genomes and the new BL strains from this study (boxed in red) rooted to B95-8. Because some published sequences are very closely related, if the viral genetic sequences were more than 90% similar, they were aligned into a consensus sequence and this consensus was used in the final alignment to build the tree (these instances are notated with “consensus” in the tree). Similar groups are annotated by EBV type and geographic origin. (B) Z promoter variant analysis of the new BL-derived strains compared to published strains. (C) The top 10 most polymorphic coding regions between strain 720 compared to B95-8 (top) and strain 720 compared to strain 717 (bottom). The percentage of mutated amino acids was calculated based on the available coding sequence length. Total coding variation (mutated amino acids as a percentage of the available coding genome) is noted. (D) Coding (red) and non-coding (green) SNPs in strain 720 BRLF1 compared to strains 717 and B95-8. The coding SNPs are annotated. (E) Similar to panel (D) but with the LMP2A exon 1 sequence. The Y23D SNP is present in both strains 717 and 720 compared to B95-8. (F) Top- FACS analysis of Ea-D induction 1 day after overexpression of the indicated viral proteins. For vector, RTA, and LMP2A overexpression, 4 µg of the construct was transfected. For RTA + LMP2A overexpression, 2 µg of each construct was transfected. “Stim” for P3HR1 was 50 nM 4-HT and 10 µg/ mL anti-IgM for Mutu-I. **=P < 0.005, ***=P < 0.0005. Bottom- representative western blot from the samples above.
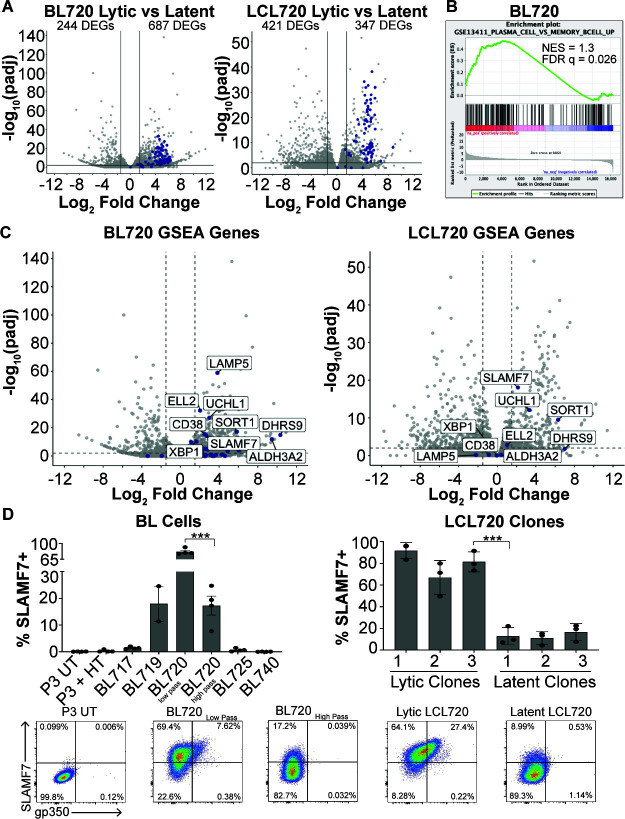
Cellular markers of T1 spontaneous lytic phenotype. (A) Volcano plots of differentially expressed genes observed from RNA sequencing of low passage, lytic BL720 (n = 3) compared to high passage, latent BL720 (n = 3) and lytic LCL720 clones (n = 3), and latent LCL720 clones (n = 3). For both of these analyses, the human genetic background is the same, so these DEGs are the result of the lytic vs latent viral phenotypes. Host DEGs are in gray, EBV DEGs are in blue. The number of genes downregulated in lytic (left side of plots) and upregulated in lytic (right side of plots) are notated. Cutoffs for DEGs are 1.5 log2FoldChange and P-adjusted <0.01. (B) GSEA analysis of BL720 RNA sequencing data revealed that GSE13411 (plasma cell vs memory B cell up) is significantly enriched in lytic BL720 compared to latent BL720. (C) Left- Genes from GSE13411 in B plotted on the BL720 volcano. Genes from the set are in blue and the genes that have >1.5 log2FoldChange and p-adjusted <0.01 are labeled. Right- the most significantly enriched genes from BL720 are plotted on the LCL720 volcano. Of these genes, SLAMF7, UCHL1, and SORT1 are significantly enriched in lytic BL720 at the >1.5 log2FoldChange and P-adjusted <0.01 cutoffs. (D) SLAMF7 (CD319) and gp350 FACS analysis in BL cells (left) and LCL720 clones (right). There is a significant reduction in SLAMF7 surface expression in high passage, latent BL720 compared to low passage, lytic BL720. Likewise, there is a significant decrease in expression in the latent LCL720 clones compared to the lytic LCL720 clones (***P < 0.0006). Representative FACS plots from these analyses are displayed at the bottom.
References
-
- Bristol JA, Djavadian R, Albright ER, Coleman CB, Ohashi M, Hayes M, Romero-Masters JC, Barlow EA, Farrell PJ, Rochford R, Kalejta RF, Johannsen EC, Kenney SC, Flemington EK. 2018. A cancer-associated Epstein-Barr virus BZLF1 promoter variant enhances lytic infection. PLoS Pathog 14:e1007179. doi:10.1371/journal.ppat.1007179 - DOI - PMC - PubMed
MeSH terms
Grants and funding
LinkOut - more resources
Full Text Sources
