

Early time-restricted carbohydrate consumption vs conventional dieting in type 2 diabetes: a randomised controlled trial
- PMID: 37971503
- PMCID: PMC10789836
- DOI: 10.1007/s00125-023-06045-9
Early time-restricted carbohydrate consumption vs conventional dieting in type 2 diabetes: a randomised controlled trial
Abstract
Aims/hypothesis: Early time-restricted carbohydrate consumption (eTRC) is a novel dietary strategy that involves restricting carbohydrate-rich food intake to the morning and early afternoon to align with circadian variations in glucose tolerance. We examined the efficacy, feasibility and safety of eTRC in individuals with type 2 diabetes under free-living conditions.
Methods: In this randomised, parallel-arm, open label, controlled trial, participants with type 2 diabetes and overweight/obesity (age 67.2±7.9 years, 47.8% women, BMI 29.4±3.7 kg/m2, HbA1c 49±5 mmol/mol [6.6±0.5%]) were randomised, using computer-generated random numbers, to a 12 week eTRC diet or a Mediterranean-style control diet with matched energy restriction and macronutrient distribution (50% carbohydrate, 30% fat and 20% protein). The primary outcome was the between-group difference in HbA1c at 12 weeks. Body composition, 14 day flash glucose monitoring and food diary analysis were performed every 4 weeks. Mixed meal tolerance tests with mathematical beta cell function modelling were performed at baseline and after 12 weeks.
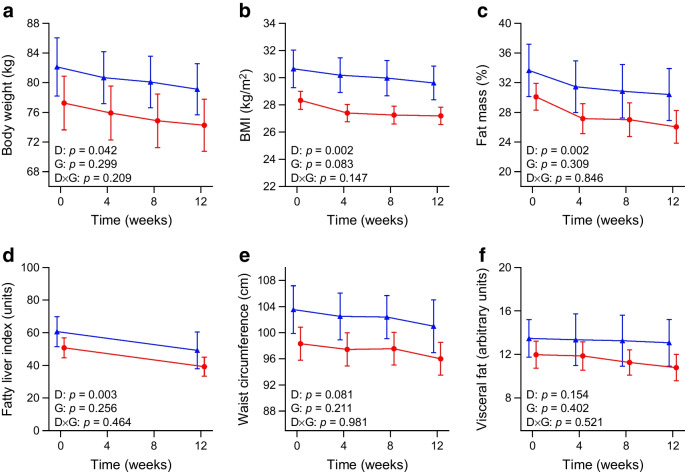
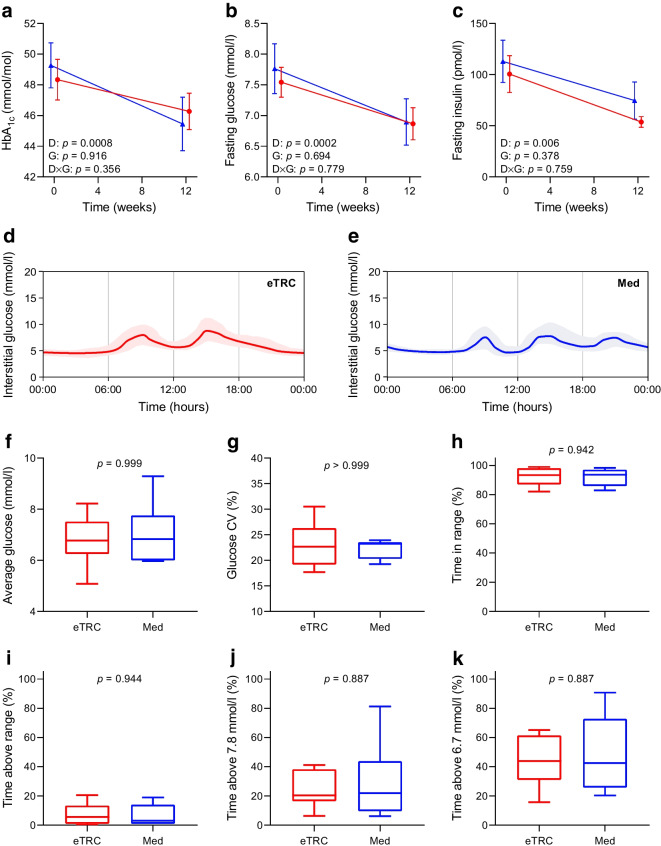
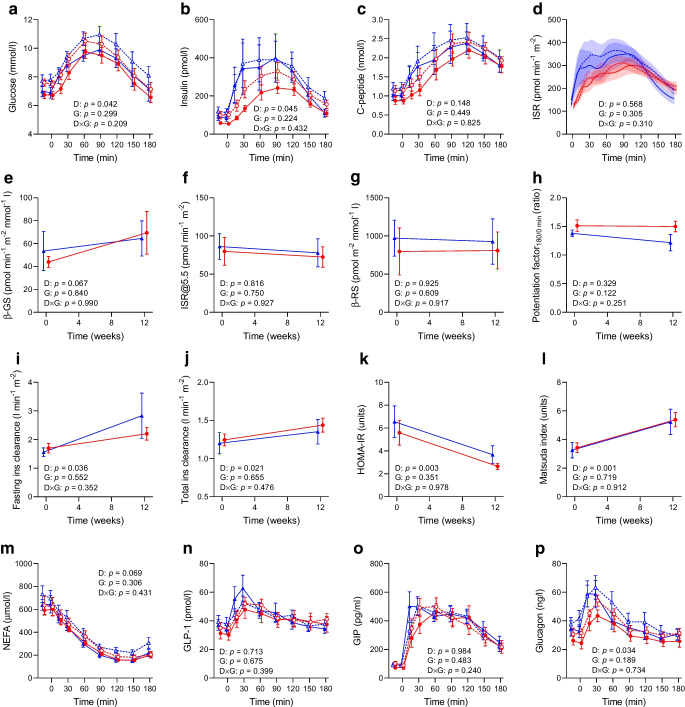
Results: Twelve (85.7%) participants in the eTRC arm and 11 (84.6%) participants in the control arm completed the study, achieving similar reductions in body weight and fat mass. The two groups experienced comparable improvements in HbA1c (-3 [-6, -0.3] mmol/mol vs -4 [-6, -2] mmol/mol, corresponding to -0.2 [-0.5, 0]% and -0.3 [-0.5, -0.1]%, respectively, p=0.386), fasting plasma glucose, flash glucose monitoring-derived glucose variability and mixed meal tolerance test-derived glucose tolerance, insulin resistance, insulin clearance and plasma glucagon levels, without changes in model-derived beta cell function parameters, glucagon-like peptide-1, glucose-dependent insulinotropic polypeptide and non-esterified fatty acid levels. The two diets similarly reduced liver function markers and triglyceride levels, being neutral on other cardiometabolic and safety variables. In exploratory analyses, diet-induced changes in body weight and glucometabolic variables were not related to the timing of carbohydrate intake.
Conclusions/interpretation: The proposed eTRC diet provides a feasible and effective alternative option for glucose and body weight management in individuals with type 2 diabetes, with no additional metabolic benefits compared with conventional dieting.
Trial registration: ClinicalTrials.gov NCT05713058 FUNDING: This study was supported by the European Society for Clinical Nutrition and Metabolism (ESPEN) and the Italian Society of Diabetology (SID).
Keywords: Blood glucose control; Circadian rhythm; Dietary carbohydrates; Glucagon; Glucose-dependent insulinotropic peptide; Nutrition therapy; Obesity; Randomised controlled trial; Time-restricted eating; Type 2 diabetes.
© 2023. The Author(s).
Figures
References
-
- Sutton EF, Beyl R, Early KS, Cefalu WT, Ravussin E, Peterson CM. Early time-restricted feeding improves insulin sensitivity, blood pressure, and oxidative stress even without weight loss in men with prediabetes. Cell Metab. 2018;27(6):1212–1221 e1213. doi: 10.1016/j.cmet.2018.04.010. - DOI - PMC - PubMed
Publication types
MeSH terms
Substances
Associated data
Grants and funding
LinkOut - more resources
Full Text Sources
Medical
Miscellaneous
