

Shapely additive values can effectively visualize pertinent covariates in machine learning when predicting hypertension
- PMID: 37971610
- PMCID: PMC10710553
- DOI: 10.1111/jch.14745
Shapely additive values can effectively visualize pertinent covariates in machine learning when predicting hypertension
Abstract
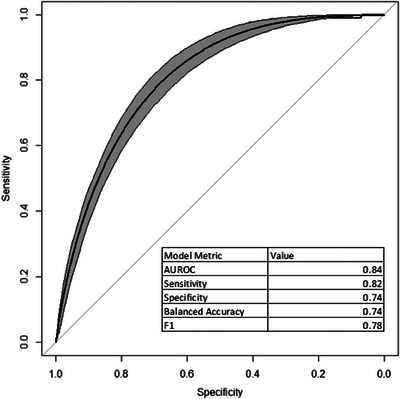
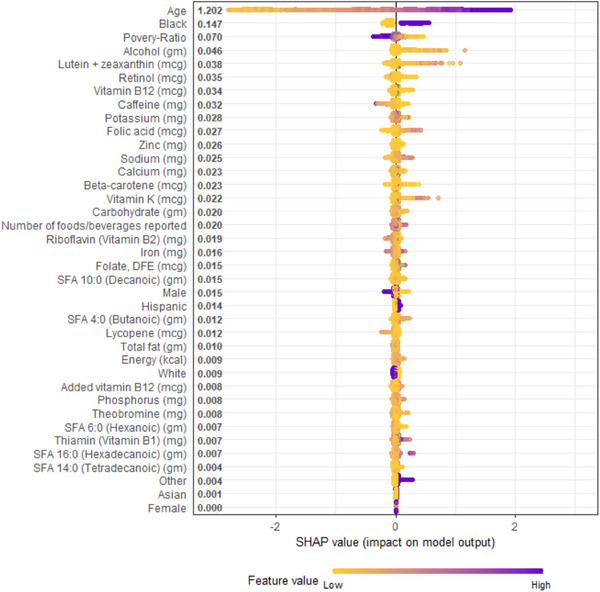
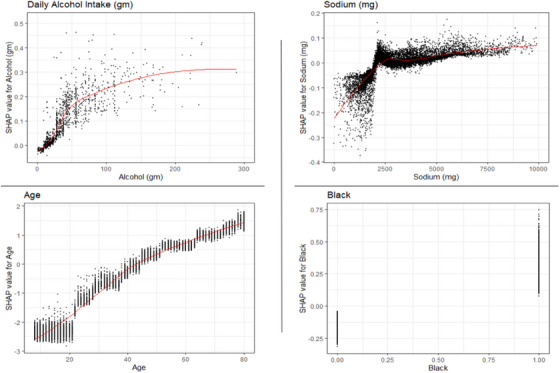
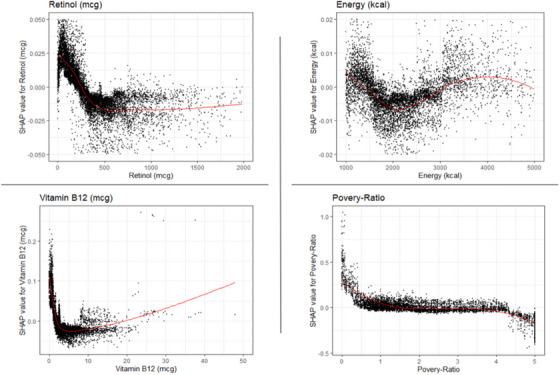
Machine learning methods are widely used within the medical field to enhance prediction. However, little is known about the reliability and efficacy of these models to predict long-term medical outcomes such as blood pressure using lifestyle factors, such as diet. The authors assessed whether machine-learning techniques could accurately predict hypertension risk using nutritional information. A cross-sectional study using data from the National Health and Nutrition Examination Survey (NHANES) between January 2017 and March 2020. XGBoost was used as the machine-learning model of choice in this study due to its increased performance relative to other common methods within medical studies. Model prediction metrics (e.g., AUROC, Balanced Accuracy) were used to measure overall model efficacy, covariate Gain statistics (percentage each covariate contributes to the overall prediction) and SHapely Additive exPlanations (SHAP, method to visualize each covariate) were used to provide explanations to machine-learning output and increase the transparency of this otherwise cryptic method. Of a total of 9650 eligible patients, the mean age was 41.02 (SD = 22.16), 4792 (50%) males, 4858 (50%) female, 3407 (35%) White patients, 2567 (27%) Black patients, 2108 (22%) Hispanic patients, and 981 (10%) Asian patients. From evaluation of model gain statistics, age was found to be the single strongest predictor of hypertension, with a gain of 53.1%. Additionally, demographic factors such as poverty and Black race were also strong predictors of hypertension, with gain of 4.33% and 4.18%, respectively. Nutritional Covariates contributed 37% to the overall prediction: Sodium, Caffeine, Potassium, and Alcohol intake being significantly represented within the model. Machine Learning can be used to predict hypertension.
Keywords: SHAP; cardiology; hypertension; machine learning; model transparency; statistics.
© 2023 The Authors. The Journal of Clinical Hypertension published by Wiley Periodicals LLC.
Conflict of interest statement
The authors have no financial or personal conflicts of interest.
Figures
References
-
- Dobrowolski P, Prejbisz A, Kurylowicz A, et al. Metabolic syndrome—a new definition and management guidelines: a joint position paper by the Polish Society of Hypertension, Polish Society for the Treatment of Obesity, Polish Lipid Association, Polish Association for Study of Liver, Polish Society of Family Medicine, Polish Society of Lifestyle Medicine, Division of Prevention and Epidemiology Polish Cardiac Society, “Club 30” Polish Cardiac Society, and Division of Metabolic and Bariatric Surgery Society of Polish Surgeons. Arch Med Sci. 2022;18(5):1133‐1156. - PMC - PubMed
MeSH terms
Grants and funding
LinkOut - more resources
Full Text Sources
Medical
