. 2024 Jan 9;9(1):e162621.
doi: 10.1172/jci.insight.162621.

Disruption of CFAP418 interaction with lipids causes widespread abnormal membrane-associated cellular processes in retinal degenerations

Affiliations

Disruption of CFAP418 interaction with lipids causes widespread abnormal membrane-associated cellular processes in retinal degenerations

Anna M Clark et al. JCI Insight. .

Abstract

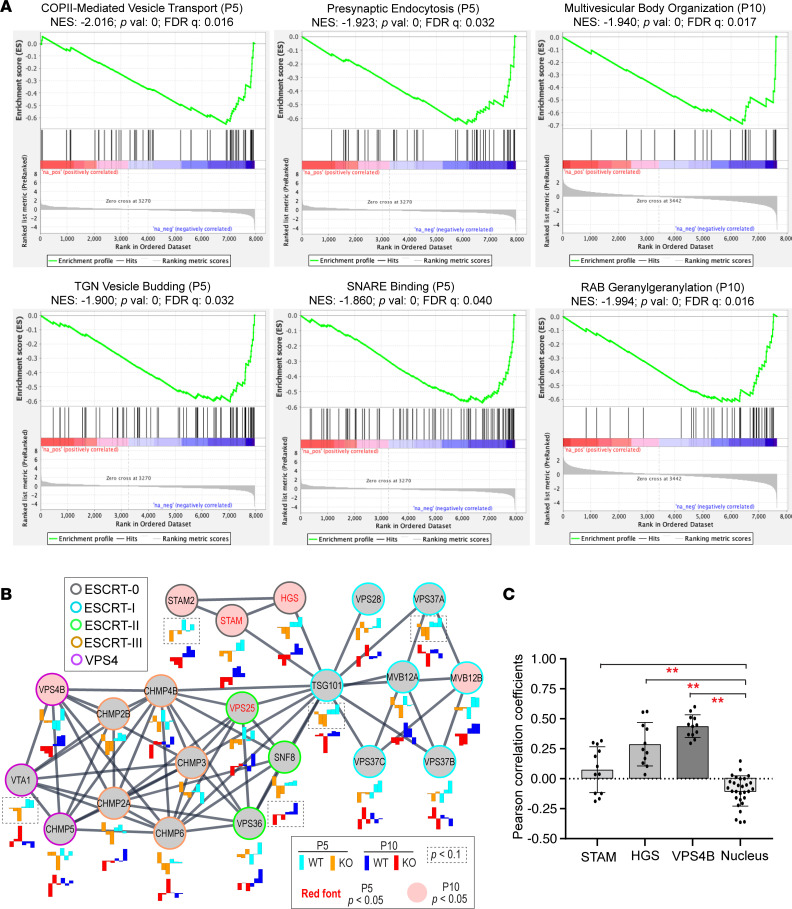
Syndromic ciliopathies and retinal degenerations are large heterogeneous groups of genetic diseases. Pathogenic variants in the CFAP418 gene may cause both disorders, and its protein sequence is evolutionarily conserved. However, the disease mechanism underlying CFAP418 mutations has not been explored. Here, we apply quantitative lipidomic, proteomic, and phosphoproteomic profiling and affinity purification coupled with mass spectrometry to address the molecular function of CFAP418 in the retina. We show that CFAP418 protein binds to the lipid metabolism precursor phosphatidic acid (PA) and mitochondrion-specific lipid cardiolipin but does not form a tight and static complex with proteins. Loss of Cfap418 in mice disturbs membrane lipid homeostasis and membrane-protein associations, which subsequently causes mitochondrial defects and membrane-remodeling abnormalities across multiple vesicular trafficking pathways in photoreceptors, especially the endosomal sorting complexes required for transport (ESCRT) pathway. Ablation of Cfap418 also increases the activity of PA-binding protein kinase Cα in the retina. Overall, our results indicate that membrane lipid imbalance is a pathological mechanism underlying syndromic ciliopathies and retinal degenerations which is associated with other known causative genes of these diseases.

Keywords: Cell Biology; Ophthalmology; Protein traffic; Proteomics; Retinopathy.


Conflict of interest statement

Conflict of interest: The authors have declared that no conflict of interest exists.

Figures

Figure 1
Figure 1. Membrane remodeling–associated proteins are differentially expressed at the onset of Cfap418–/– retinal phenotypes.
(A) Schematic of photoreceptor subcellular compartments, which occupy the outer segment (OS), inner segment (IS), outer nuclear layer (ONL), and outer plexiform layer (OPL) in the retina. This schematic was adapted from Mathur and Yang (92). (B) Venn diagram showing the total proteins and differentially expressed proteins in P5 and P10 retinas detected by quantitative proteomics. (C) Scarcity of CFAP418 protein in Cfap418–/– (Ko) retinas validates our quantitative proteomic study. (D) Six membrane remodeling–associated proteins are differentially expressed in both P5 and P10 Cfap418–/– retinas, detected by label-free and TMT-labeling quantitative MS, respectively. Dot plots are represented as data from individual mice and mean ± SEM (2-tailed Student’s t test).
Figure 2
Figure 2. CFAP418 functions in membrane remodeling–associated pathways.
(A) GSEA reveals that vesicular trafficking processes are negatively affected in P5 and P10 Cfap418–/– retinas. (B) Expression of ESCRT complex components in Cfap418+/+ and Cfap418–/– littermate retinas at P5 and P10 (2-tailed Student’s t test). The expression levels of 3 individual mice per genotype are shown as bar charts below each node. Lines between nodes represent associations between nodes annotated by STRING/Cytoscape 3.8.1 (93, 94). (C) Pearson’s correlation coefficients of FLAG-CFAP418 with endogenous STAM, HGS, and VPS4B in COS-7 cells. The bar plot represents data from individual cells and mean ± SEM. **P < 0.01 (1-way ANOVA with Tukey’s multiple-comparison test).
Figure 3
Figure 3. Abnormal HGS, STAM, and RAB28 distributions in Cfap418–/– photoreceptors.
(A and B) Compared with heterozygous (Het, Cfap418+/–) littermate photoreceptors, HGS (A) and STAM (B) are mislocalized from the IS to the OS, and RAB28 signal shows an abnormal punctate pattern at the OS and RPE junction in P21 Cfap418–/– (Ko) photoreceptors. RAB28 signal shows an abnormal punctate pattern at the OS and RPE junction in P21 Cfap418–/– retinas. (C and D) Enlarged view of HGS (C), STAM (D), and RAB28 immunostaining signals in the OS and IS regions of P21 Cfap418+/– and Cfap418–/– photoreceptors. BF, bright-field. Scale bars: 10 mm (A and B) and 5 mm (C and D).
Figure 4
Figure 4. Mitochondrial protein expression and morphology are defective in Cfap418–/– photoreceptors.
(A) Quantitative proteomic study reveals reductions in mitochondrial PGS1 and NDUFA7 proteins in both P5 and P10 Cfap418–/– retinas. Data are presented as individual mice, mean, and SEM. (B) The abundances of mitochondrial proteins in central dogma, oxidative phosphorylation, lipid metabolism, and protein import/sorting are altered in Cfap418–/– retinas at P5 or P10. (C) A longitudinal view of Cfap418–/– photoreceptors shows uneven diameters along the length of mitochondria at P28, compared with the smooth, straight, long bar-shaped mitochondria in Cfap418+/– littermate photoreceptors. Mitochondria are highlighted in yellow. Red arrows point to the abnormal constrictions and protruding bumps of the mitochondria. Scale bars: 1.5 mm. (D) Quantification of photoreceptor mitochondrial diameter and diameter variation at P28–P30. Data are presented as individual mitochondria (dots), mice (color), mean, and SEM. Two-tailed Student’s t test was conducted on averages from different mice between genotypes (n = 3 mice for each genotype).
Figure 5
Figure 5. Ciliary transport proteins are affected during Cfap418–/– OS growth.
(A) Proteins in ciliary transport pathways are reduced in P10 Cfap418–/– retinas. (B) Quantitative MS data show normal BBS2, BBS4, and undetectable ARL13B (not shown) protein expression in P5 Cfap418–/– (Ko) retinas and their reduced expression in P10 Cfap418–/– retinas. (C) Semiquantitative immunoblots for BBS2, BBS4, and ARL13B in Cfap418+/– and Cfap418–/– littermate retinas at different time points. The corresponding γ-tubulin immunoblots are loading controls. (D) Quantification of the semiquantitative immunoblots reveals BBS2 and ARL13B reductions in P10 and P14 Cfap418–/– retinas, respectively, and a trend of BBS4 reduction in P14 Cfap418–/– retinas. (E) Mislocalization of STX3 from the IS and OPL to the OS in P21 Cfap418–/– photoreceptors. Scale bars: 10 mm. Data from individual mice and mean ± SEM are shown in B and D (2-tailed Student’s t test). See complete unedited blots in the supplemental material.
Figure 6
Figure 6. Protein phosphorylation is altered in developing Cfap418–/– photoreceptors.
(A) DPYSL3 is the only differentially phosphorylated protein identified in both P5 and P10 Cfap418–/– retinas, while PRKCA is a differentially phosphorylated protein identified in P10 Cfap418–/– retinas. (B) Quantitative MS demonstrates that DPYSL3 phosphorylation is reduced in P5 Cfap418–/– (Ko) retinas, and DPYSL3 and PRKCA phosphorylation is increased in P10 Cfap418–/– retinas. (C) Semiquantitative immunoblots for pan- and pT497-PRKCA in retinas from 4 pairs of P10 Cfap418+/– and Cfap418–/– littermate mice. γ-Tubulin is a loading control. (D) Quantification of the semiquantitative immunoblots for pan- and pT497-PRKCA signals. (E) Immunostaining displays similar pan- and pT497-PRKCA signal patterns between P10 Cfap418+/– and Cfap418–/– littermate retinas. The pT497-PRKCA signal is stronger in photoreceptors than the pan-PRKCA signal (arrows). Scale bars: 10 mm. Data are presented as individual mice and mean ± SEM in B and D (2-tailed Student’s t test). See complete unedited blots in the supplemental material.
Figure 7
Figure 7. CFAP418 interacts transiently with RAB28 in retinas.
(A) Overlap of proteins identified from 5 AP-MS experiments using a CFAP418 antibody and mouse retinas at P30. (B) Overlap of proteins identified from 2 AP-MS experiments using CFAP418 recombinant proteins and adult bovine retinas. (C) Overlap of potential CFAP418-interacting proteins identified from mouse and bovine retinas. (D) RAB28 was coimmunoprecipitated with CFAP418 from mouse retinas at 1 month of age. (E) mCherry-RAB28 proteins, but not mCherry, pulled down a small fraction of FLAG-CFAP418 in HEK293 cells. Note that FLAG-CFAP418 was only seen in the overexposed immunoblot. (F) FLAG-CFAP418 was colocalized with mCherry-RAB28 but not with mCherry. Framed regions are amplified and shown on the right. Scale bars: 10 mm. (G) The Pearson’s correlation coefficients (PCCs) of FLAG-CFAP418 with mCherry-RAB28 WT, T26N, Q72L, and mCherry alone. Data are represented as individual cells, mean, and SEM. **P < 0.01 (1-way ANOVA with Tukey’s multiple-comparison test). See complete unedited blots in the supplemental material.
Figure 8
Figure 8. CFAP418 binds to PA and CL in various cell membranes.
(A) Purified recombinant His- and GST-CFAP418 proteins bind directly to PA and CL on membrane strips. The lipid arrangements on the 2 membrane strips are the same. Refer to the full lipid names in the Results section. (B) Representative immunostaining results for FLAG-CFAP418 and various cell organelle markers in COS-7 cells. The filled arrowhead denotes a large vacuole formed in the transfected cell. The open arrowheads point to the position where the amplified insets are located. The insets show CFAP418 is present at mitochondrial edges. Scale bars: 10 mm. (C) The Pearson’s correlation coefficients (PCCs) of CFAP418 with different cell organelle markers. Nuclear dye Hoechst 33342 was used as a negative control. Data are represented as individual cells, mean, and SEM. *P < 0.05, **P < 0.01 (1-way ANOVA with Tukey’s multiple-comparison test versus the nucleus group).
Figure 9
Figure 9. Abnormal membrane lipid composition and membrane-protein association in developing Cfap418–/– retinas.
(A) Membrane lipid categories affected in P10 Cfap418–/– (Ko) retinas. (B) Acyl chains affected in P10 Cfap418–/– retinal membrane lipids. (C) Volcano plot showing fold changes of individual lipid species between Cfap418+/– and Cfap418–/– retinas at P10. (D and E) RAB28 is increased in the cytosol (Cyto) and decreased in the membrane (Mem) in Cfap418–/– retinas, compared with Cfap418+/– retinas at P21 (using a commercial membrane protein extraction kit, D) and P30 (using a Triton X-100 protocol, E). TOR1A and SLC12A5 blots were used to verify the separation between cytosolic and membrane fractions. (F) Quantification of the percentage of RAB28 present in the membrane fraction. Dot plots in A and B show data from individual mice. *P < 0.05, **P < 0.01 (2-tailed Student’s t test). The dot plot in F shows data from independent experiments. See complete unedited blots in the supplemental material.

Similar articles

References

    1. Bonifacino JS. Vesicular transport earns a Nobel. Trends Cell Biol. 2014;24(1):3–5. doi: 10.1016/j.tcb.2013.11.001. - DOI - PMC - PubMed
    1. Stefan CJ, et al. Membrane dynamics and organelle biogenesis-lipid pipelines and vesicular carriers. BMC Biol. 2017;15(1):102. doi: 10.1186/s12915-017-0432-0. - DOI - PMC - PubMed
    1. Zhukovsky MA, et al. Phosphatidic acid in membrane rearrangements. FEBS Lett. 2019;593(17):2428–2451. doi: 10.1002/1873-3468.13563. - DOI - PubMed
    1. Harayama T, Riezman H. Understanding the diversity of membrane lipid composition. Nat Rev Mol Cell Biol. 2018;19(5):281–296. doi: 10.1038/nrm.2017.138. - DOI - PubMed
    1. Barnes CL, et al. Compartmentalization of photoreceptor sensory cilia. Front Cell Dev Biol. 2021;9:636737. doi: 10.3389/fcell.2021.636737. - DOI - PMC - PubMed

Publication types