. 2023 Nov 16;134(3):e170397.
doi: 10.1172/JCI170397.

Multiomic screening of invasive GBM cells reveals targetable transsulfuration pathway alterations

Affiliations

Multiomic screening of invasive GBM cells reveals targetable transsulfuration pathway alterations

Joseph H Garcia et al. J Clin Invest. .

Abstract

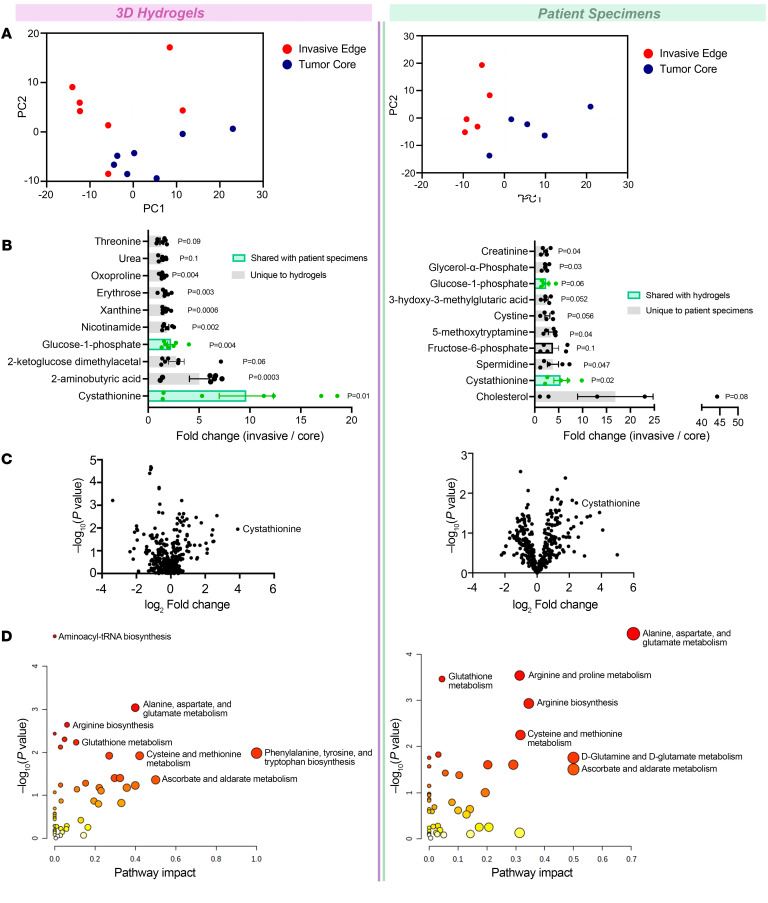
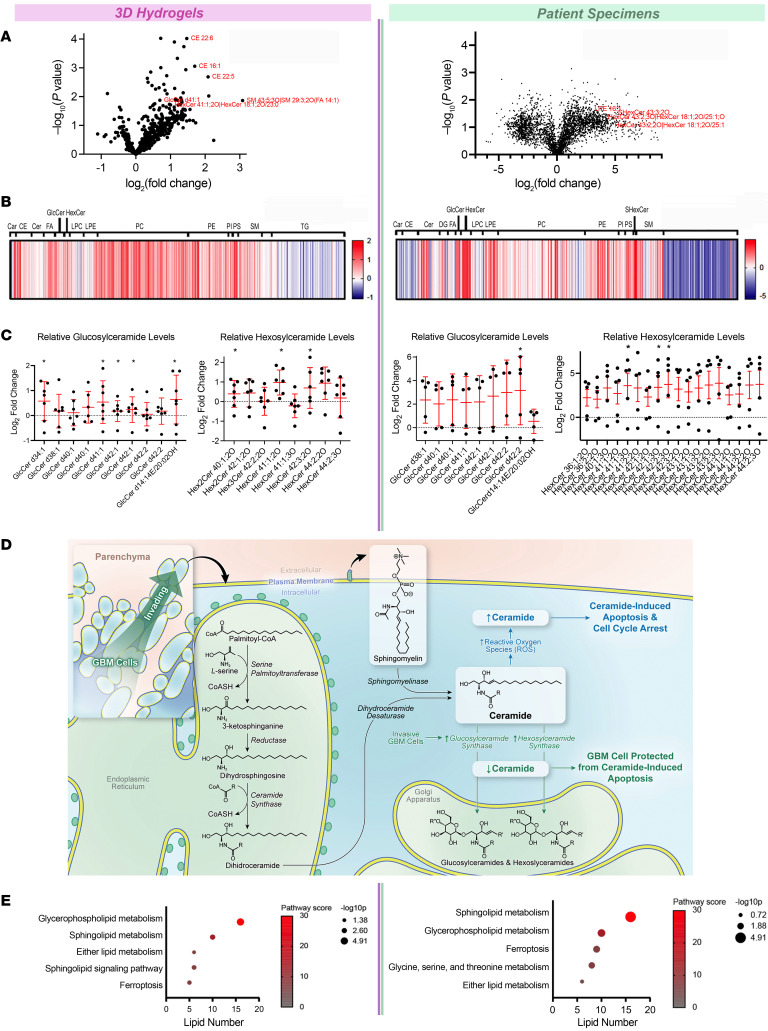
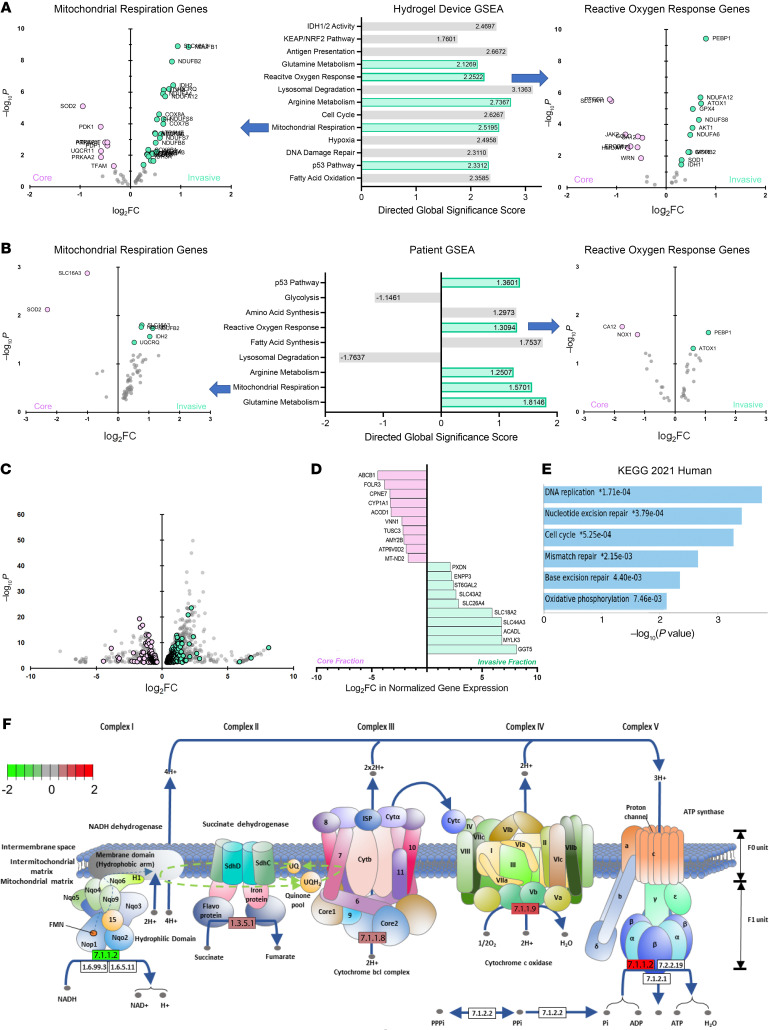
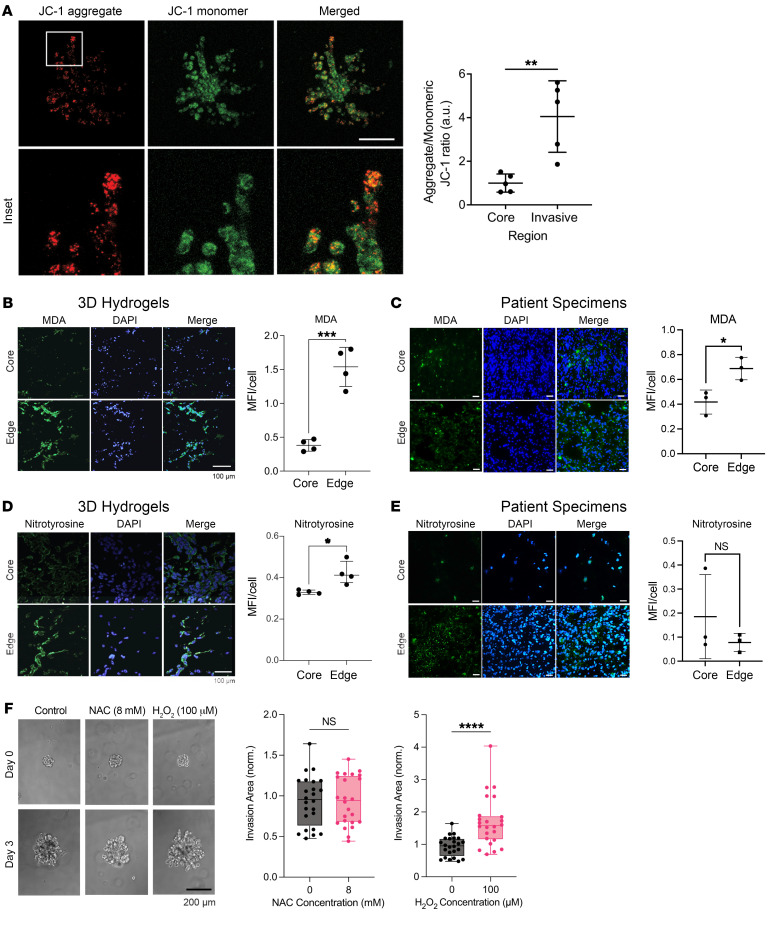
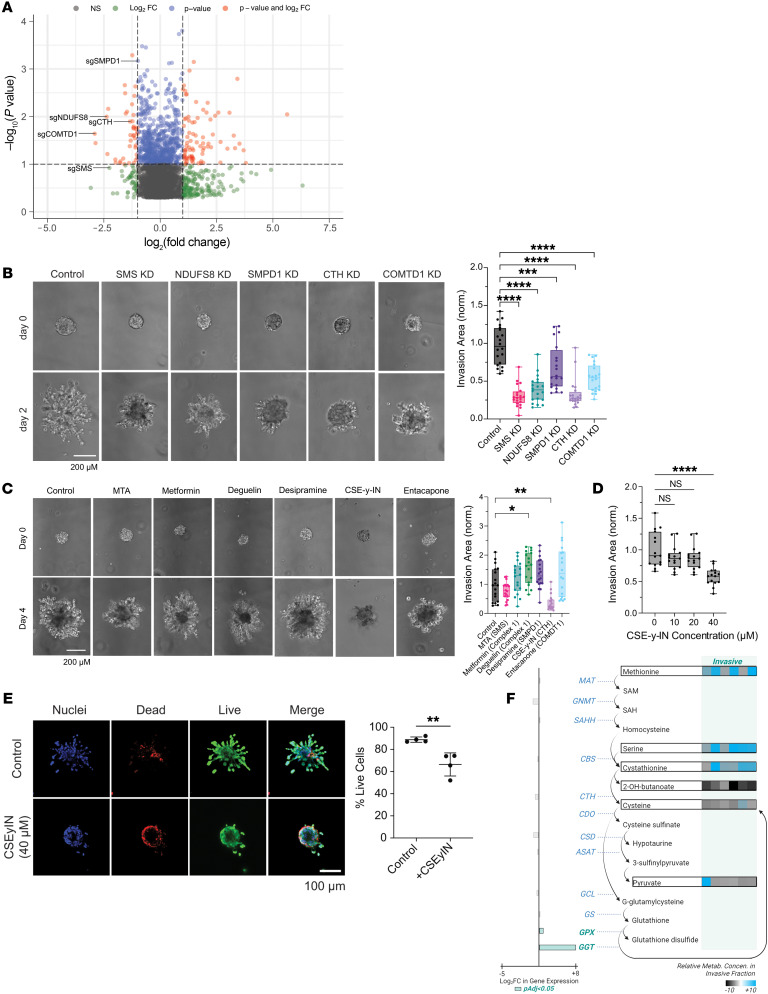
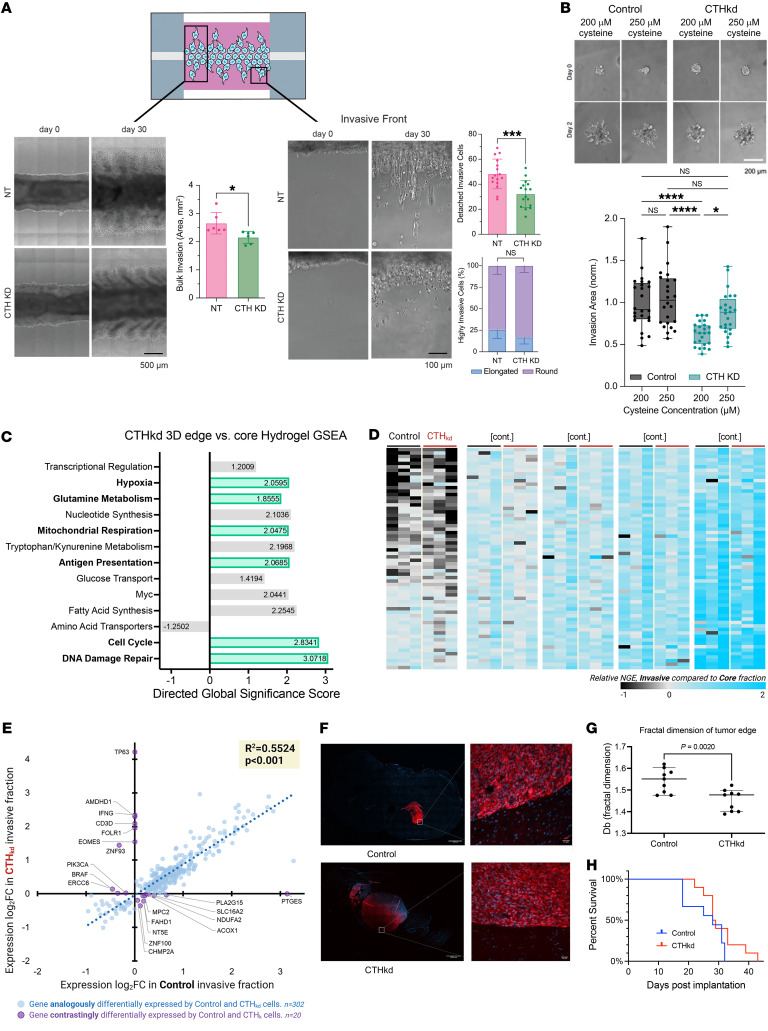
While the poor prognosis of glioblastoma arises from the invasion of a subset of tumor cells, little is known of the metabolic alterations within these cells that fuel invasion. We integrated spatially addressable hydrogel biomaterial platforms, patient site-directed biopsies, and multiomics analyses to define metabolic drivers of invasive glioblastoma cells. Metabolomics and lipidomics revealed elevations in the redox buffers cystathionine, hexosylceramides, and glucosyl ceramides in the invasive front of both hydrogel-cultured tumors and patient site-directed biopsies, with immunofluorescence indicating elevated reactive oxygen species (ROS) markers in invasive cells. Transcriptomics confirmed upregulation of ROS-producing and response genes at the invasive front in both hydrogel models and patient tumors. Among oncologic ROS, H2O2 specifically promoted glioblastoma invasion in 3D hydrogel spheroid cultures. A CRISPR metabolic gene screen revealed cystathionine γ-lyase (CTH), which converts cystathionine to the nonessential amino acid cysteine in the transsulfuration pathway, to be essential for glioblastoma invasion. Correspondingly, supplementing CTH knockdown cells with exogenous cysteine rescued invasion. Pharmacologic CTH inhibition suppressed glioblastoma invasion, while CTH knockdown slowed glioblastoma invasion in vivo. Our studies highlight the importance of ROS metabolism in invasive glioblastoma cells and support further exploration of the transsulfuration pathway as a mechanistic and therapeutic target.

Keywords: Amino acid metabolism; Bioenergetics; Brain cancer; Metabolism; Oncology.


Figures

Figure 1
Figure 1. Invasive GBM cells display a distinct metabolic profile in which cystathionine and other oxidative stress metabolites are upregulated.
Shown are results from metabolomic analysis of cells from the invasive front and tumor core of GBM43 cells in 3D hydrogels (left) and site-directed biopsies (right) of patient GBMs. (A) PCAs from hydrogels (left, n = 7/group) and site-directed patient biopsies (right, n = 5/group). (B) Bar graphs displaying 10 most enriched metabolites by t test at the invasive tumor front versus core of hydrogels (left) and patient tumors (right). (C) Volcano plots displaying fold change for metabolites in the invasive front of hydrogels (left) and patient tumors (right) compared with the tumor core. (D) MetaboAnalyst identified pathways upregulated at the invasive tumor front of hydrogels (left) and patient GBMs (right). Pathways are plotted according to significance (y axis) and pathway impact value (x axis). Node color is based on P value (darker colors = more significance), and node radius is based on pathway impact values (larger circles = greater pathway enrichment). Most contributing pathways are in the top right corner.
Figure 2
Figure 2. Lipidomic profiling indicates increased oxidative stress, lipid peroxidation, and apoptotic signaling at the invasive GBM front.
Shown are results from unbiased lipidomic analysis of cells from the invasive front and tumor core of GBM43 cells in 3D hydrogels and site-directed biopsies of patient GBMs. (A) Volcano plots displaying relative fold change for individual lipid abundance at the invasive front of hydrogels (left) and patient specimens (right) versus tumor core. (B) Heatmaps displaying relative abundance of lipids in hydrogels (left) and patient specimens (right) organized by lipid classification. (C) Relative fold change of hexosylceramide and glucosylceramide species at the invasive tumor front in hydrogels (left) and patient tumors (right). Data are represented as mean ± SD. *P < 0.05, t test. (D) Illustration of pathways enabling hexosylceramide and glucosylceramide species to protect against apoptosis in invasive GBM cells exposed to oxidative stress. (E) KEGG pathway enrichment analysis of untargeted lipidomics displaying lipid pathways upregulated at the invasive tumor front of hydrogels (left) and patient tumors (right) using bubble plots.
Figure 3
Figure 3. Gene-expression profiling demonstrates upregulated pathways involved in adapting to oxidative stress in invasive GBM cells.
(A and B) RNA from invasive and core (A) GBM43 cells from hydrogel invasion devices or (B) site-directed biopsies of patient GBMs were assessed using the NanoString nCounter panel, which analyzes expression of 770 genes from 34 metabolic pathways, with GSEA revealing enriched metabolic pathways, including 5 shared between GBM43 cells in hydrogels and patient specimens (green). Volcano plots (P and FC = probability of significance and fold change invasive versus core) are shown for genes in 2 of these pathways — mitochondrial respiration (left) and ROS response genes (right) — highlighting genes in invasive (log2FC > 0) and core (log2FC < 0) samples. (CF) Bulk RNA-Seq on invasive and core GBM43 cells isolated from hydrogels revealed the following: (C) Of 2,172 up- or downregulated (Padjusted < 0.05) genes in invasive versus core GBM43 cells (gray dots on volcano plot), 344 (16%) were involved in cellular metabolism (green dots = upregulated genes, pink dots = downregulated genes). (D) Among 2,172 up- or downregulated (Padjusted < 0.05) genes in invasive versus core GBM43 cells (gray dots on volcano plot), shown are the 10 most up- and downregulated metabolic genes (green dots = upregulated genes, pink dots = downregulated genes and listed accordingly in the graph to the right). (E) KEGG pathway analysis of genes enriched in invasive GBM cells implicated pathways involved in the production of and response to ROS. (F) Gene-expression changes overlaid on an oxidative phosphorylation schematic revealed upregulated genes encoding mitochondrial complexes II–V in invasive GBM43 cells versus those in the core.
Figure 4
Figure 4. Invasive GBM cells exhibit increased ROS.
Analyses by paired (AE) or unpaired (F) t tests. (A) Spheroid invasion assays in GBM43 cells incubated with JC-1 dye revealed increased mitochondrial membrane potential in invasive GBM43 cells (P < 0.01; n = 5 pairs). (B and C) MDA staining of (B) hydrogels and (C) patient specimens revealed increasing MDA in the edge versus the core of hydrogels (P < 0.001; n = 4 pairs) and patient specimens (P = 0.025; n = 3 pairs). (D and E) Nitrotyrosine staining of (D) hydrogels and (E) patient specimens revealed increased staining in the edge versus the core in the hydrogels (P < 0.05; n = 4 pairs), but not in the patient specimens (P = 0.5; n = 3 pairs). (F) While H2O2 increased invasion of GBM43 cells in HA hydrogels (P < 0.0001), ROS scavenger NAC did not affect invasion (P = NS) of GBM spheroids in HA hydrogel invasion assays (n = 24 spheres, collected across 3 independent experiments). *P < 0.05; **P < 0.01; ***P < 0.001; ****P < 0.0001. Original magnification, ×20 (B, C, D, E); ×10 (F). Scale bars: 200 μm (A); 100 μm (B, D); 50 μm (C, E); 200 μm (F).
Figure 5
Figure 5. Metabolic CRISPR screen to identify metabolic genes essential to GBM invasion reveals that ROS response genes including CTH are necessary for GBM cell invasion.
Analyses used ANOVA with post hoc Tukey’s (BD) or t test (E). (A) Volcano plot displaying enrichment of sgRNAs for metabolic genes in the core (log2fold change < 0) and invasive front (log2fold change > 0) of GBM 3D invasion devices, with labeling of the 5 genes (COMTD1, SMS, CTH, SMPD1, and NDUFS8) selected for further evaluation. (B) Quantification and representative images of spheroid invasion assays of 5 knockdown GBM43 cell lines selected from CRISPR screen hits compared with control cells expressing dCas9 (n = 20 spheres from 3 independent experiments). Original magnification, ×10. Scale bar: 200 μm. (C) Spheroid invasion assays of GBM43 cells treated with inhibitors of the 5 metabolic enzymes encoded by genes chosen from the CRISPR screen (n = 18 spheres from 3 independent experiments). Original magnification, ×10. Scale bar: 200 μm. (D) CTH inhibitor CSE-γ-IN slowed GBM43 tumorsphere invasion at 40 μM (P < 0.0001; n = 15 spheres across 3 independent experiments). (E) GBM43 cells treated with 40 μM CSE-γ-IN in neurosphere invasion assays exhibited cell death specifically at the spheroid edge (P < 0.01; n = 4 spheres/group). Original magnification, ×10. Scale bar: 100 μm. (F) Integrated depiction of multiomic findings from invasive GBM43 cells related to the transsulfuration pathway. Metabolites: fold changes in metabolites in each invasive versus paired core fraction are indicated in the heatmap to the right (blue, upregulated; gray, downregulated), with unboxed metabolites undetected. Enzymes: log2FC for DEGs (green or pink bars for genes with Padjusted < 0.05; gray bars for genes with Padjusted > 0.05) are indicated with green or pink representing up- or downregulation in invasive cells relative to core cells, respectively. *P < 0.05; **P < 0.01; ***P < 0.001; ****P < 0.0001.
Figure 6
Figure 6. Targeting CTH inhibits GBM invasion.
Analyses used t test (A and G), ANOVA with post hoc Tukey’s test (B), Pearson’s correlation (E), or Kaplan-Meier test (H). (A) GBM43 cells with knockdown were less invasive in 3D hydrogels based on bulk invasive area (left; P < 0.05; n = 6 regions of interest across 3 devices) and number of detached invasive cells (right; P < 0.001), with invasive cell morphology unaffected by CTHkd (right; P > 0.05; n = 16 regions of interest across 3 devices). (B) Spheroid invasion assays revealed that increasing cysteine from 200 to 250 μM reversed the slowed invasion caused by CTHkd (n = 24 spheres across 3 independent experiments). (CE) GBM43 cells with CTH knockdown of CTH were seeded into invasion devices, after which cells from core and invasive fractions were assessed using the NanoString 770 metabolic gene platform. (C) GSEA: 6/13 upregulated pathways were shared with control cells invading hydrogels (green). (D) Heatmap depicting normalized gene expression (NGE) of cells in the invasive versus core hydrogel fractions for CTHkd (red bars) and control GBM43 cells (black bars) (n = 3/group), with uniform gene-expression changes across control GBM43 versus CTHkd cells suggesting similar transcriptional profiles among invasive GBM cells regardless of CTH expression. (E) Scatter plot depicting gene expression fold change for individual genes in invasive versus core fractions for GBM43 control (x axis) and GBM43 CTHkd (y axis). The high correlation between fold change in invasive GBM43 control versus CTHkd cells (P < 0.001) means that metabolic transcriptional patterns change during invasion similarly regardless of CTH expression. Purple dots indicate genes with discordant expression changes in control GBM43 versus CTHkd cells, which are scant (20/322 total genes = 6.2%). (FH) Intracranial GBM43 PDXs expressing mCherry along with dCas9 or dCas9 with sgRNA targeting CTH (F and G) were less invasive with CTHkd (median ± 95% CI shown; P = 0.002; n = 9/group) based on fractal analysis of images of tumors and their surrounding brain, which yields fractal dimension, a measure of invasive tumor growth as a continuous number between 1 and 2, with higher numbers representing greater invasiveness and (H) exhibited unchanged survival with CTHkd (P = 0.1; n = 9–10/group). Original magnification, ×10 (left); ×20 (right). Scale bars: 25 mm (left); 1,000 mm (right). *P < 0.05; **P < 0.01; ***P < 0.001; ****P < 0.0001.

Update of

References

    1. Wen PY, et al. Glioblastoma in adults: a society for neuro-oncology (SNO) and European Society of Neuro-Oncology (EANO) consensus review on current management and future directions. Neuro Oncol. 2020;22(8):1073–1113. doi: 10.1093/neuonc/noaa106. - DOI - PMC - PubMed
    1. de Gooijer MC, et al. An experimenter’s guide to glioblastoma invasion pathways. Trends Mol Med. 2018;24(9):763–780. doi: 10.1016/j.molmed.2018.07.003. - DOI - PubMed
    1. Perry JR, et al. Short-course radiation plus temozolomide in elderly patients with glioblastoma. N Engl J Med. 2017;376(11):1027–1037. doi: 10.1056/NEJMoa1611977. - DOI - PubMed
    1. Nakada M, et al. Molecular targets of glioma invasion. Cell Mol Life Sci. 2007;64(4):458–478. doi: 10.1007/s00018-007-6342-5. - DOI - PMC - PubMed
    1. Garcia JH, et al. Metabolic drivers of invasion in glioblastoma. Front Cell Dev Biol. 2021;9:683276. doi: 10.3389/fcell.2021.683276. - DOI - PMC - PubMed

Publication types