. 2024 Feb 26;36(3):559-584.
doi: 10.1093/plcell/koad288.

A proxitome-RNA-capture approach reveals that processing bodies repress coregulated hub genes

Affiliations

A proxitome-RNA-capture approach reveals that processing bodies repress coregulated hub genes

Chen Liu et al. Plant Cell. .

Abstract

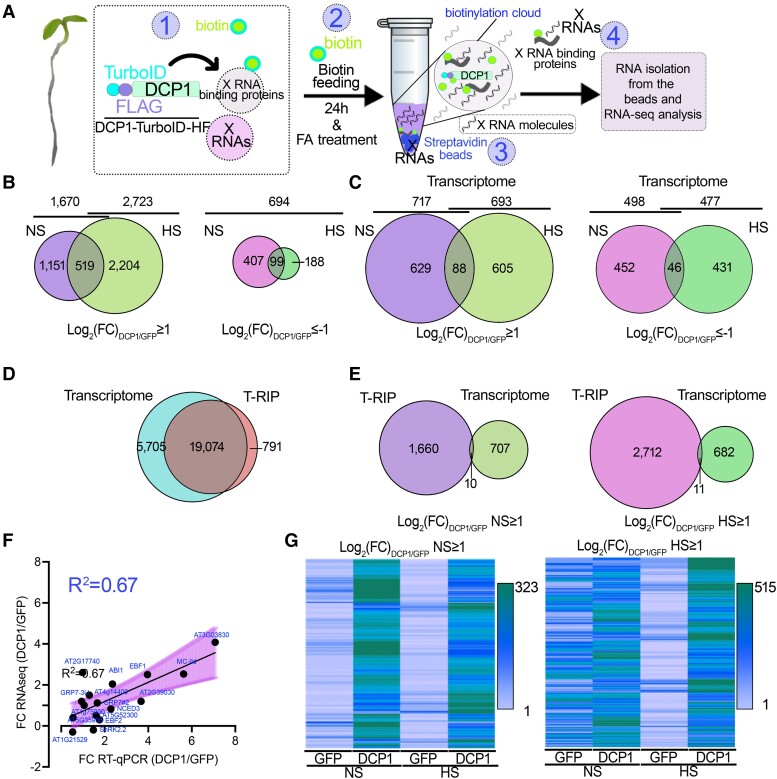
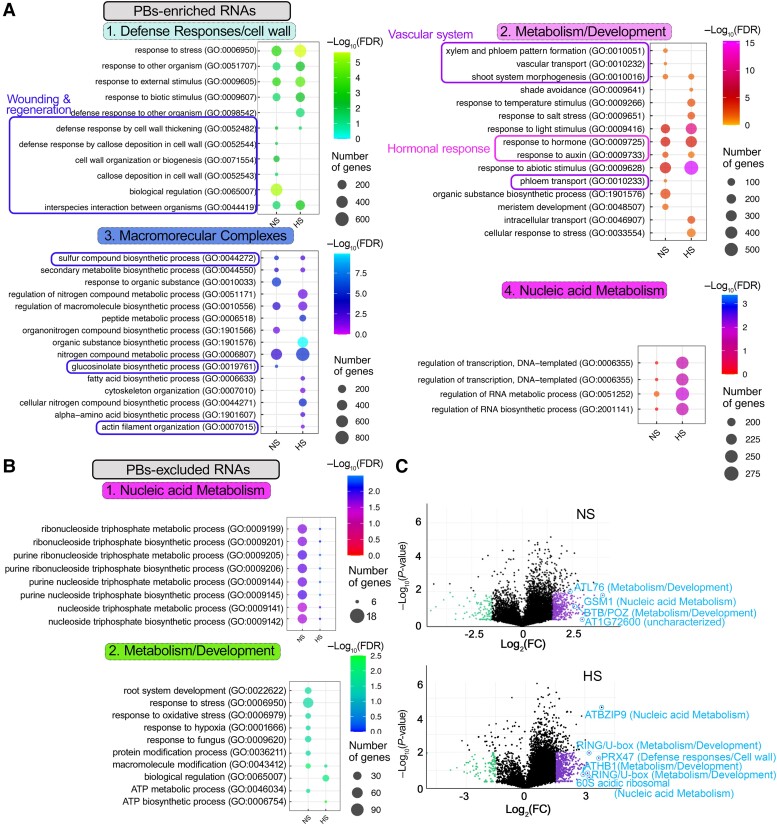
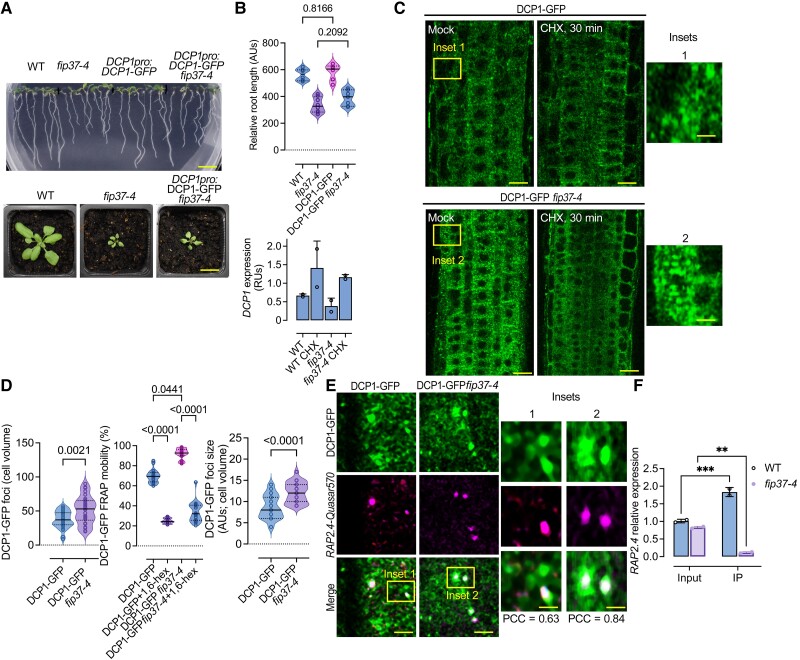
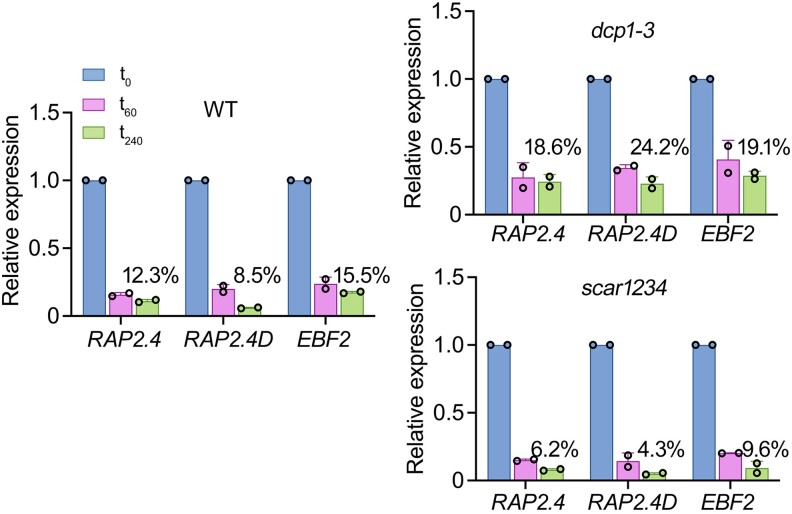
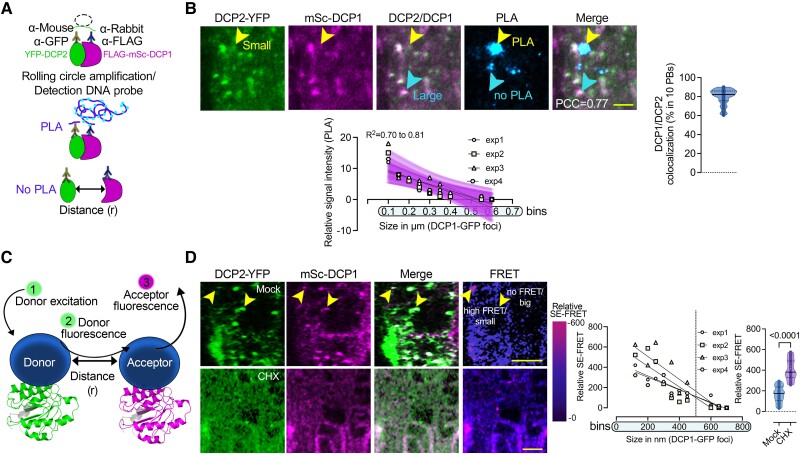
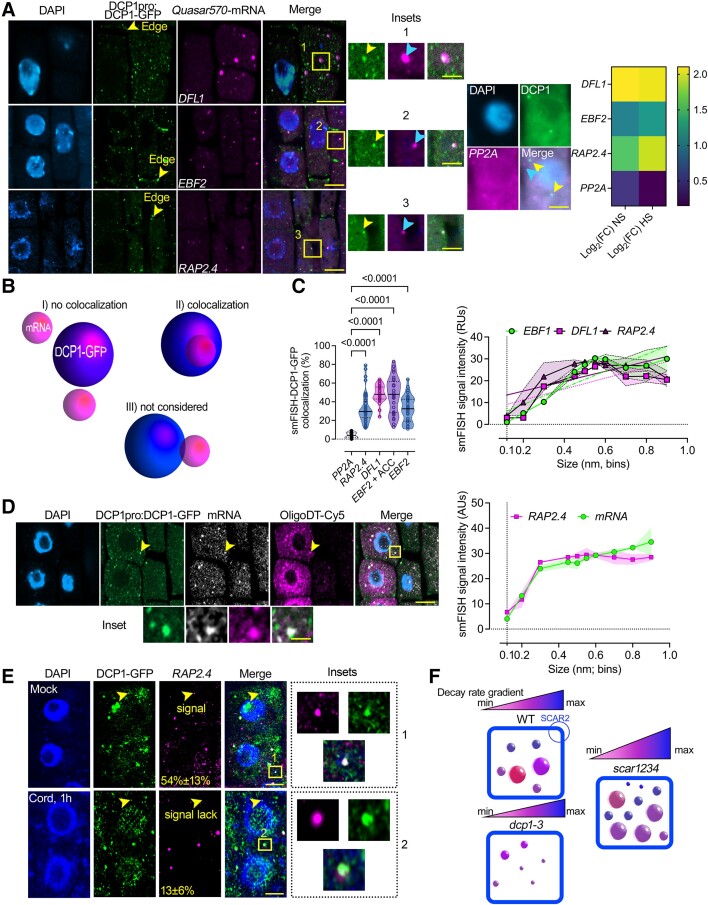
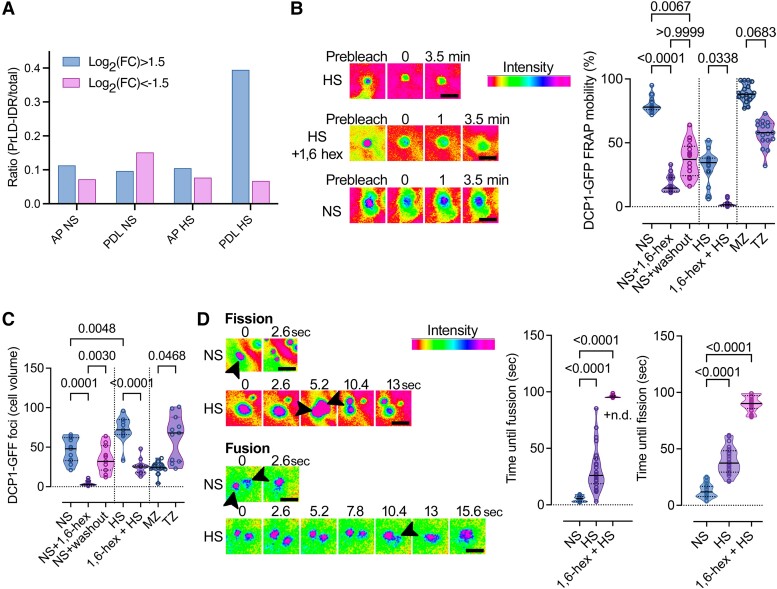
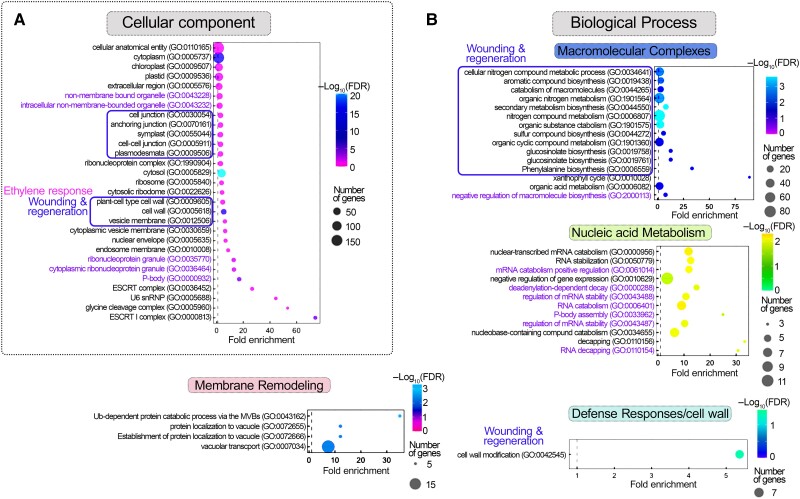
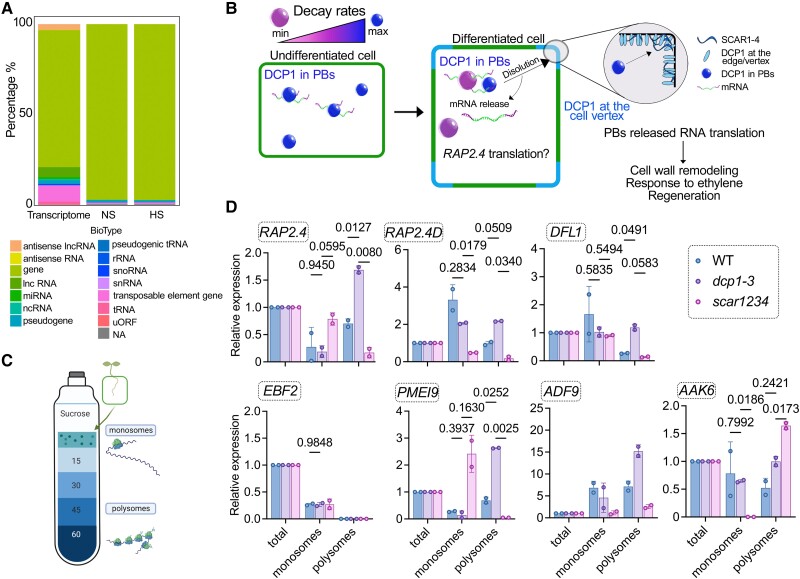
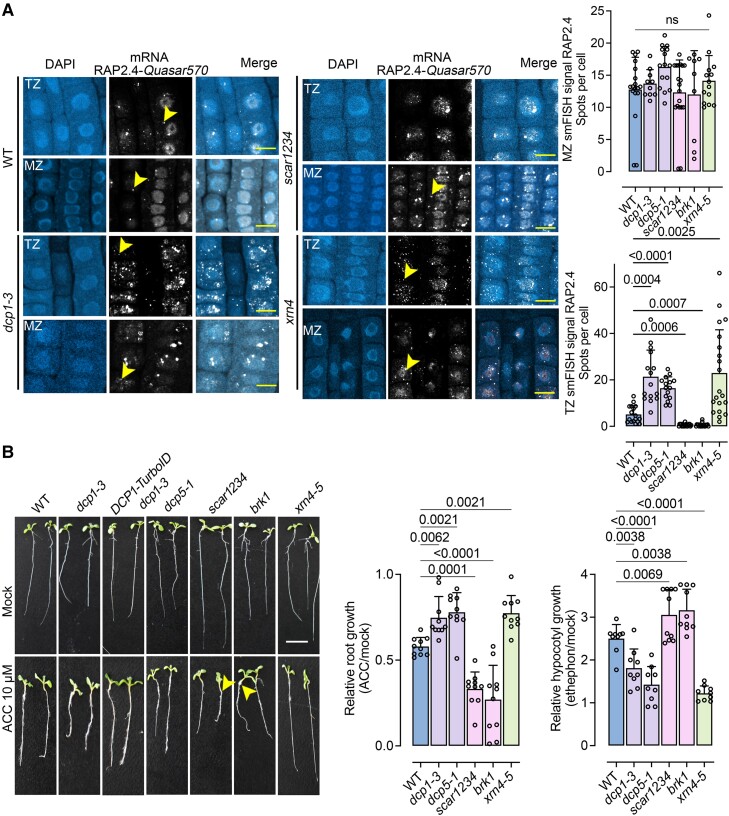
Cellular condensates are usually ribonucleoprotein assemblies with liquid- or solid-like properties. Because these subcellular structures lack a delineating membrane, determining their compositions is difficult. Here we describe a proximity-biotinylation approach for capturing the RNAs of the condensates known as processing bodies (PBs) in Arabidopsis (Arabidopsis thaliana). By combining this approach with RNA detection, in silico, and high-resolution imaging approaches, we studied PBs under normal conditions and heat stress. PBs showed a much more dynamic RNA composition than the total transcriptome. RNAs involved in cell wall development and regeneration, plant hormonal signaling, secondary metabolism/defense, and RNA metabolism were enriched in PBs. RNA-binding proteins and the liquidity of PBs modulated RNA recruitment, while RNAs were frequently recruited together with their encoded proteins. In PBs, RNAs follow distinct fates: in small liquid-like PBs, RNAs get degraded while in more solid-like larger ones, they are stored. PB properties can be regulated by the actin-polymerizing SCAR (suppressor of the cyclic AMP)-WAVE (WASP family verprolin homologous) complex. SCAR/WAVE modulates the shuttling of RNAs between PBs and the translational machinery, thereby adjusting ethylene signaling. In summary, we provide an approach to identify RNAs in condensates that allowed us to reveal a mechanism for regulating RNA fate.


Conflict of interest statement

Conflict of interest statement. None declared.

Figures

Figure 1.
Figure 1.
T-RIP approach for the capture of PBs-associated RNAs. A) Pipeline for T-RIP: (i) Plants were submerged in 50 μM biotin for 1 min under a vacuum. The biotin solution was removed, and plants were placed back in the growth chamber. After 24 h, plants were left at the mock condition denoted as NS or treated with HS (22°C to 37°C for 2 h). (ii) 1% (v/v) formaldehyde was used as an RNA-protein crosslinker (fed to tissues similarly to biotin). Formaldehyde was then quenched by glycine. (iii) Proteins/RNAs were extracted as described for the APEAL approach (Liu et al. 2023); the extraction buffer was supplemented with an RNase inhibitor. The supernatants were loaded on PD-10 columns to deplete excess biotin and incubated with streptavidin-coated beads. (iv) Protease treatments were used to elute RNP complexes from the beads, and RNA was extracted. All the T-RIP samples were subjected to DNase I treatment and ribosomal RNA depletion. B) Venn diagrams showing the number of RNAs identified for T-RIP (left; log2FC≥1) and those with a high probability to be excluded from PBs (right; log2FC≤−−1; 506 RNAs in NS and 287 RNAs in HS). C) Venn diagrams showing the number of genes identified for the transcriptome (total RNA-seq) compared with the DCP1/GFP expressing lines (left, log2FC≥1; right, log2FC≤−1). Note that similar quantitative and small differences were found between samples regarding differential expression. D) Venn diagram showing the overlap between unfiltered RNAs identified for the Transcriptome (from GFP and DCP1 samples) and T-RIP. E) Venn diagram comparing the overlap between the filtered enriched RNAs in NS (log2FC≥1) of the T-RIP dataset and the corresponding transcriptome dataset in NS (left) and HS (right). Note: For esthetic reasons and readability, the Venn diagrams in B to E) are not proportional throughout and the analogies are kept only between the 2 conditions compared each time. F) Correlation between RNA levels determined by RNA-seq or RT-qPCR for the indicated genes. ACTIN7 and PP2A were used for normalization. Data are from 3 independent experiments with 2 technical duplicates (n = 2 assays). The fitted line is shown, along with the confidence intervals as a shaded area (95%, deviation from zero P = 0.0008), with a fitted equation Y = 0.4686*X + 0.2534. FC, fold change between DCP1/GFP samples. G) Heat maps showing sample gene clusters of T-RIP. RNAs were filtered either using a log2FC≥1 for genes enriched in DCP1 NS (left) or HS (right) from GFP and DCP1 samples. The color-coding bars indicate the number of RNAs.
Figure 2.
Figure 2.
Subnetworks of RNAs enriched in PBs. A) Enriched GO terms of PBs-enriched RNAs fitting into 4 subnetworks. Boxes annotate clusters: wounding and regeneration, vascular system, and plant hormonal responses. FDR, false discovery rate. B) Enriched GO terms of PBs-excluded RNAs fitting into 2 subnetworks. C) PB-enriched/depleted RNAs (log2FCDCP1/GFP) in NS (upper) or HS (lower), visualized by volcano plots. RNAs from the 4 subnetworks defined in A are indicated.
Figure 3.
Figure 3.
The m6A writer FIP37 controls stability but not the formation of PBs. A) Phenotypes of fip37-4 and fip37-4 DCP1pro:DCP1-GFP seedlings [7 d after germination (DAG)]. Lower: corresponding phenotypes of rosettes. Scale bars, 1 cm. B) Relative root length of wild type (WT), fip37-4 or fip37-4 DCP1pro:DCP1-GFP seedlings. Data are means (±Sd) of 3 independent experiments with 2 technical replicates (n = 2 with 10 roots from 7 DAG seedlings), and significance was determined by ordinary 1-way ANOVA. Lower: RT-qPCR of DCP1 expression in WT or fip37-4 DCP1pro:DCP1-GFP seedlings (7 DAG) in the presence or absence of CHX (30 μM, 30 min). TUA4 was used for normalization. Data are from 2 independent experiments with 2 technical duplicates (n = 2 assays). AUs, arbitrary units; RUs, relative units (normalized to TUA4). C) Micrographs from meristematic epidermis root cells 5 DAG expressing DCP1pro:DCP1-GFP in WT or fip37-4 in the presence or absence of CHX (30 μM, 30 min). The experiment was replicated 3 times. Scale bars, 10 μm. D) Quantification of the number of DCP1-GFP foci per cell (cell volume in μm3), corresponding FRAP mobility (%; corresponding to the initial signal recovery), and diameter (size) of PBs in WT or fip37-4. For FRAP mobility, seedlings were treated with 1,6-hexanediol (“hex”) to dissolve PBs showing liquidity. Data are means (±Sd) of 3 independent experiments with 2 technical replicates each (n = 2 with 6 to 10 roots from 5 DAG); significance was determined by ordinary 1-way ANOVA. AUs, arbitrary units. E) Micrographs from meristematic epidermis root cells 7 DAG showing smFISH detection of RAP2.4-Quasar570 mRNA (in magenta) expressing DCP1pro:DCP1-GFP in WT or fip37-4. Two independent experiments with (n = 6 to 10 cells randomly picked) showed similar results. PCC values to show colocalization of the 2 signals are noted in each panel. Scale bars, 2 μm (insets, 0.2 μm). F) IP-RT-qPCR of m6A-modified RAP2.4 in WT and fip37-4 seedlings. Data are means of 2 independent experiments with 2 technical replicates each (n = 2 IP assays from 5 DAG seedlings). Data were normalized against TUA4 (reference gene) calculated from the input sample (Parker et al. 2020). Significance was determined by ordinary 1-way ANOVA (asterisks indicate significance).
Figure 4.
Figure 4.
Decay rates modulation by the number and size of PBs of 3 PBs-enriched RNAs. RT-qPCR determination of RNA decay levels for RAP2.4, EBF2, and RAP2.4D in wild type (WT), dcp1-3, and scar1234 5 DAG and in 3-time points (0, 60, and 240 min) upon treatment with the transcription inhibitor cordycepin [1 mM, (Sorenson et al. 2018)]. The percentages show the levels of RNAs at 240 min compared with 0 min. Data are means (±Sd) of 2 independent experiments with 2 technical replicates each (n = 2 roots from 5 DAG seedlings).
Figure 5.
Figure 5.
Correlation between DCP1/DCP2 interaction with the size of PBs in root cells. A) Illustration of the PLA approach principle (see details in the main text). B) PLA signal produced by α-GFP/α-FLAG of a line co-expressing RPS5apro:HF-mScarlet-DCP1 (mSc-DCP1) and 35Spro:DCP2-YFP. The “spots” (violet “PLA”) do not connote physiologically relevant puncta (e.g. condensates). The colocalization of PLA spots with DCP1–DCP2 signals is also shown (noted as PCC). Scale bars, 5 μm. Lower: correlation between the size of PBs (DCP1–GFP foci) and PLA spot number (DCP1/DCP2 interaction), in 100 nm PB size bins. Data are means of 4 independent experiments with 2 technical replicates each (n = 2 roots with 5 meristematic epidermal cells 5 to 7 DAG each). The simple regression analysis includes data from the 4 independent experiments denoted as “exp.” All fitted lines are shown along with the overlaid confidence intervals (purple stripe; 95%, deviation from zero P = 0.0009 to 0.0049), with a fitted equation Y = –20.54*X + 11.06). Nonlinear regression through one-phase decay predicted relevant models here. Right: colocalization of DCP1/DCP2 per 10 PBs. Data are means of 4 independent experiments with 2 technical replicates each (n = 2 roots with 5 randomly selected meristematic epidermal cells 5 to 7 DAG). C) Sensitized emission FRET principle (SE-FRET), where the emission spectrum of the donor (i) overlaps with the excitation spectrum of the acceptor (ii), and if the distance (r) between the 2 molecules is sufficient, energy is transferred (iii). D) Micrographs of root meristematic epidermal cells showing SE-FRET efficiency between mScarlet-DCP1 and DCP2–YFP in the absence or presence of CHX (10 μM 20 min). The arrowheads denote small (at the detection limit) or big PBs (upper micrograph). Scale bars, 10 μm. Right: correlation between PB size and SE-FRET efficiencies in 50 nm PBs size bins and SE-FRET efficiency in the presence or absence of CHX. Data are means of 4 independent experiments with 2 technical replicates each (n = 2 roots in each replicate with 10 randomly picked meristematic epidermal cells 5 to 7 DAG). The simple regression analysis includes data from 4 independent experiments denoted as “exp” (n = 16 to 33 cells each). All fitted lines are shown.
Figure 6.
Figure 6.
In vivo correlation between PB size and RNA levels. A) Micrographs from smFISH for detection of DFL1, EFB2, RAP2.4, and PP2A mRNAs (in magenta) in root meristematic epidermal wild type (WT) cells at 5 DAG expressing DCP1pro:DCP1-GFP. Insets: details of DCP1-GFP with each mRNA probe and with the negative control PP2a mRNA probe showing puncta colocalization (black box; arrows). Nuclei were stained with DAPI (violet). Right: DCP1-GFP/PP2A lack of colocalization and heat map showing enrichment levels for the 4 mRNAs. The experiment was replicated 3 times (n = 10 randomly selected cells). Scale bars, 2 μm (insets, 0.5 μm). B) Cartoon displaying the strategy for quantification of the colocalization between DCP1-GFP and mRNAs smFISH signal. Three major classes of colocalization are shown (I–III). Case III was not considered as colocalization since confocal microscopy may underestimate distances. C) Colocalization efficiency between mRNAs/DCP1-GFP (number of mRNA smFISH puncta in PBs/total number of mRNA puncta expressed as a percentage). Data are means of 3 independent experiments with 2 technical replicates each (n = 2 roots with 10 meristematic epidermal cells 5 DAG), and significance was determined by ordinary 1-way ANOVA. ACC, ethylene in the form of 10 μM ACC (see also Supplemental Fig. S15). Right: corresponding quantifications of the correlation between mRNAs/DCP1-GFP and PBs size in 100 nm PBs size bins. Data are means of 3 independent experiments with 2 technical replicates each (n = 2 roots with 10 randomly selected meristematic epidermal cells 5 DAG each); significance for the violin plots was determined by ordinary 1-way ANOVA. For the line plot, data are means ± Sd (SD: denoted as shaded area; N = 3 biological replicates with n = 10 randomly selected meristematic epidermal cells 5 DAG each). Fitted lines are also shown. RUs, relative units. D) Micrographs from RAP2.4 smFISH signal (gray) counterstained with oligoDT-Cy5 in root meristematic epidermal wild-type cells expressing DCP1pro:DCP1-GFP. Nuclei were stained with DAPI (violet). Arrowheads denote an example of the colocalization between RAP2.4, OligoDT, and DCP1-GFP, and the inset below denotes a detail of this colocalization. Scale bars, 10 µm. Right: quantification of the correlation between PBs size (DCP1-GFP foci) and RAP2.4/OligoDT signals in 100 nm PBs size bins. For the line plot, data are means ± Sd denoted as the shaded area (N = 3 biological replicates with n = 10 randomly selected meristematic epidermal cells 5 DAG each). Fitted lines are also shown. AUs, arbitrary units. E) Micrographs from smFISH for detection of RAP2.4 (in magenta) counterstained in the presence or absence of cordycepin (cord, 1 h), in root meristematic epidermal WT cells 5 DAG expressing DCP1pro:DCP1-GFP. Nuclei were stained with DAPI (violet). Arrowheads denote small PBs with or without smFISH signal for mock or cordycepin treatments. Percentages on micrographs indicate small PBs (∼0.2 μm), with smFISH signal ± Sd. The 2 values were statistically different at P < 0.05 (n = 10 randomly selected meristematic epidermal cells; 1-way ANOVA). Insets on the right, indicate large PBs with smFISH RAP2.4 signal for mock and cordycepin treatments. The experiment was replicated 3 times (n = 10 randomly selected cells). Scale bars, 5 μm (insets, 0.2 μm). F) Graphical representation of PBs sizes in WT, dcp1-3, and scar1234 meristematic, epidermal root cells. Above each model, there is a graphical representation of the decay rate. scar1234 contains a larger range of turnover. SCAR2 is the main protein responsible for retracting DCP1 from PBs and thus, their dissolution (Liu et al. 2023).
Figure 7.
Figure 7.
Content of PBs in proteins with LCRs during NS or HS and regulation of their dynamics. A) PrLDs and IDRs (LCRs) composition of APEAL (proteome)-enriched (log2FC > 1.5)/excluded(log2FC < −1.5) proteins [from (Liu et al. 2023)]. The ratio here represents the LCR length sum (PrLDs + IDRs) divided by the total protein length. The PDL step can identify the disordered part of the proteome in PBs (Liu et al. 2023). AP, affinity purification; PDL, proximity-dependent ligation of biotin. B) FRAP assays in the presence or absence of 1,6-hexanediol (“hex”) in NS or HS from wild type (WT) expressing DCP1pro:DCP1-GFP. The experiment was replicated more than 10 times. Note the lack of FRAP in the 1,6-hexanediol-treated sample. Right: relevant quantifications of mobile DCP1-GFP fraction from FRAP in the presence or absence of 1,6-hexanediol in NS or HS (and in washout experiments), and in MZ (meristematic) and TZ (transition) zones of the root. Data are means ± Sd (N = 6 biological replicates with n = 3 randomly selected meristematic epidermal cells 5 DAG each), and significance was calculated by an unpaired t-test (vs. the NS; 2-tailed P values are indicated). Scale bars, 400 nm. C) Quantifications of PBs in the presence or absence of 1,6-hexanediol (“hex”) in NS or HS from WT expressing DCP1pro:DCP1-GFP (cell volume in μm3). Data are means ± Sd (N = 3 biological replicates with n = 20 randomly selected meristematic epidermal cells 5 DAG each); significance determined by unpaired t-test (vs. the NS; 2-tailed P values are indicated). D) Super-resolution spinning disc microscopy images (combined with image deconvolution, ∼120 nm axial resolution at maximum acquisition speed of 0.1 s per frame) of DCP1 fusion and fission dynamics, in NS or HS conditions from WT expressing DCP1pro:DCP1-GFP. Arrowheads indicate PBs; in fission, the 2 produced PBs are indicated for HS, while in fusion the arrowhead indicates in HS the coalescence. Scale bars, 200 nm. Right: quantification of corresponding fusion and fission events in the presence or absence of 1,6-hexanediol (“hex”) in NS or HS (N = 10 biological replicates with n = 3 randomly selected meristematic epidermal cells 5 DAG each; for 1,6-hexanediol N = 2 biological replicates with n = 1 randomly selected meristematic epidermal cells 5 DAG each; significance determined by Mann–Whitney). n.d., not detected.
Figure 8.
Figure 8.
GO terms identified for common proteins/cognate RNAs in PBs. A) and B) GO analysis of enriched cellular component (A) and biological process (B) terms of common proteins/cognate of PBs-enriched RNAs and proteins. Cocluster analyses of APEAL and T-RIP enrichments reveal hubs of cell wall remodeling, membrane remodeling, and wounding/ethylene responses associated with secondary metabolism for defense and RNA metabolism (GO terms denoted with green text). FDR, false discovery rate.
Figure 9.
Figure 9.
Regulation of translational dynamics by the SCAR/WAVE-DCP1 axis. A) RNA classes of PBs-enriched RNAs (%). Total RNA corresponds to the distribution of RNAs in the whole transcriptome. NA, not available or not defined. Lnc, long noncoding; mi, micro; nc, noncoding; sno, small nucleolar; uORF, upstream open reading frame. B) Model for the dissolution of PBs by the SCAR/WAVE-DCP1 axis. The SCAR/WAVE (mainly through SCAR2) entraps DCP1 at the edge/vertex (through SCAR2), which leads to PBs dissolution and consecutive mRNA release for translation, e.g. of RAP2.4. Processes like cell wall remodeling-related processes, such as response to ethylene and regeneration could be affected. The color-coding for PBs corresponds to their ability for RNA decay. C) Cartoon showing the polysome profiling approach. The denser part [60% (w/v) sucrose] corresponds to RNAs associated with polysomes where they are mostly translated (Jang et al. 2019). D) RT-qPCR of RAP2.4, APUM, EBF2, DFL1, and PMEI9 from total RNA, monosome, or polysome fractions in wild type (WT), dcp1-3, or scar1234. Data are means of 2 independent experiments with 2 technical replicates (n = 2 RT-qPCR assays). The data were normalized against TUBULIN 4 (TUA4, reference gene) and the levels of RNAs in the input, which is denoted as “total”; significance was determined by 2-way ANOVA using a Geisser-Greenhouse correction (due to unequal variance) and Fisher's exact test for multiple comparisons.
Figure 10.
Figure 10.
Modulation of RAP2.4 levels and the ethylene response by the SCAR/WAVE-DCP1 axis. A) Micrographs from smFISH for the detection of RAP2.4. mRNA (gray) in the root epidermal cells of the MZ and TZ zones in the corresponding mutants [wild type (WT), dcp1-3, scar1234, and xrn4-5]. The yellow arrowheads denote RAP2.4 signal. The experiment was replicated 3 times. Scale bars, 12 μm. Right: corresponding quantifications with the number of smFISH spots in WT, dcp1-3, scar1234, and xrn4-5. Data are means of 3 independent experiments with 2 technical replicates each (n = 2 roots each with 10 MZ or TZ randomly selected cells at 5 DAG), and significance was determined by ordinary 1-way ANOVA. ns, not significant. B) Photos showing growth in the absence or presence of the ethylene precursor ACC (10 μM 5 DAG). The experiment was replicated 3 times (n = 10 seedlings in each replicate). Arrowheads denote the elongated hypocotyls in scar1234 and brk1. Also, note the complementation of DCP1-TurboID expressing dcp1-3 (mainly upon ACC treatment). Scale bars, 1 cm. Right: corresponding quantifications of hypocotyl and root length in the presence or absence of ACC. Data are means ± Sd (N = 3 biological replicates with n = 10 roots/hypocotyls each); significance was determined by ordinary 1-way ANOVA with Dunnett's corrections.

Similar articles

Cited by

References

    1. Alberti S, Gladfelter A, Mittag T. Considerations and challenges in studying liquid-liquid phase separation and biomolecular condensates. Cell. 2019:176(3):419–434. 10.1016/j.cell.2018.12.035 - DOI - PMC - PubMed
    1. Anderson SJ, Kramer MC, Gosai SJ, Yu X, Vandivier LE, Nelson ADL, Anderson ZD, Beilstein MA, Fray RG, Lyons E, et al. . N(6)-methyladenosine inhibits local ribonucleolytic cleavage to stabilize mRNAs in Arabidopsis. Cell Rep. 2018:25(5):1146–1157.e1143. 10.1016/j.celrep.2018.10.020 - DOI - PubMed
    1. Baumann K. mRNA translation in stress granules is not uncommon. Nat Rev Mol Cell Biol. 2021:22(3):164. 10.1038/s41580-021-00331-3 - DOI - PubMed
    1. Beutel O, Maraspini R, Pombo-Garcia K, Martin-Lemaitre C, Honigmann A. Phase separation of zonula occludens proteins drives formation of tight junctions. Cell. 2019:179(4):923–936.e911. 10.1016/j.cell.2019.10.011 - DOI - PubMed
    1. Blake LA, Liu Y, Inoue T, Wu B. A rapid inducible RNA decay system reveals fast mRNA decay in P-bodies. bioRxiv 538452. 10.1101/2023.04.26.538452, 26 April 2023, preprint: not peer reviewed. - DOI - PMC - PubMed