. 2024 Aug;122(2):133-151.
doi: 10.1111/mmi.15190. Epub 2023 Nov 16.

Post-translational modification by the Pgf glycosylation machinery modulates Streptococcus mutans OMZ175 physiology and virulence

Affiliations

Post-translational modification by the Pgf glycosylation machinery modulates Streptococcus mutans OMZ175 physiology and virulence

Nicholas de Mojana di Cologna et al. Mol Microbiol. 2024 Aug.

Abstract

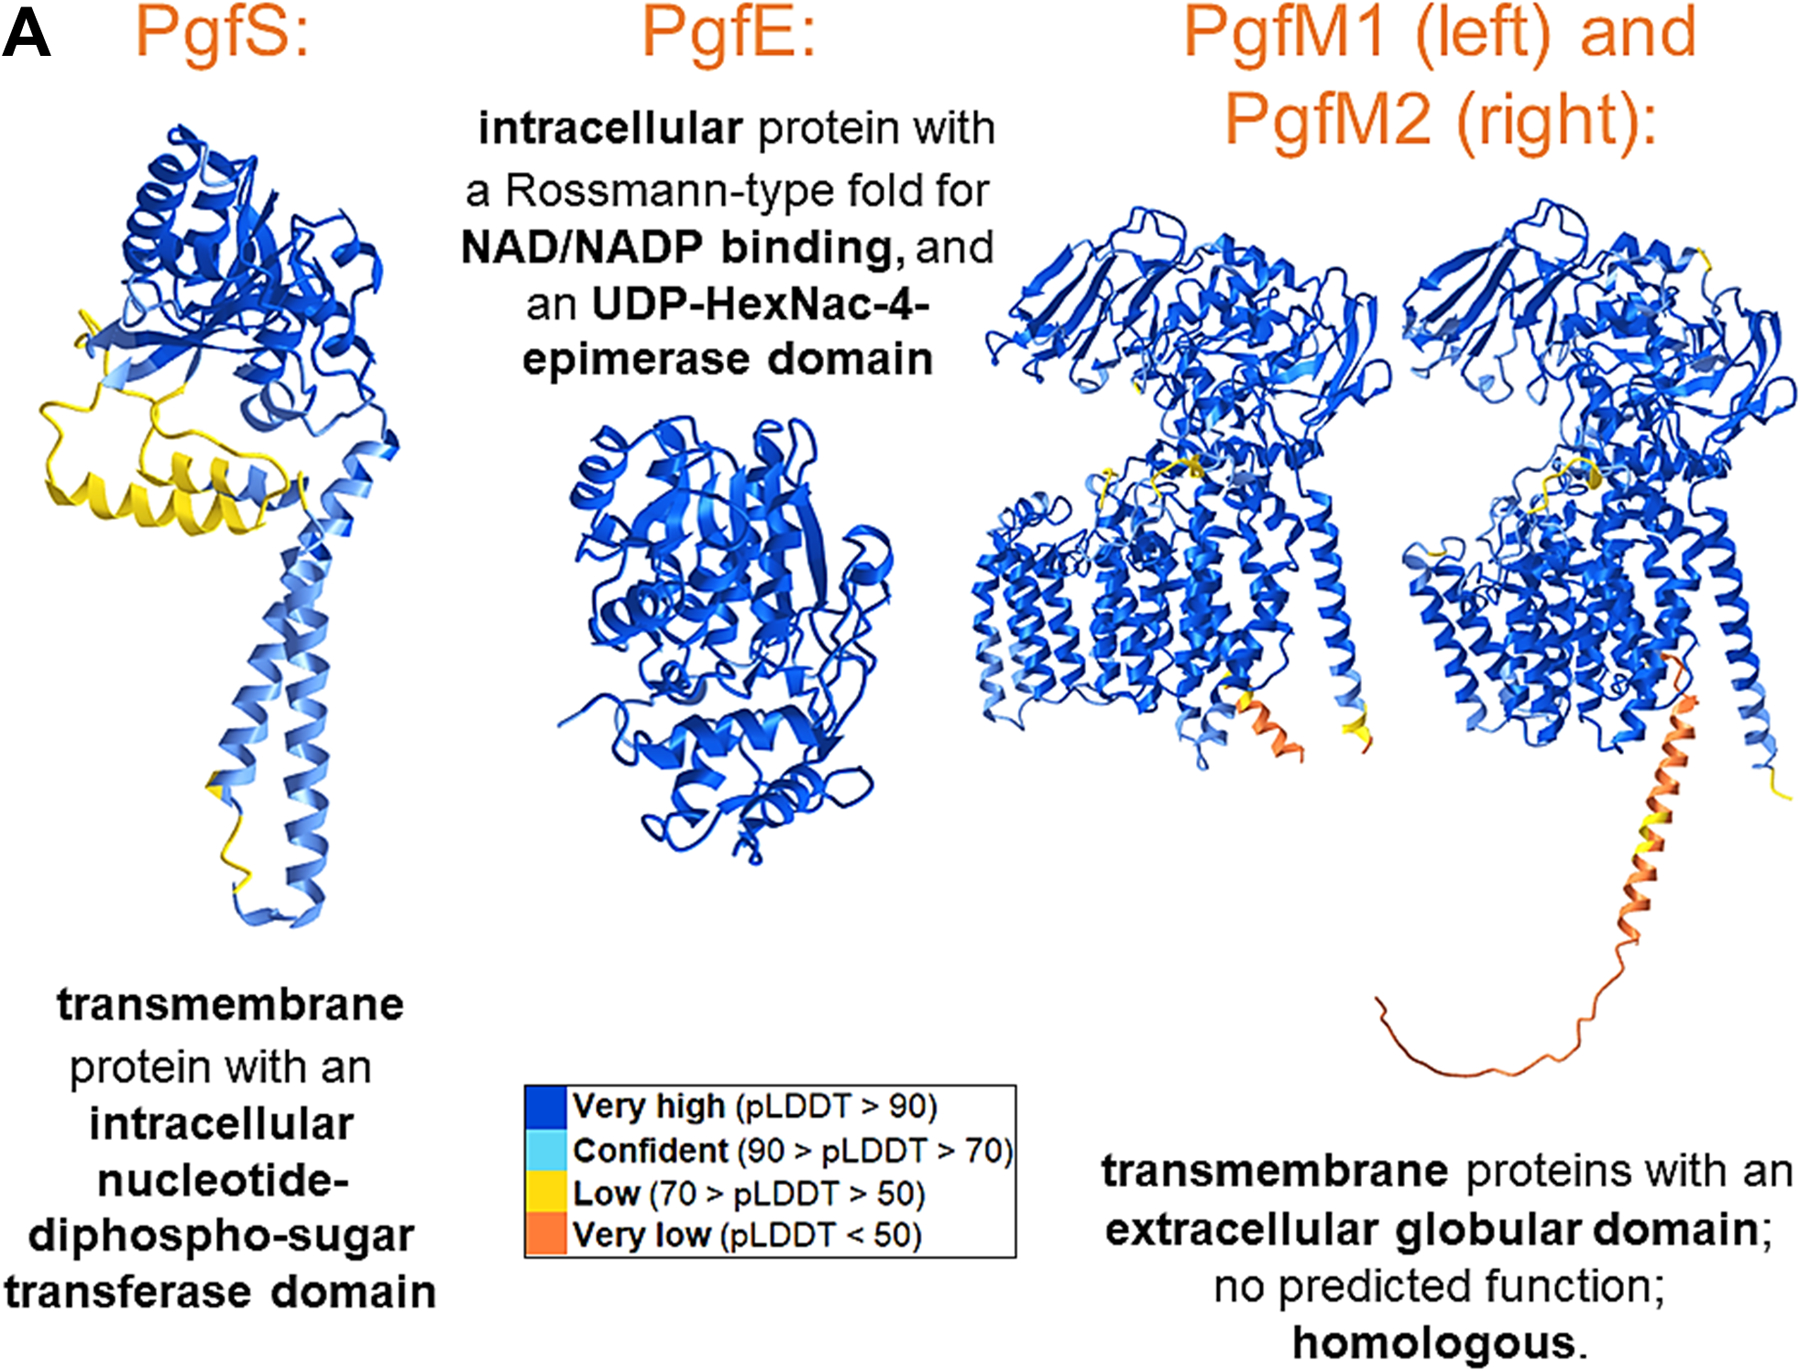
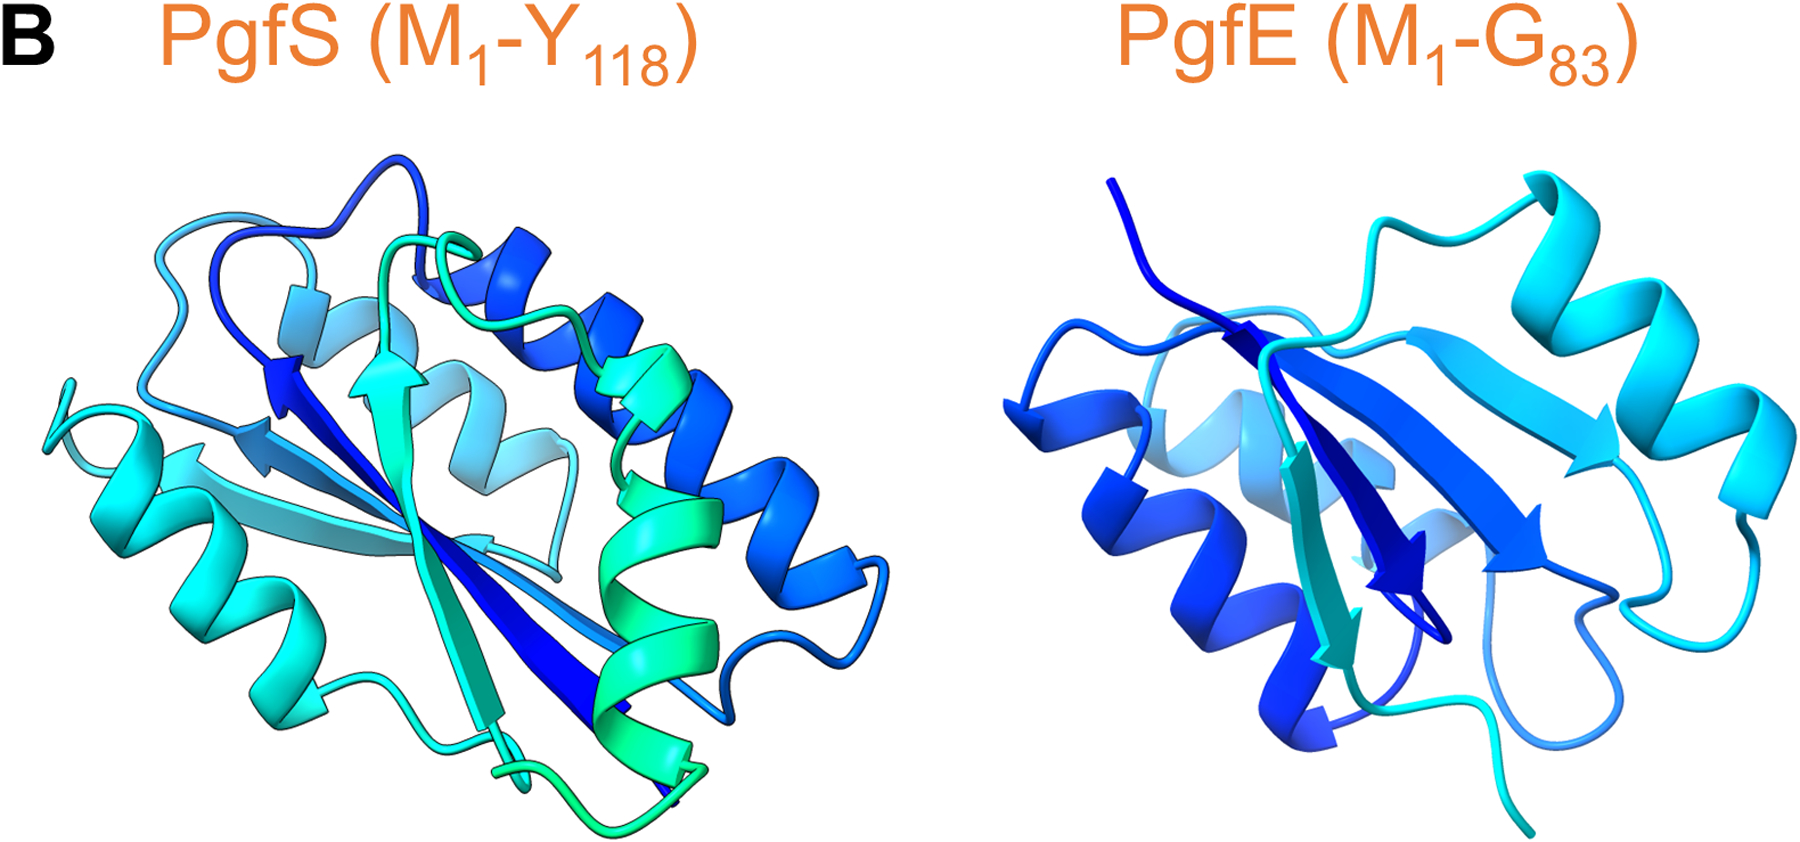
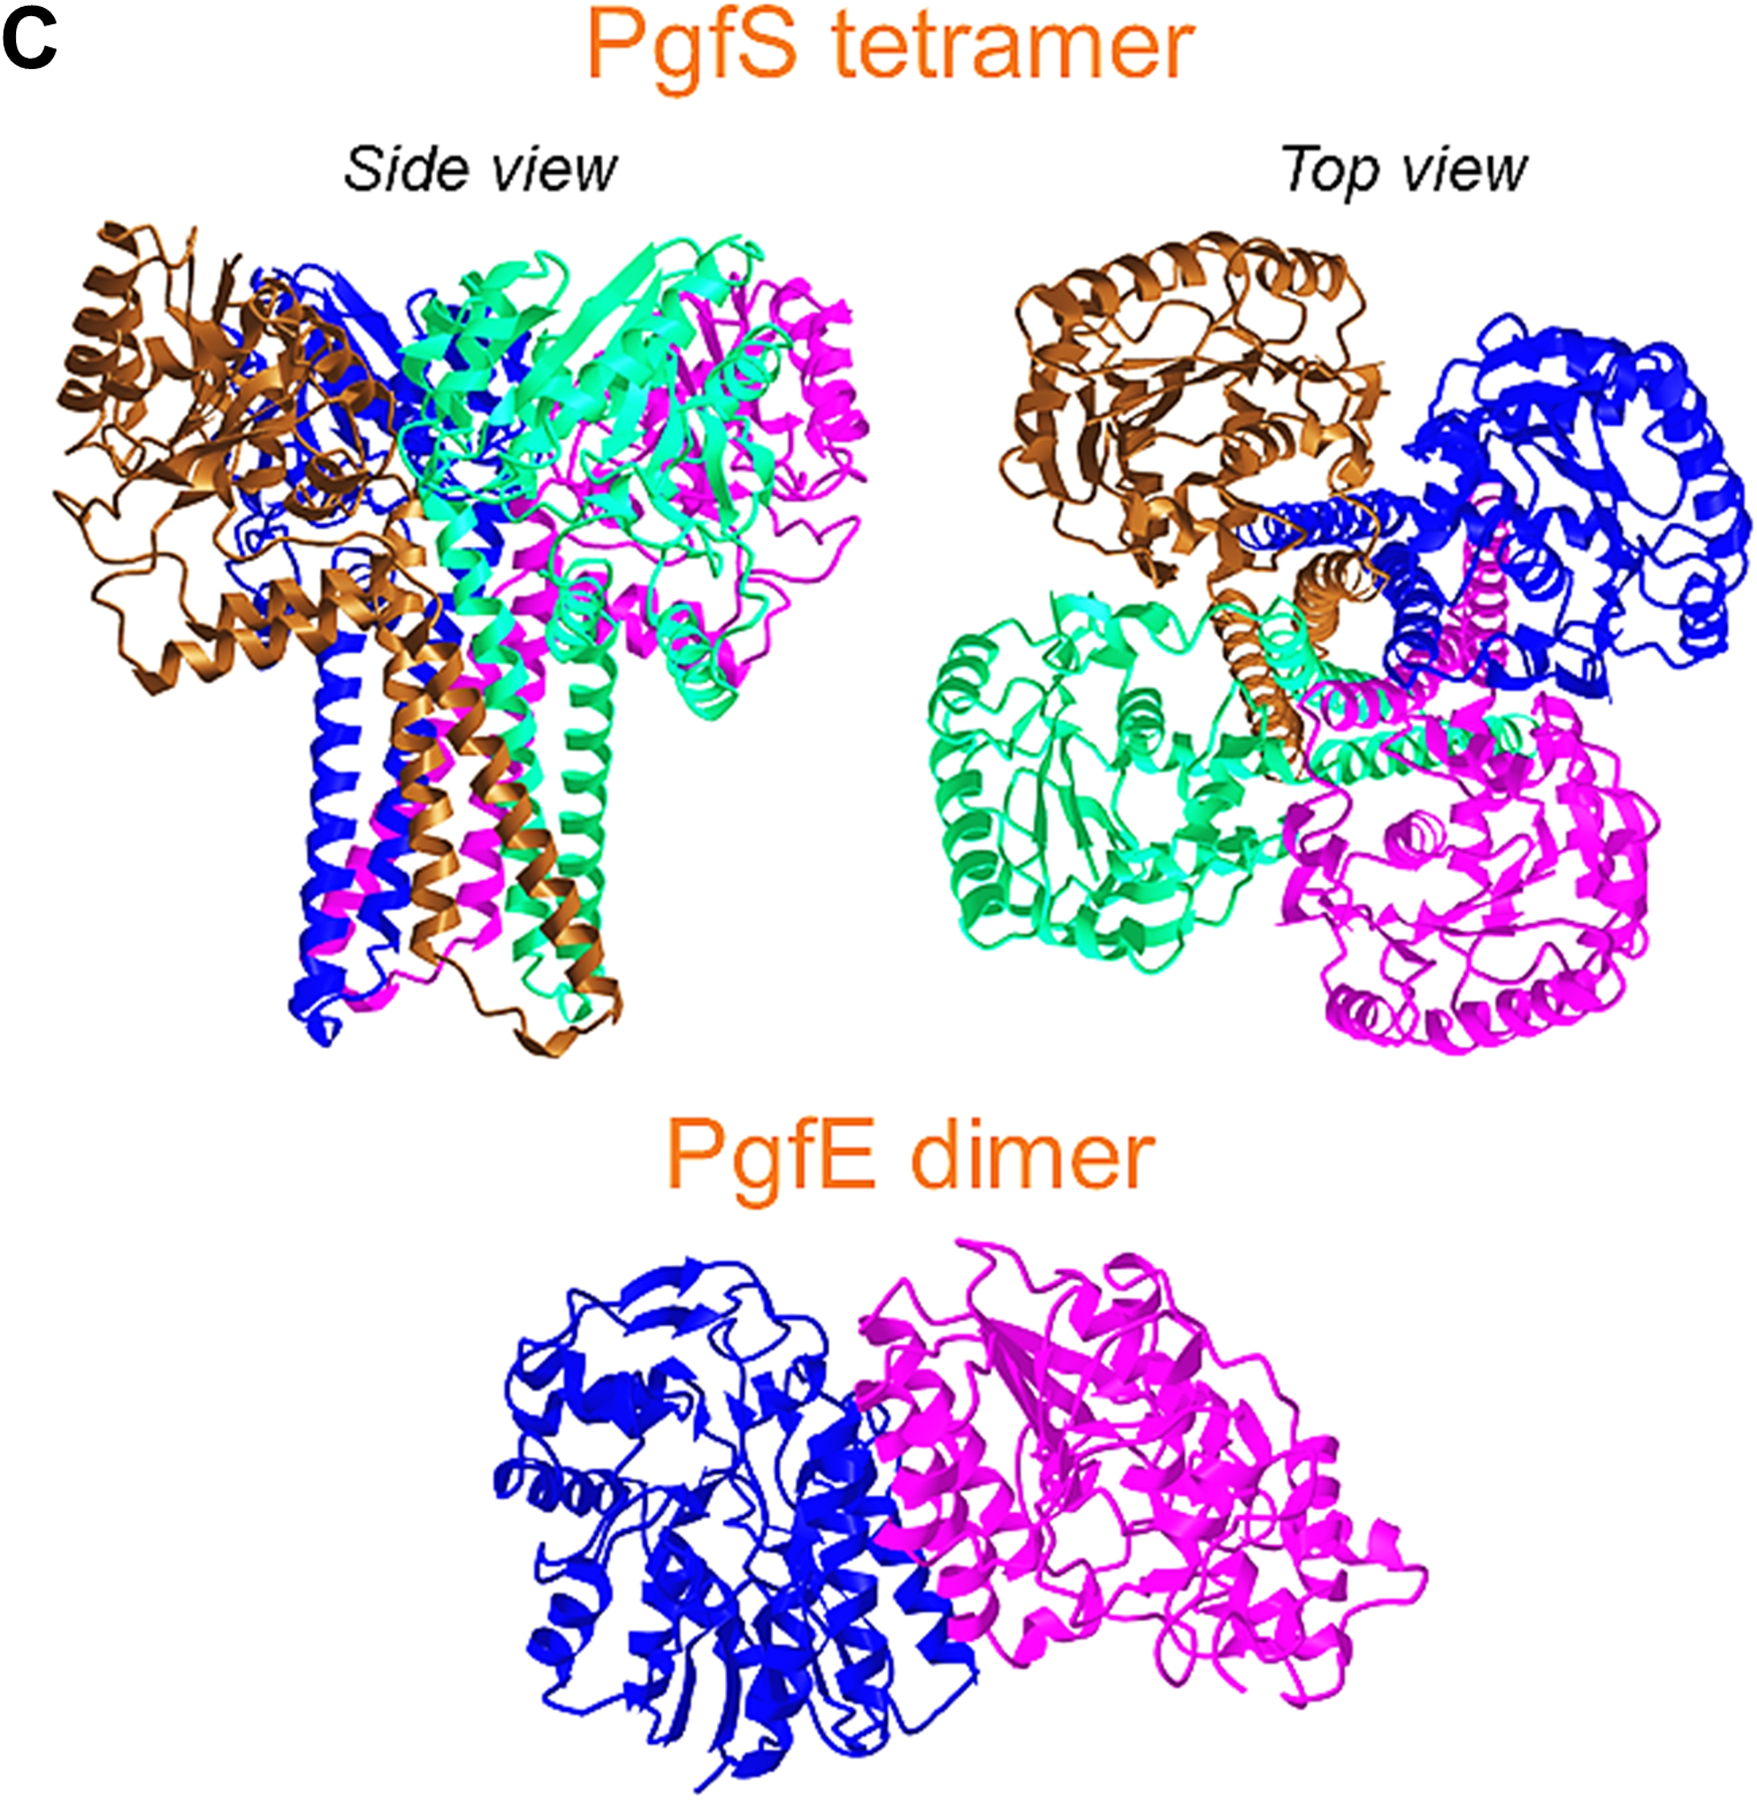
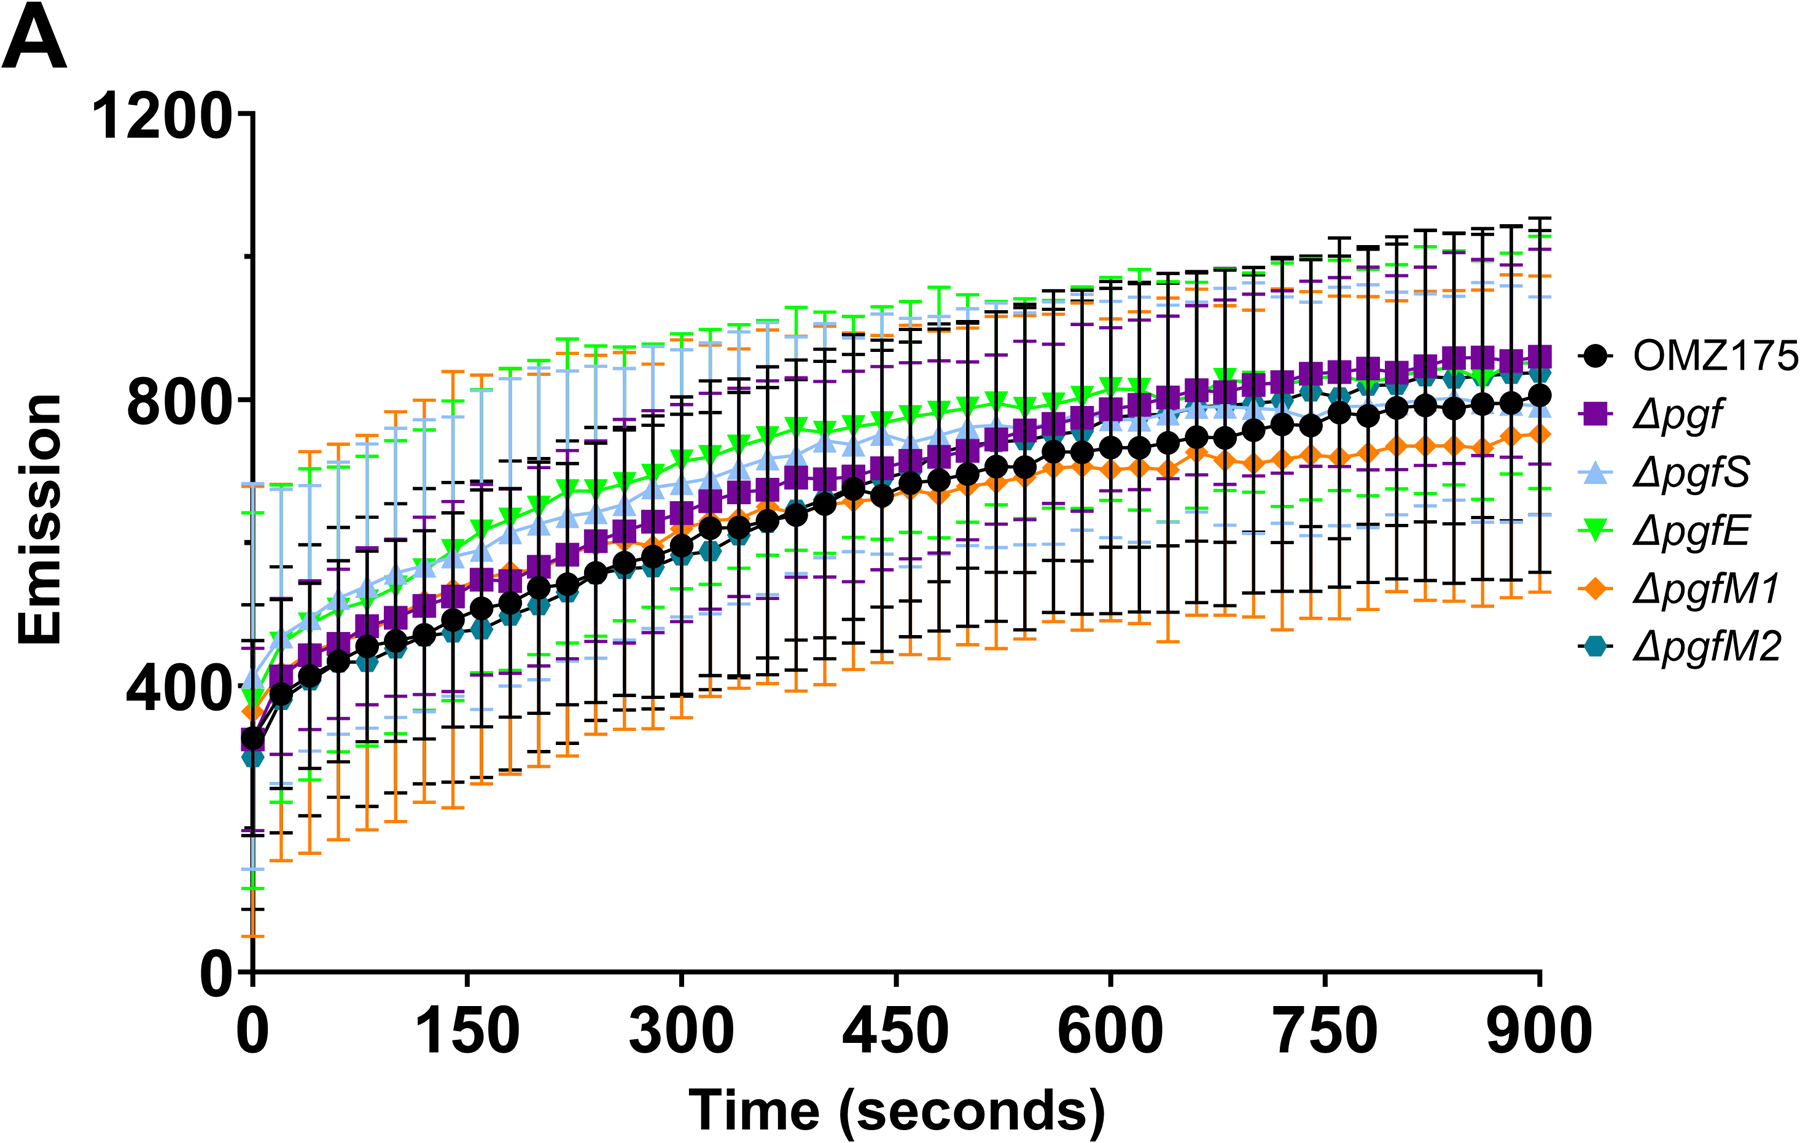
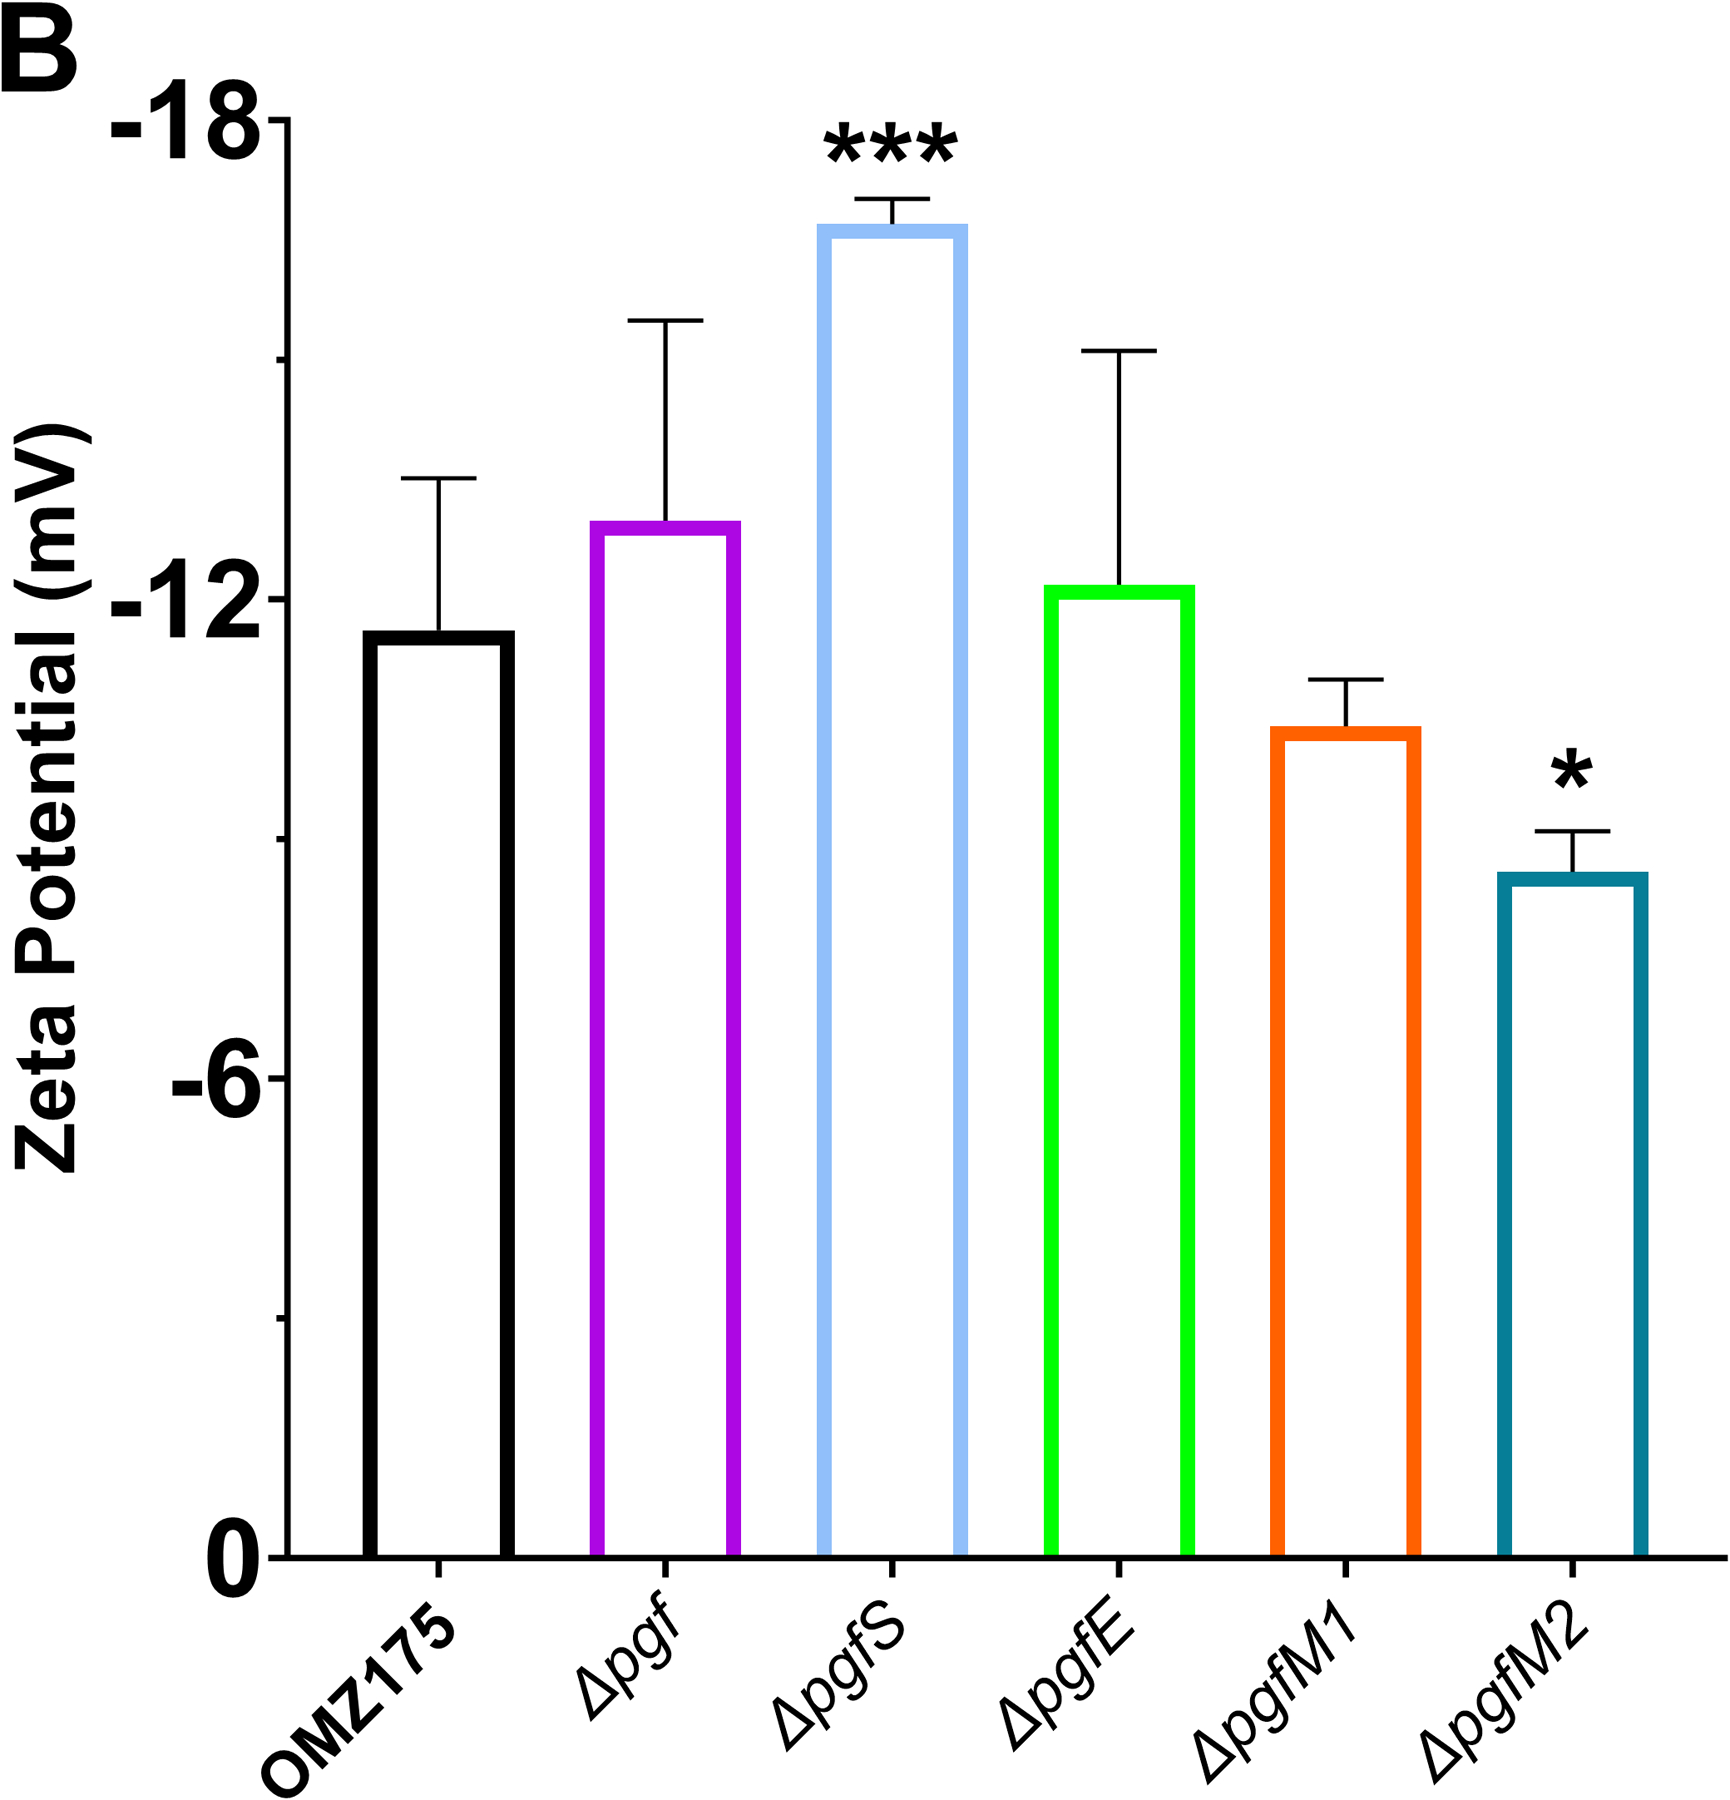
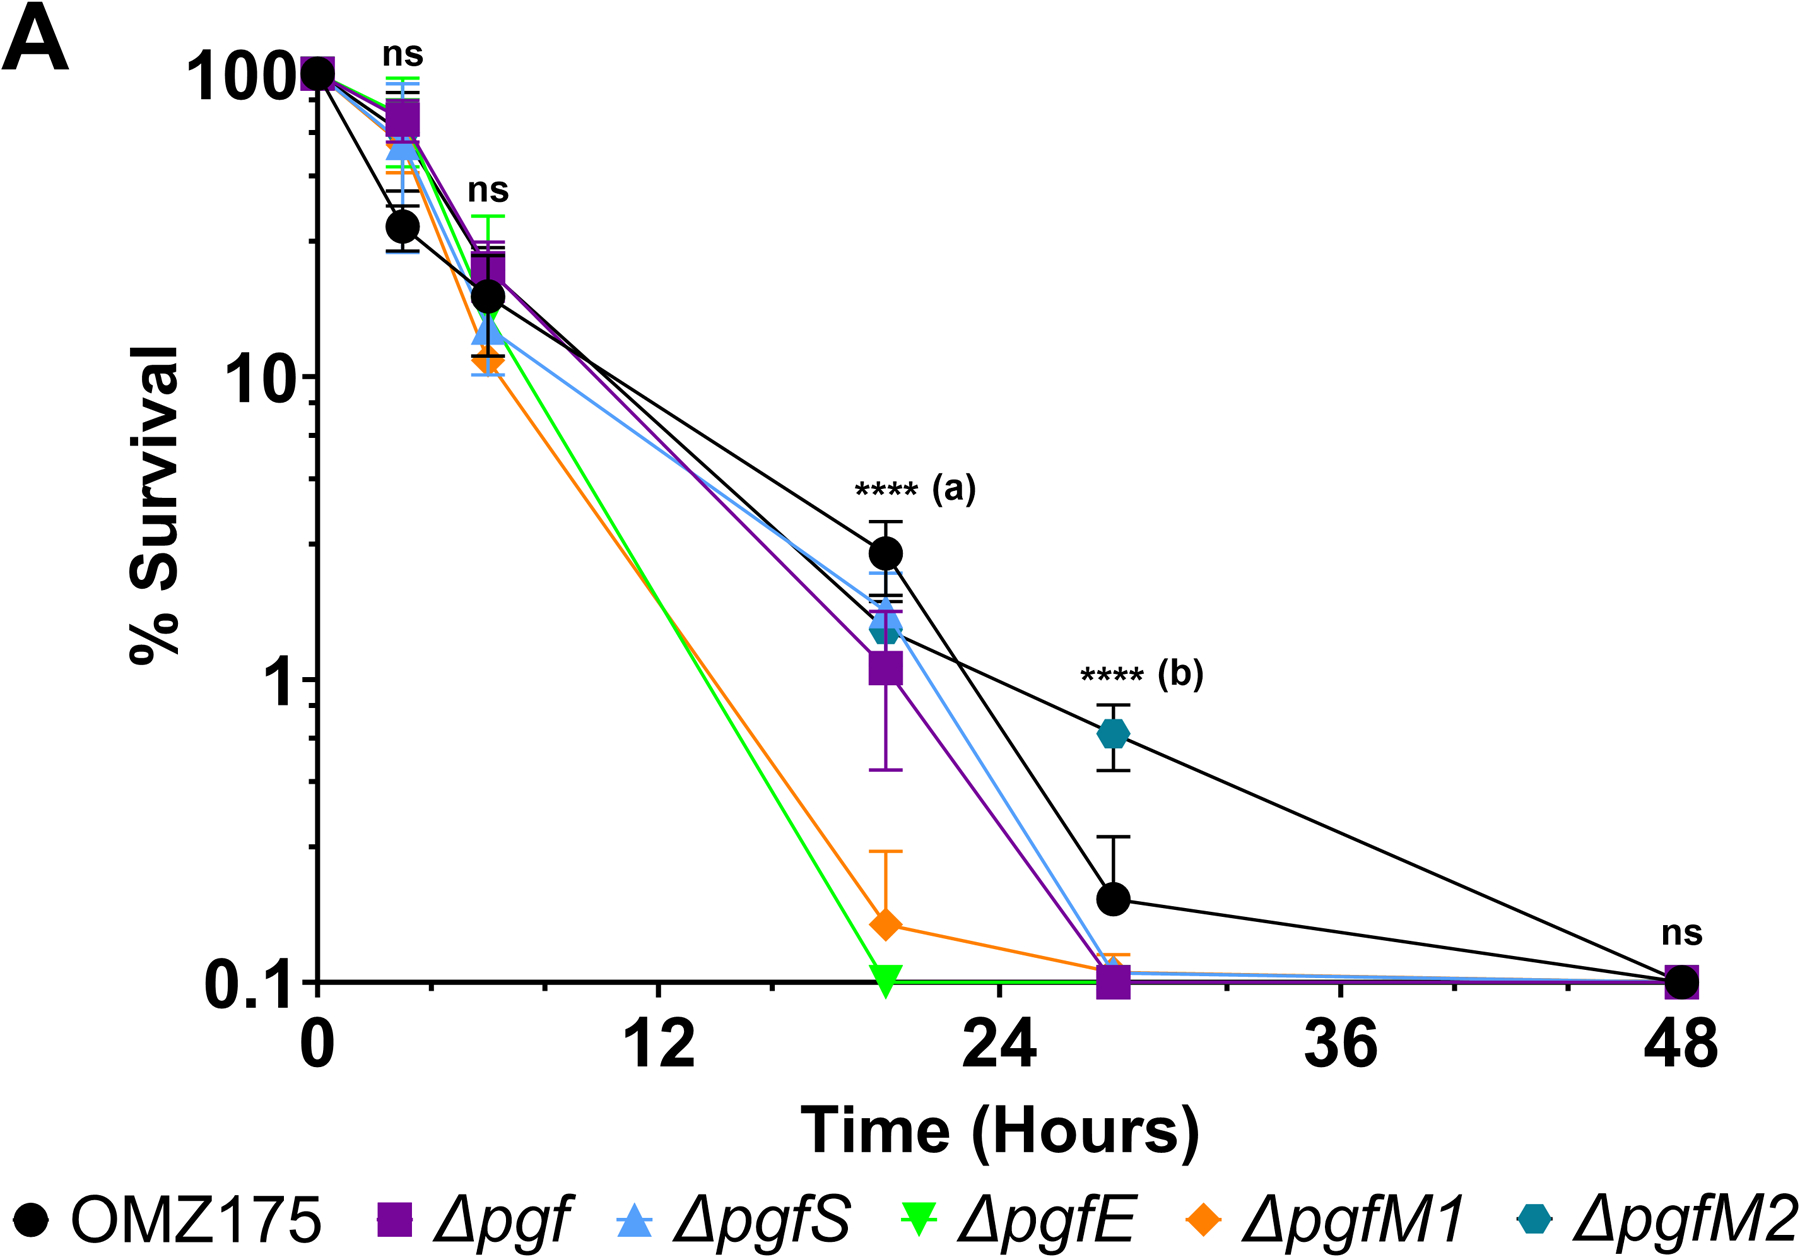
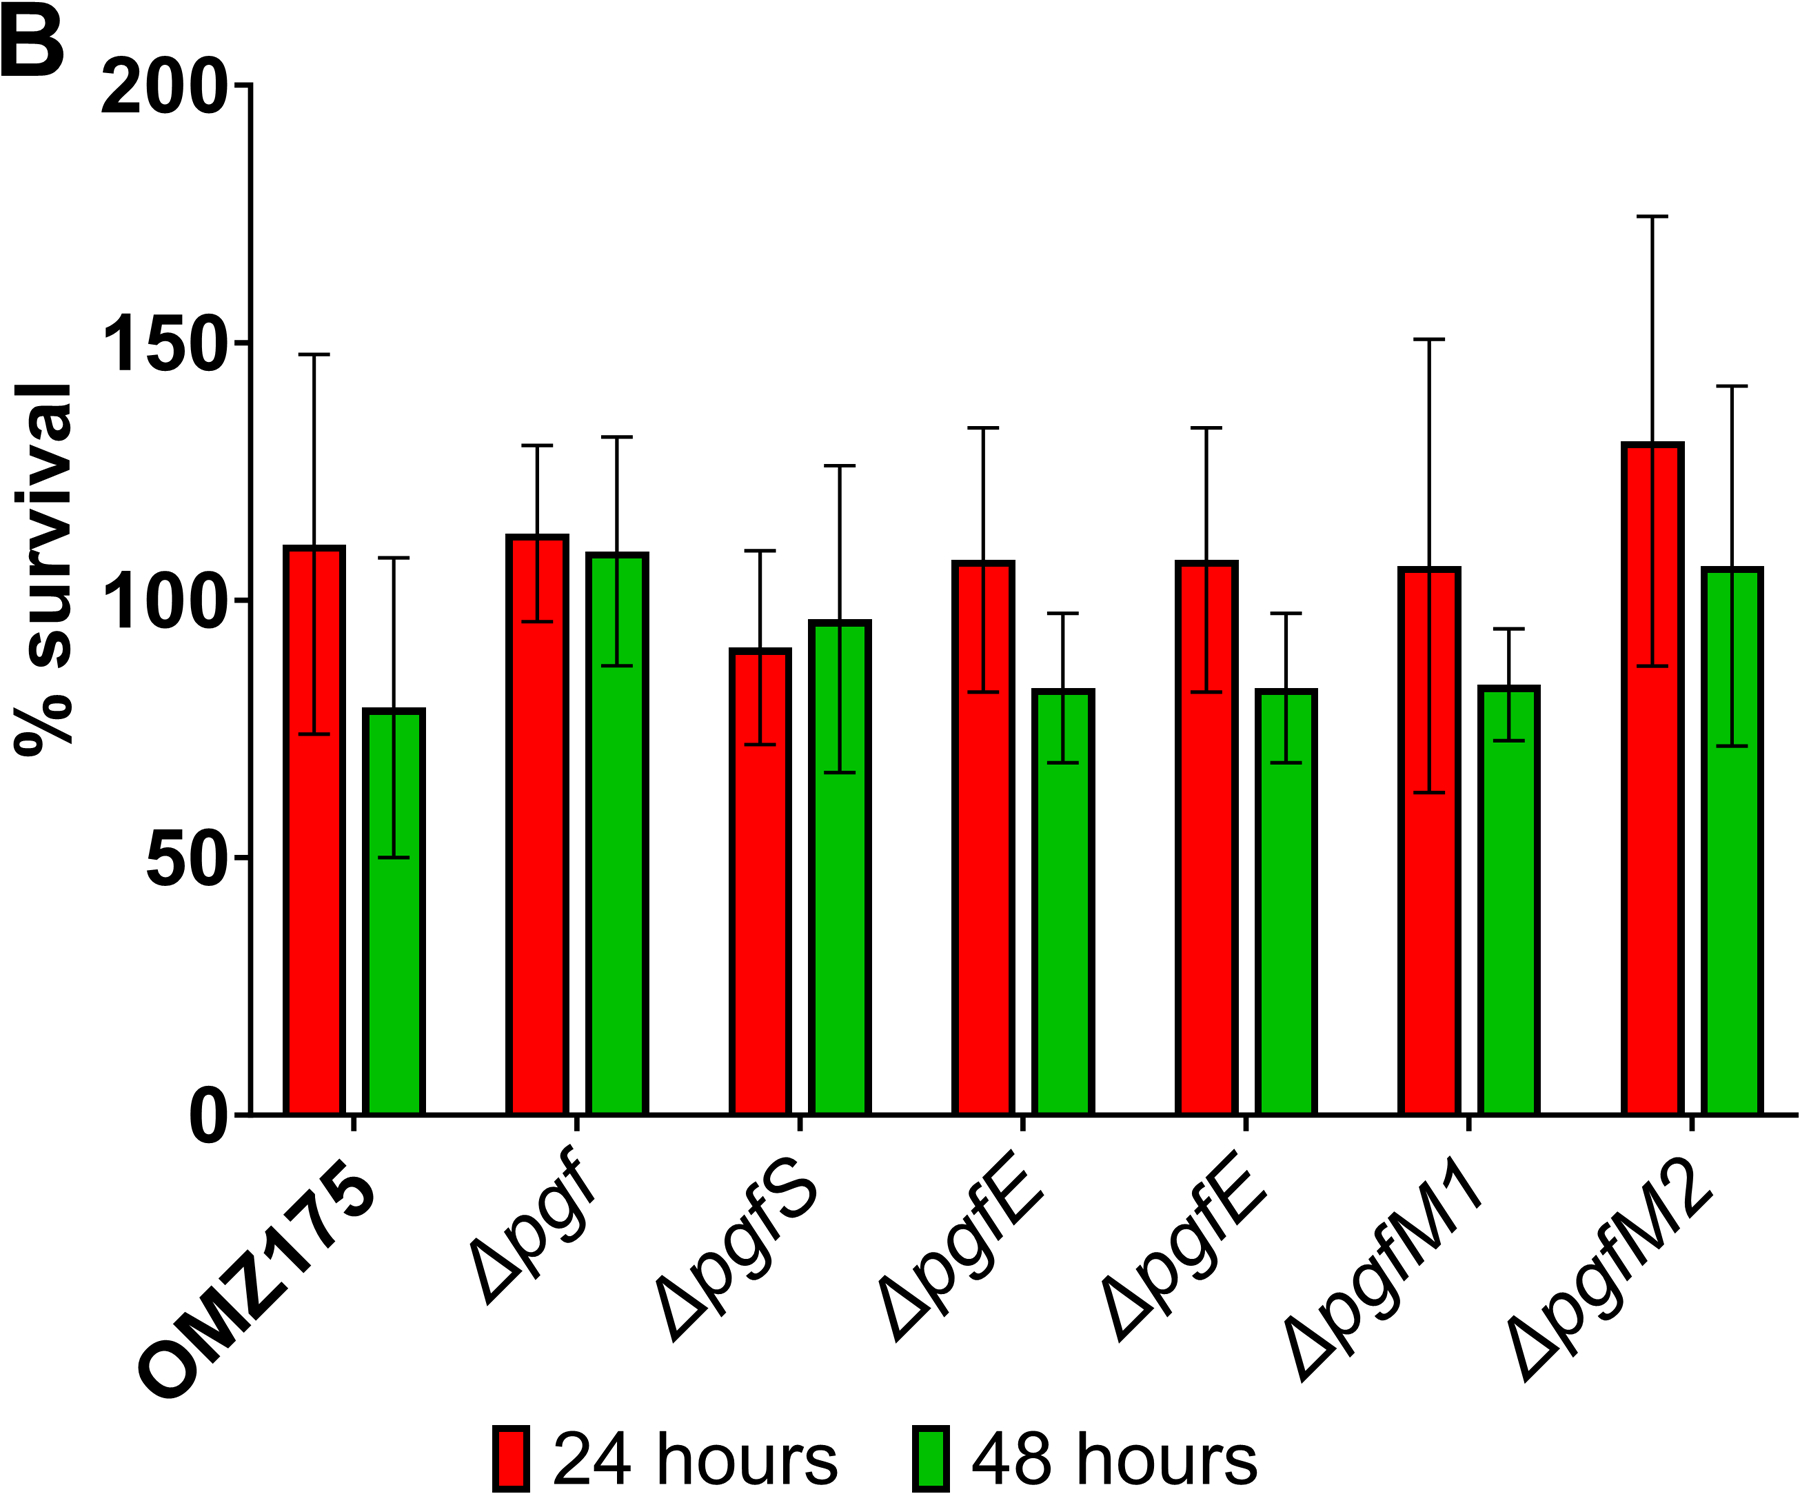
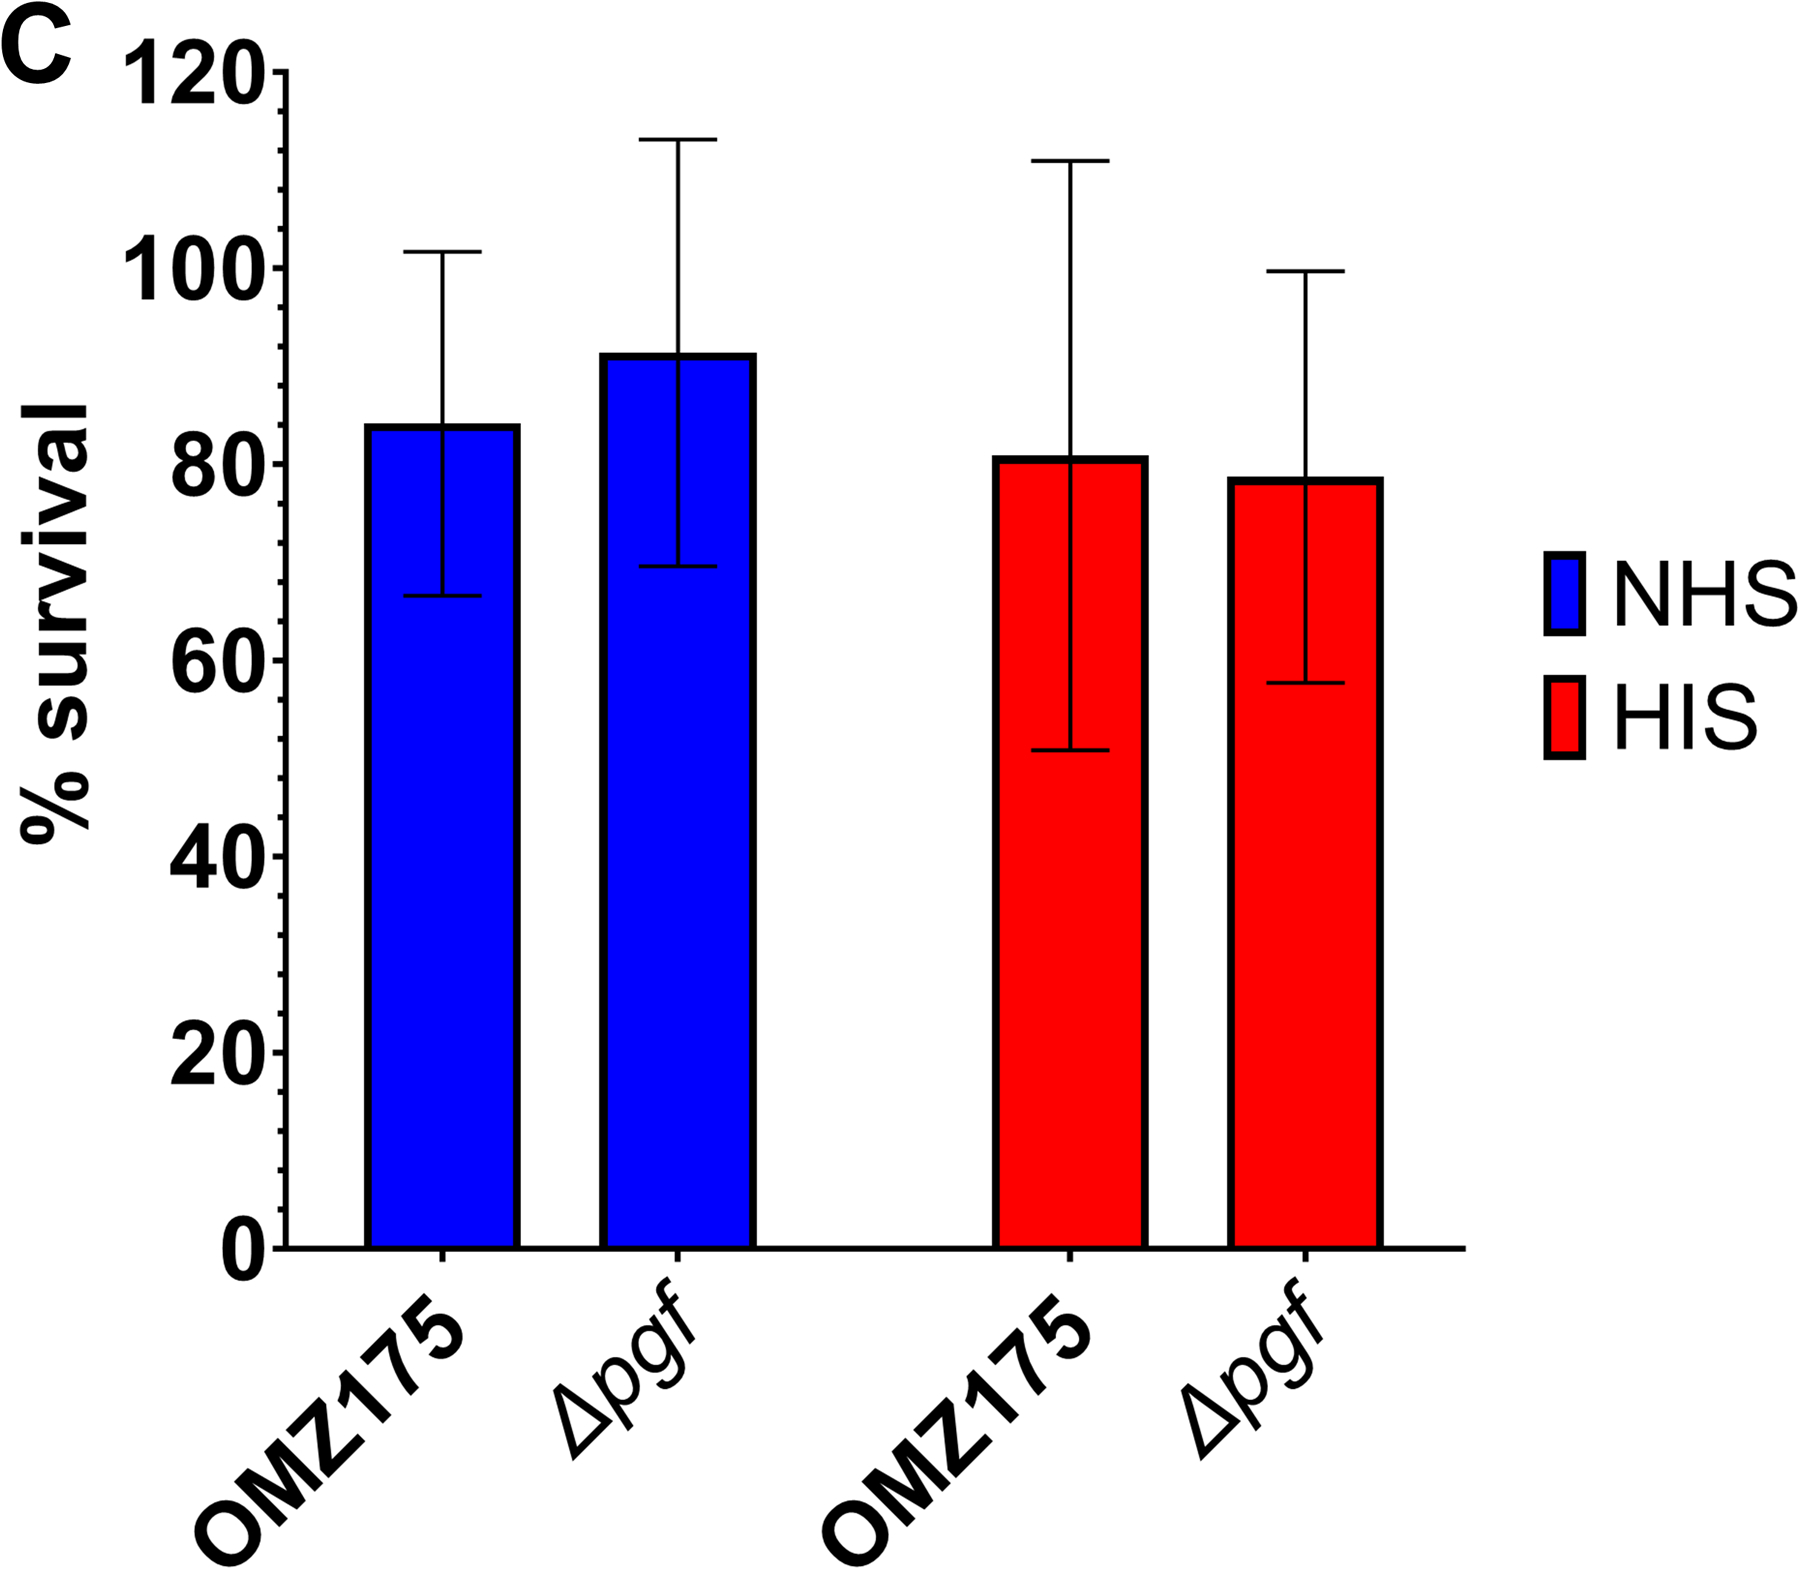
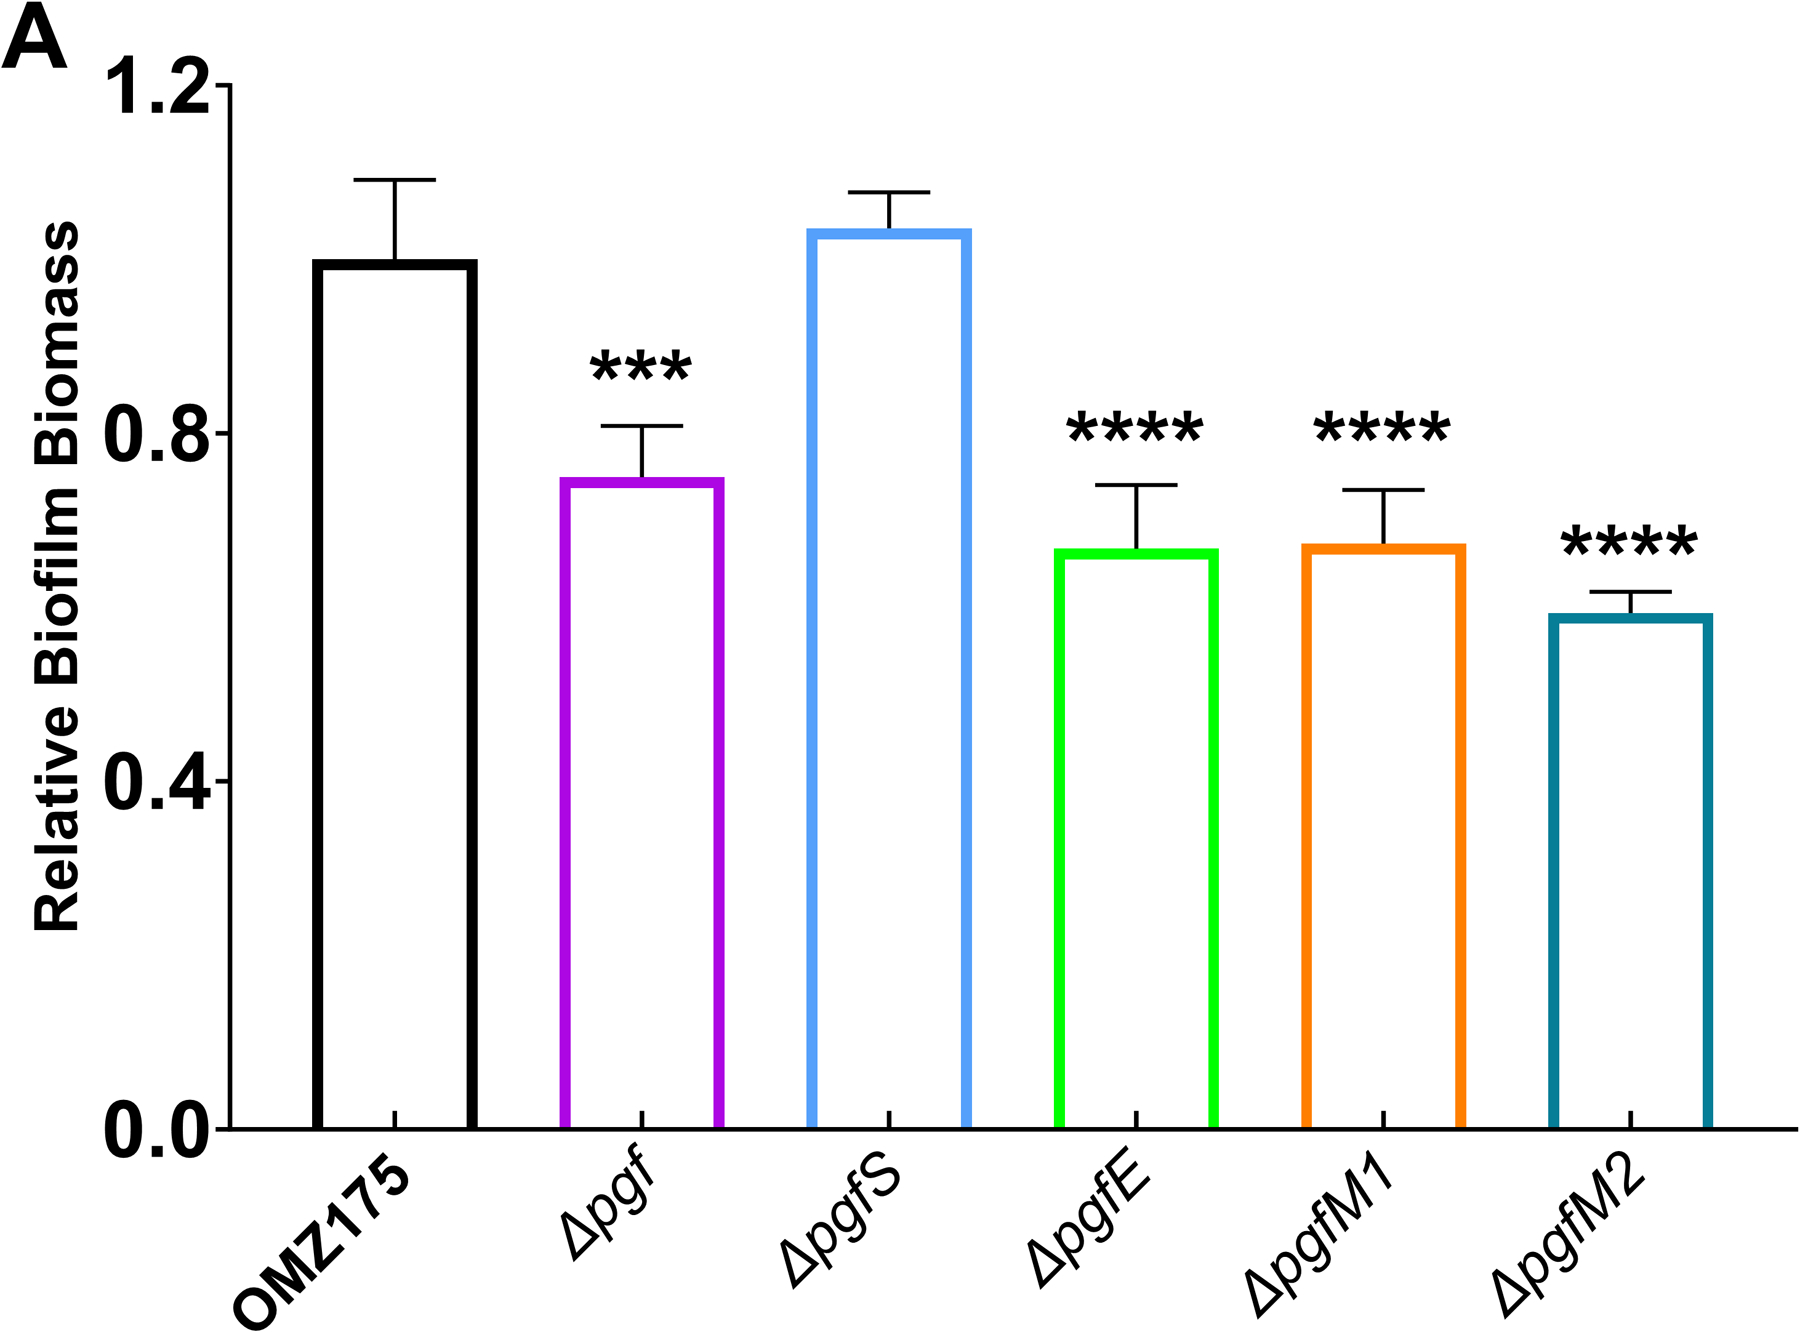
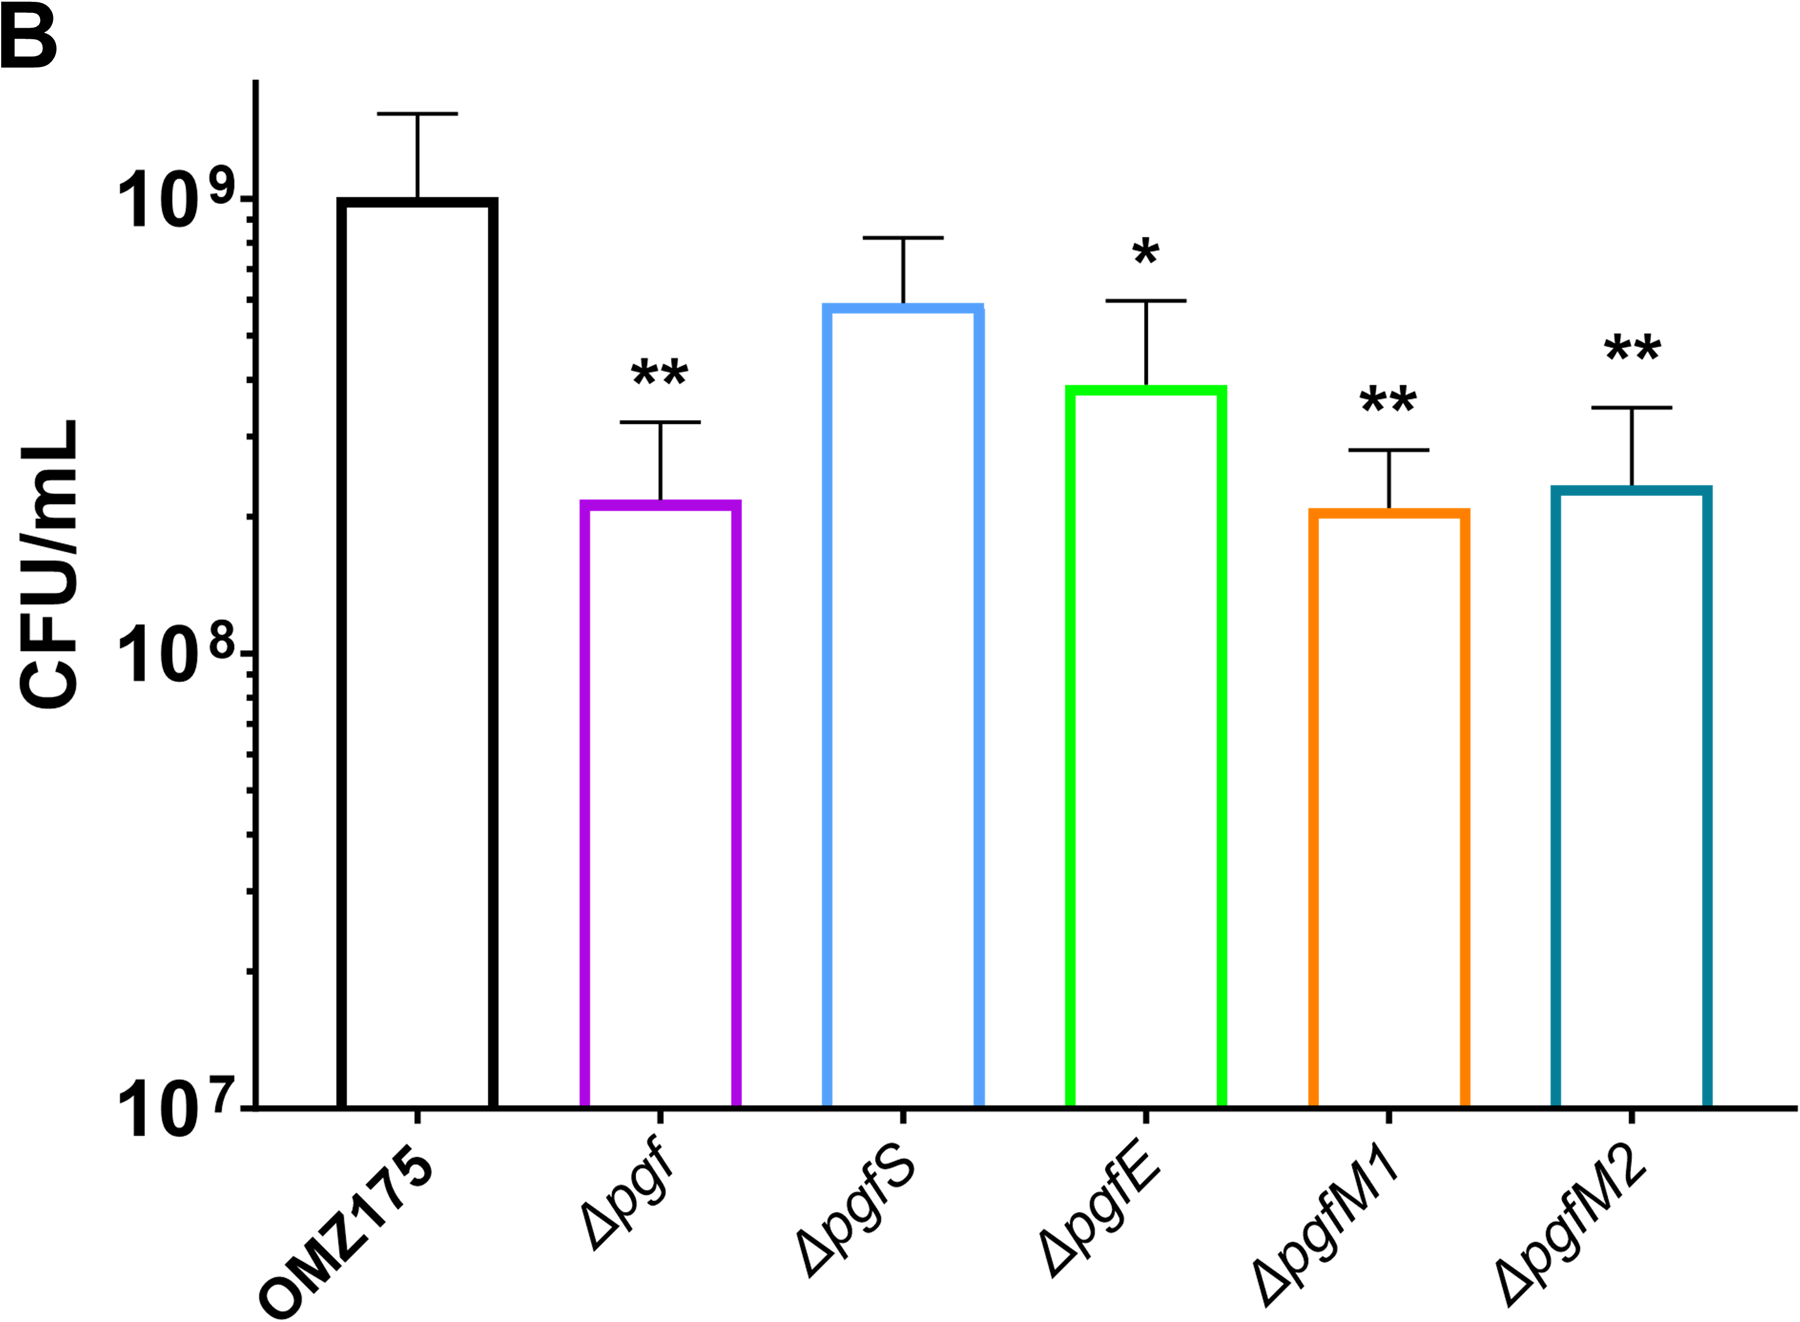
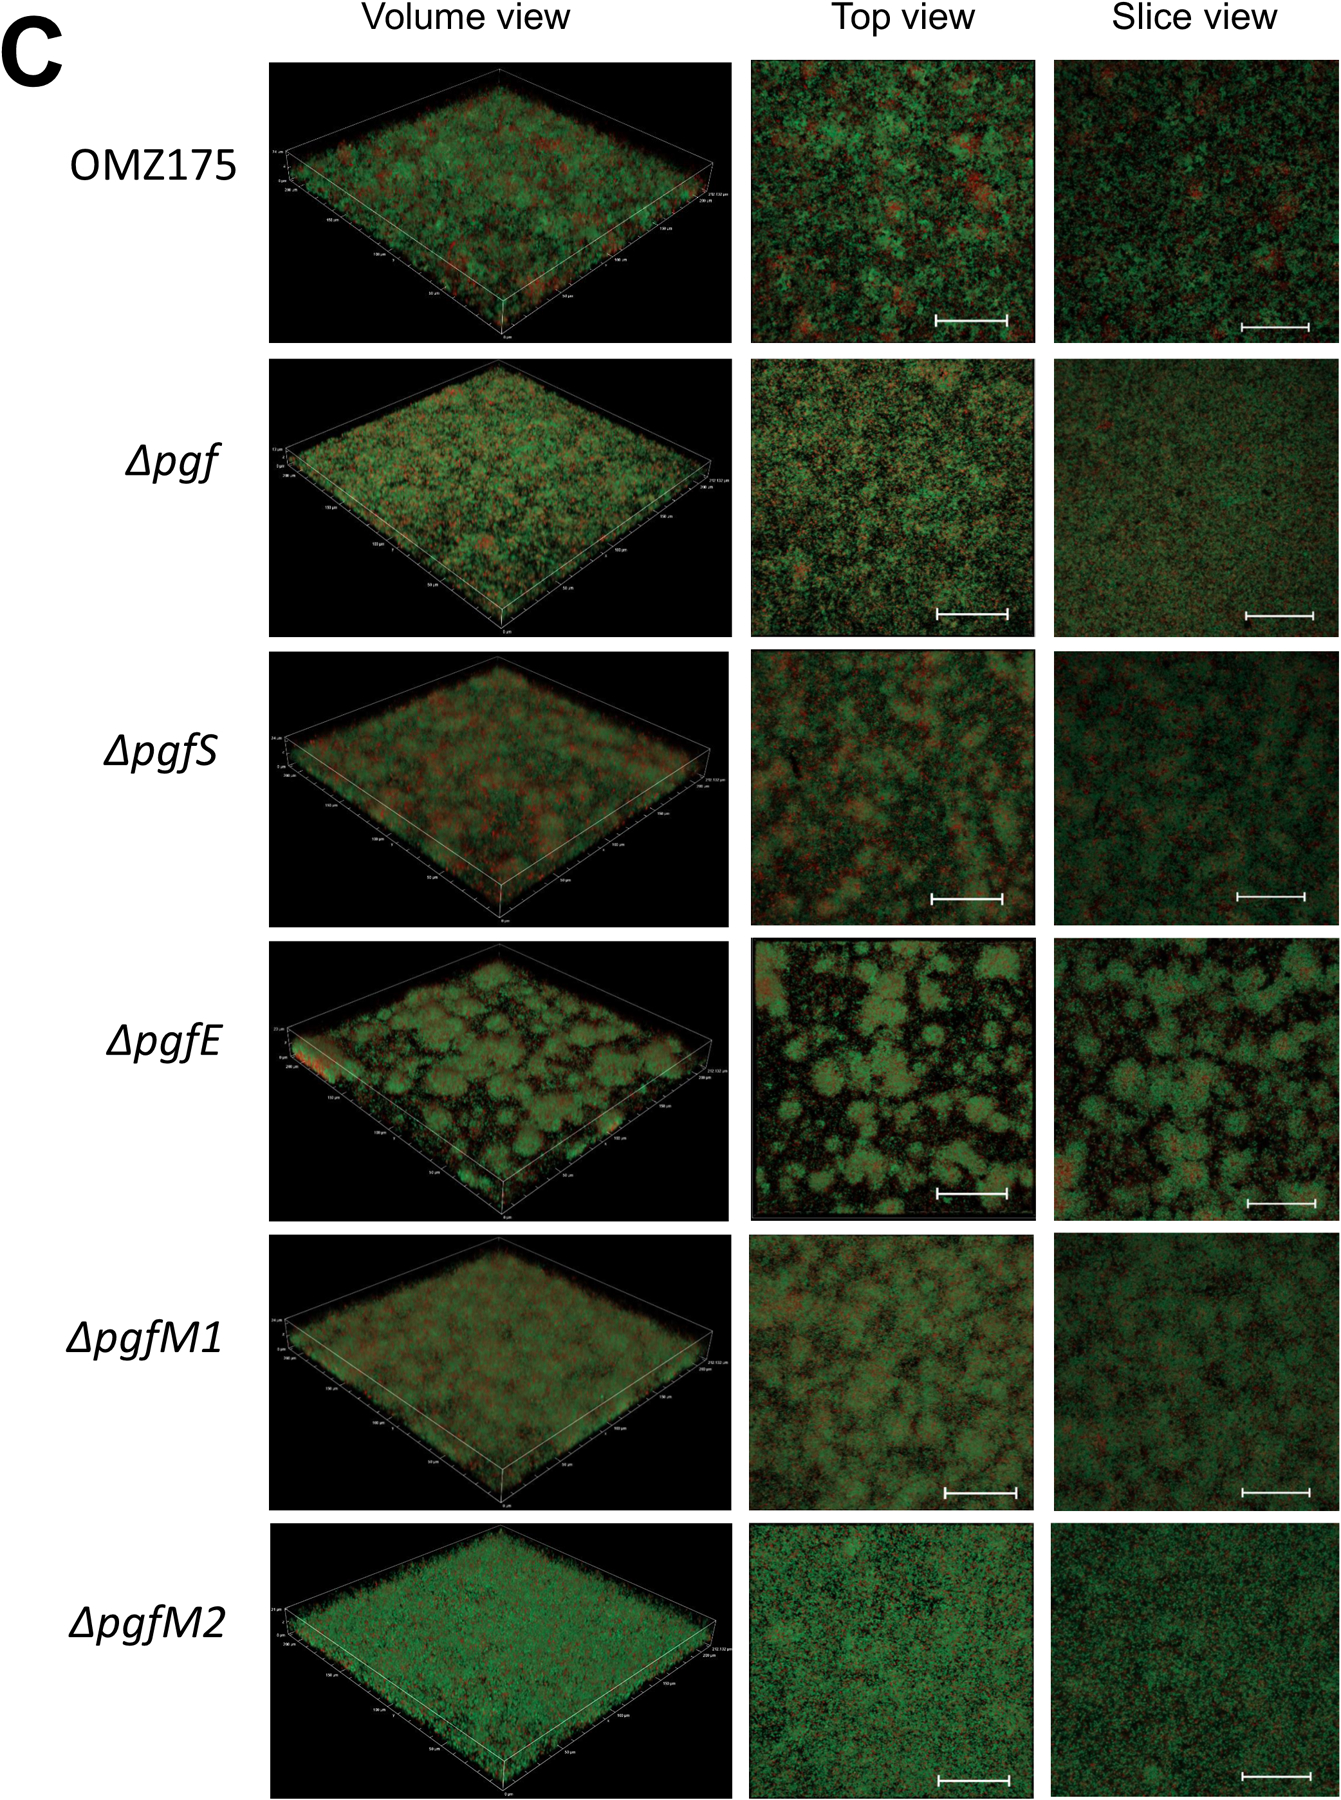
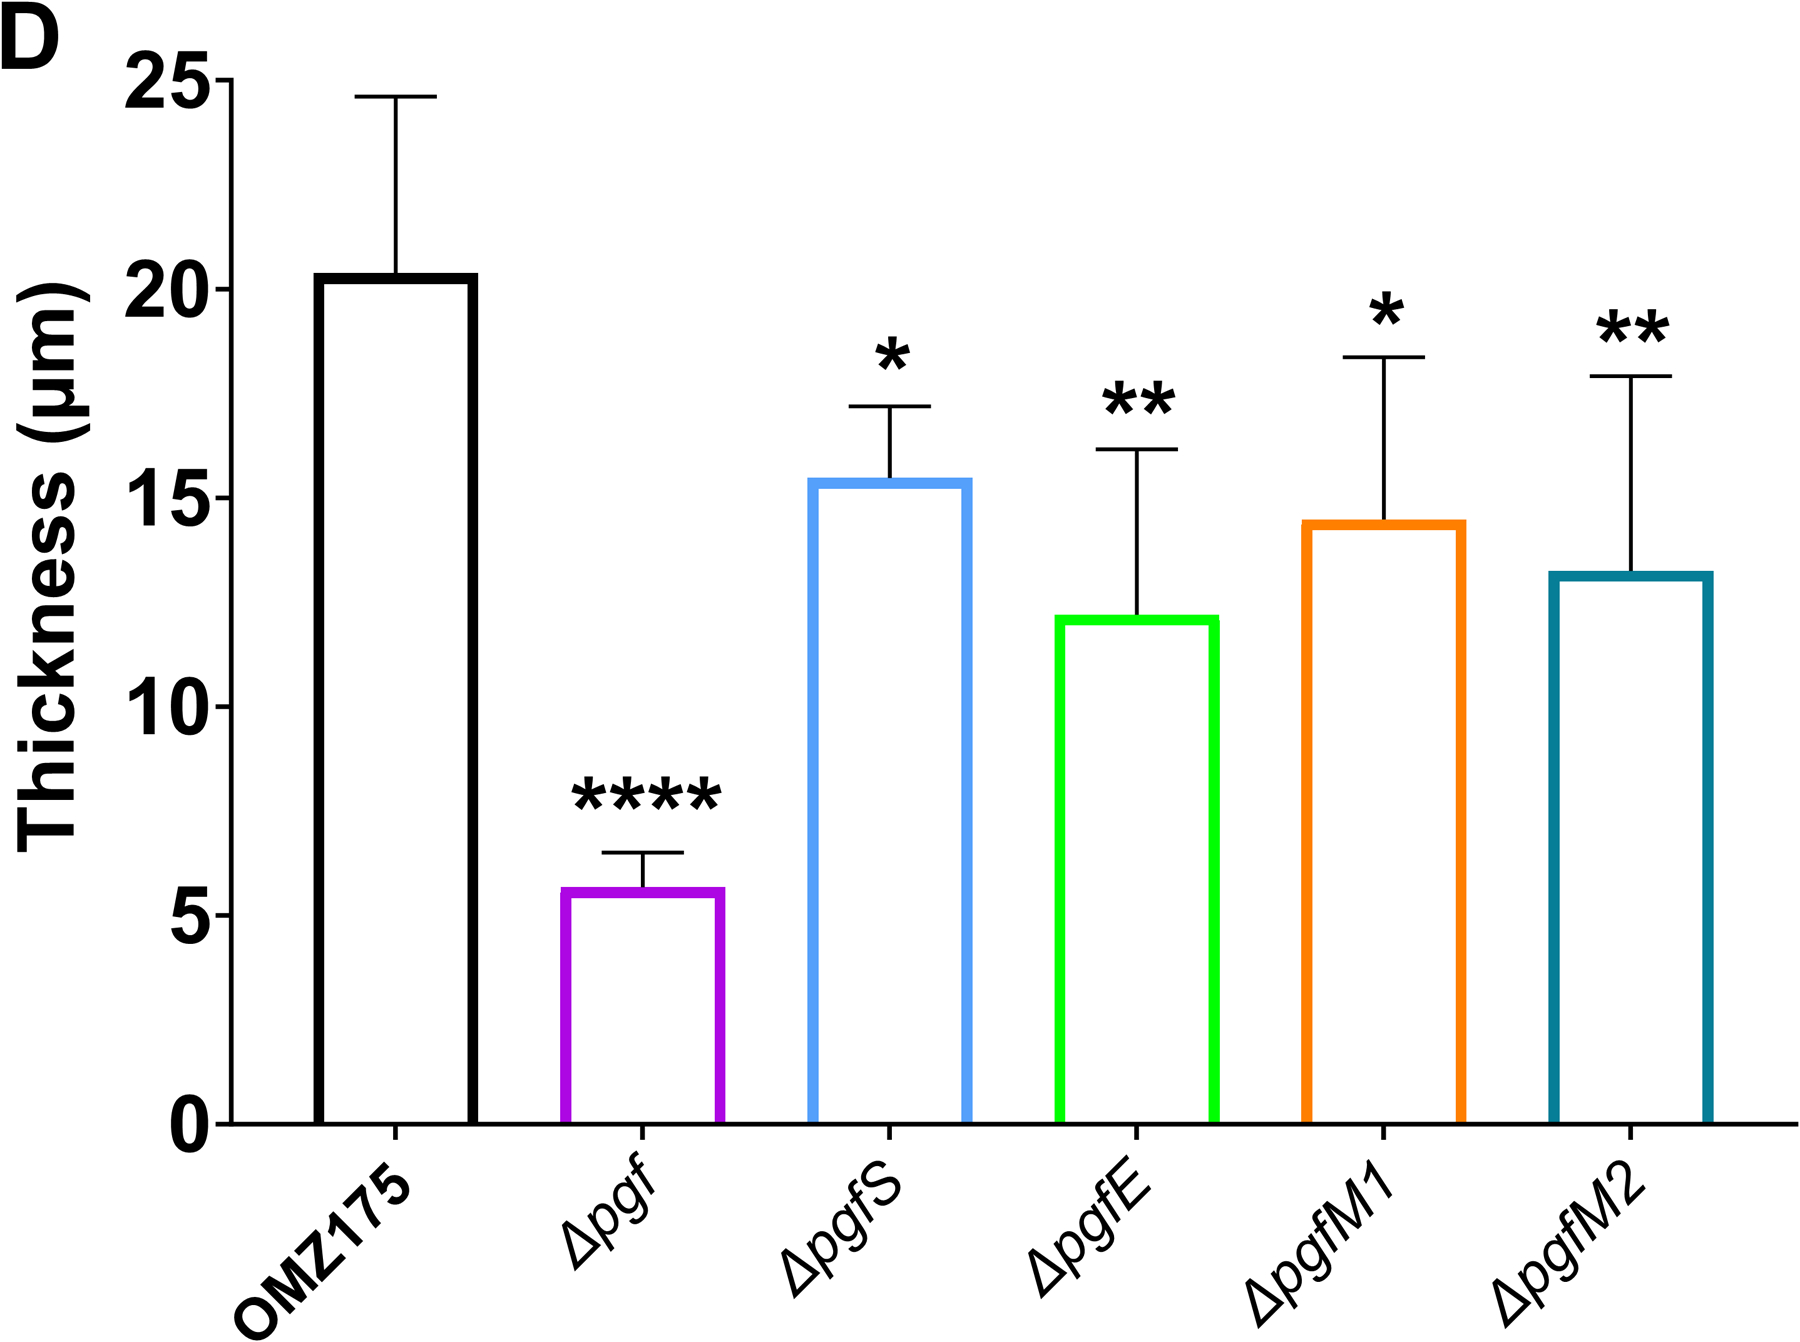
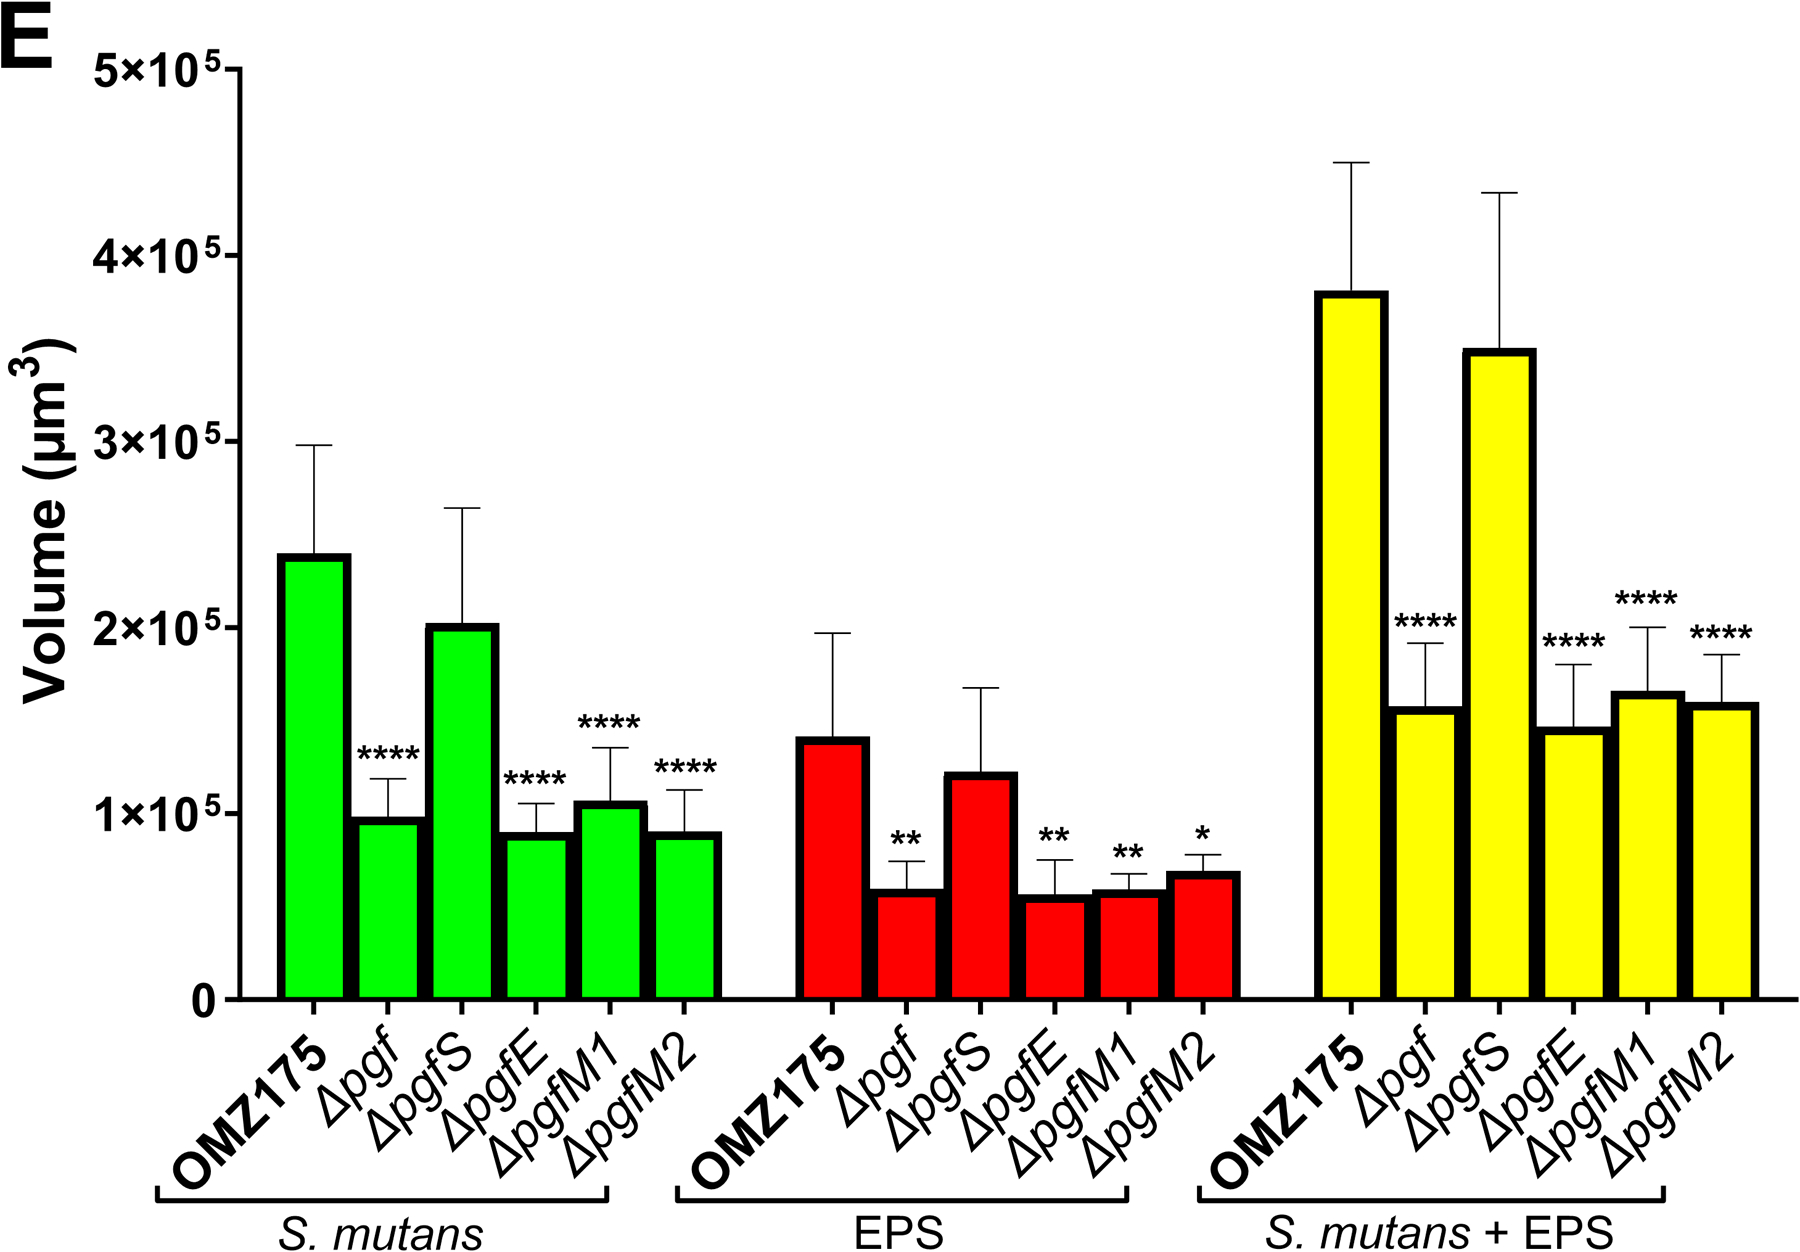
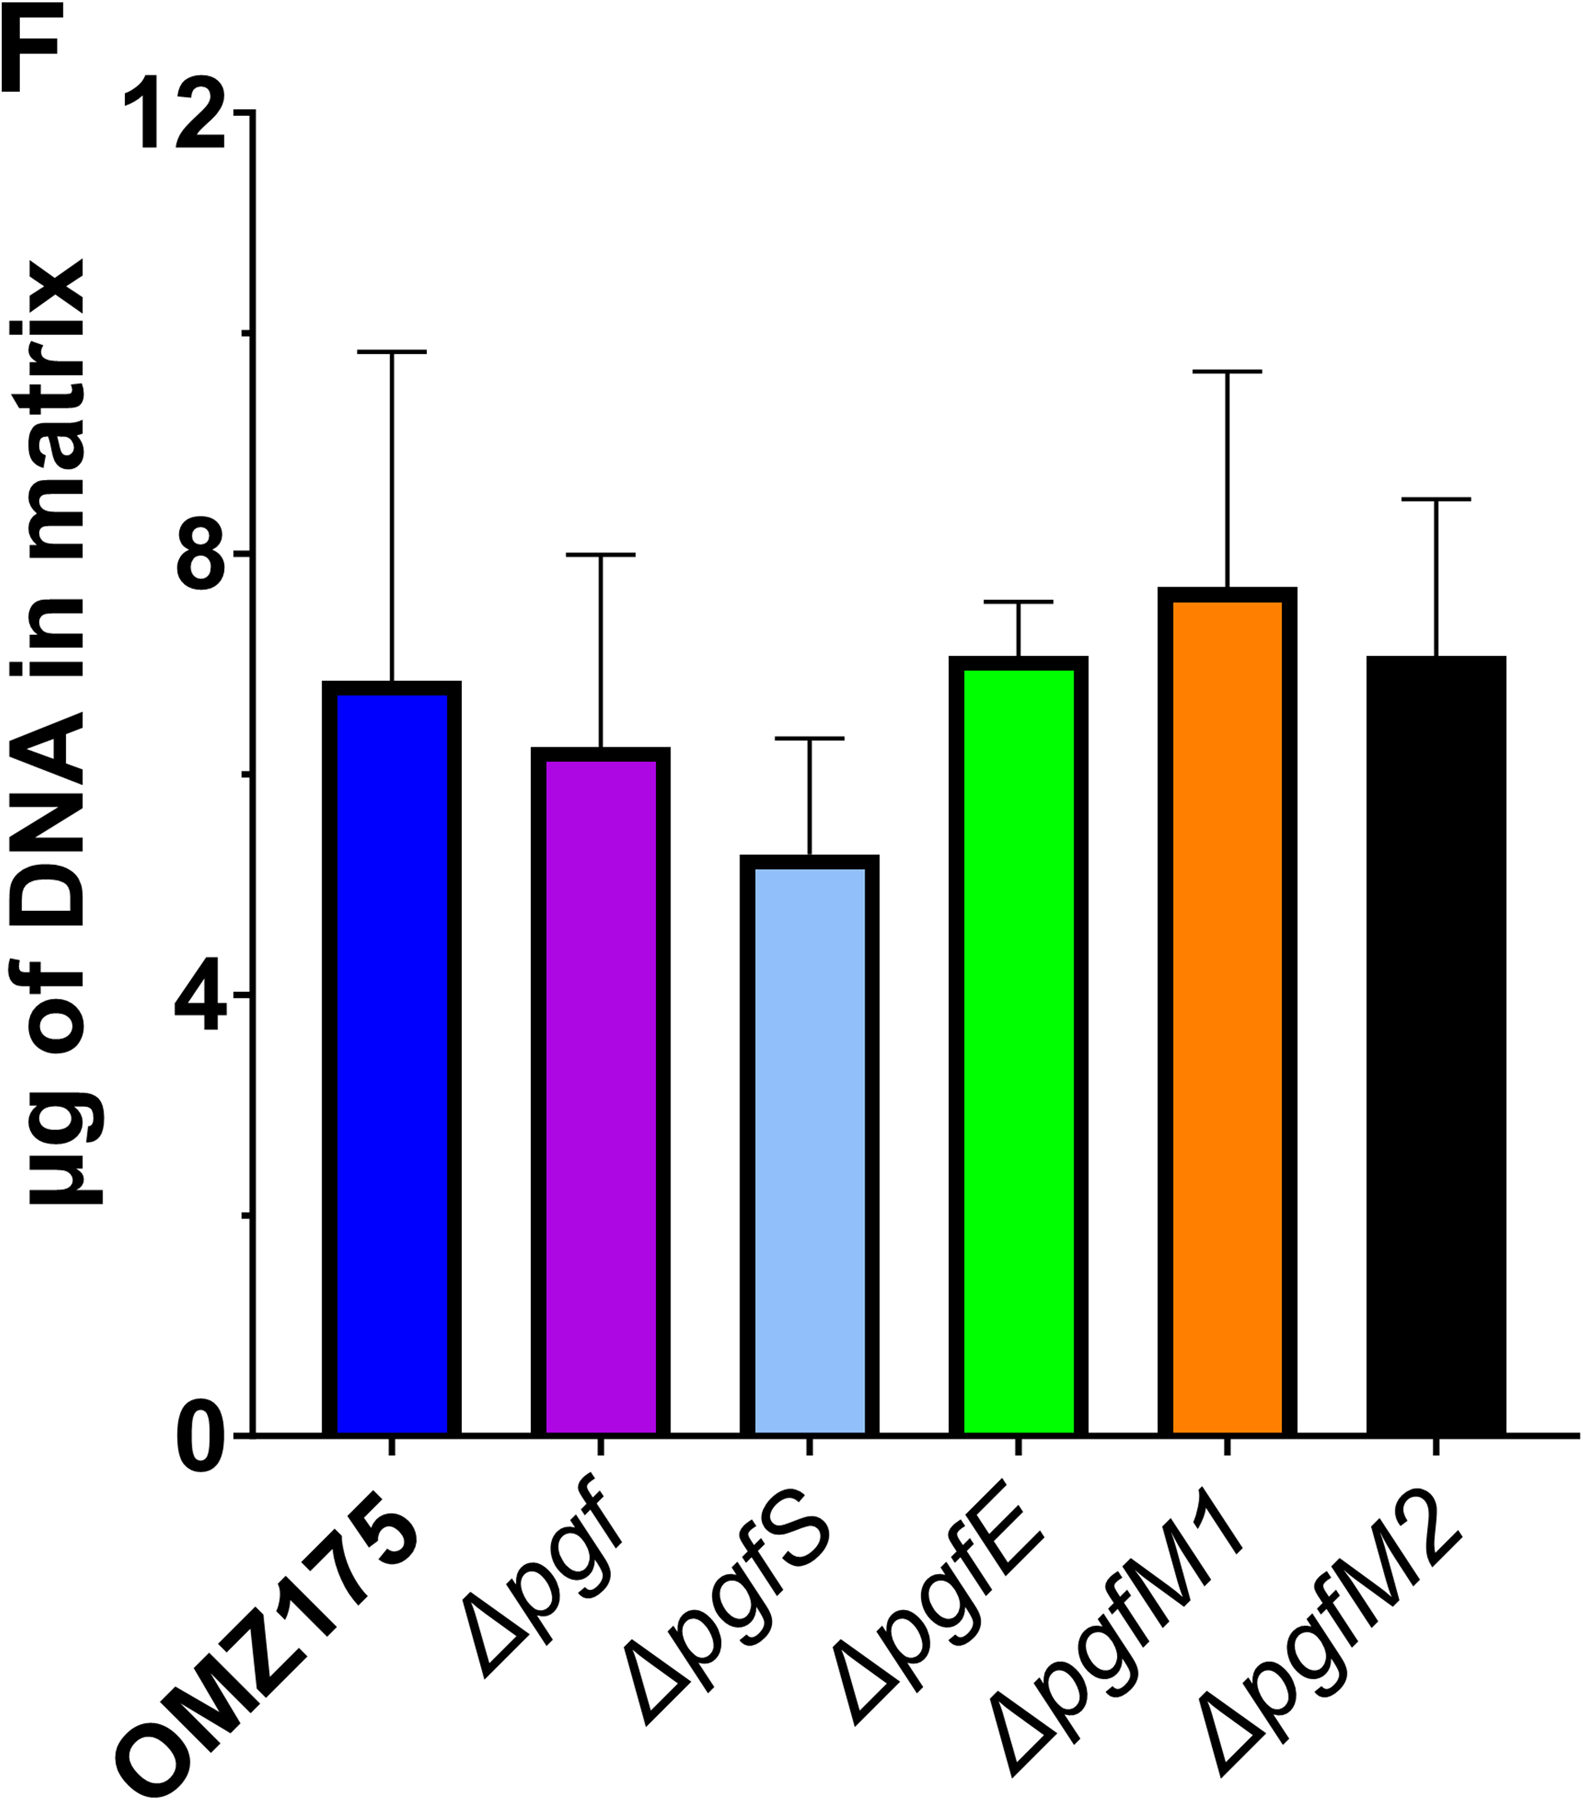
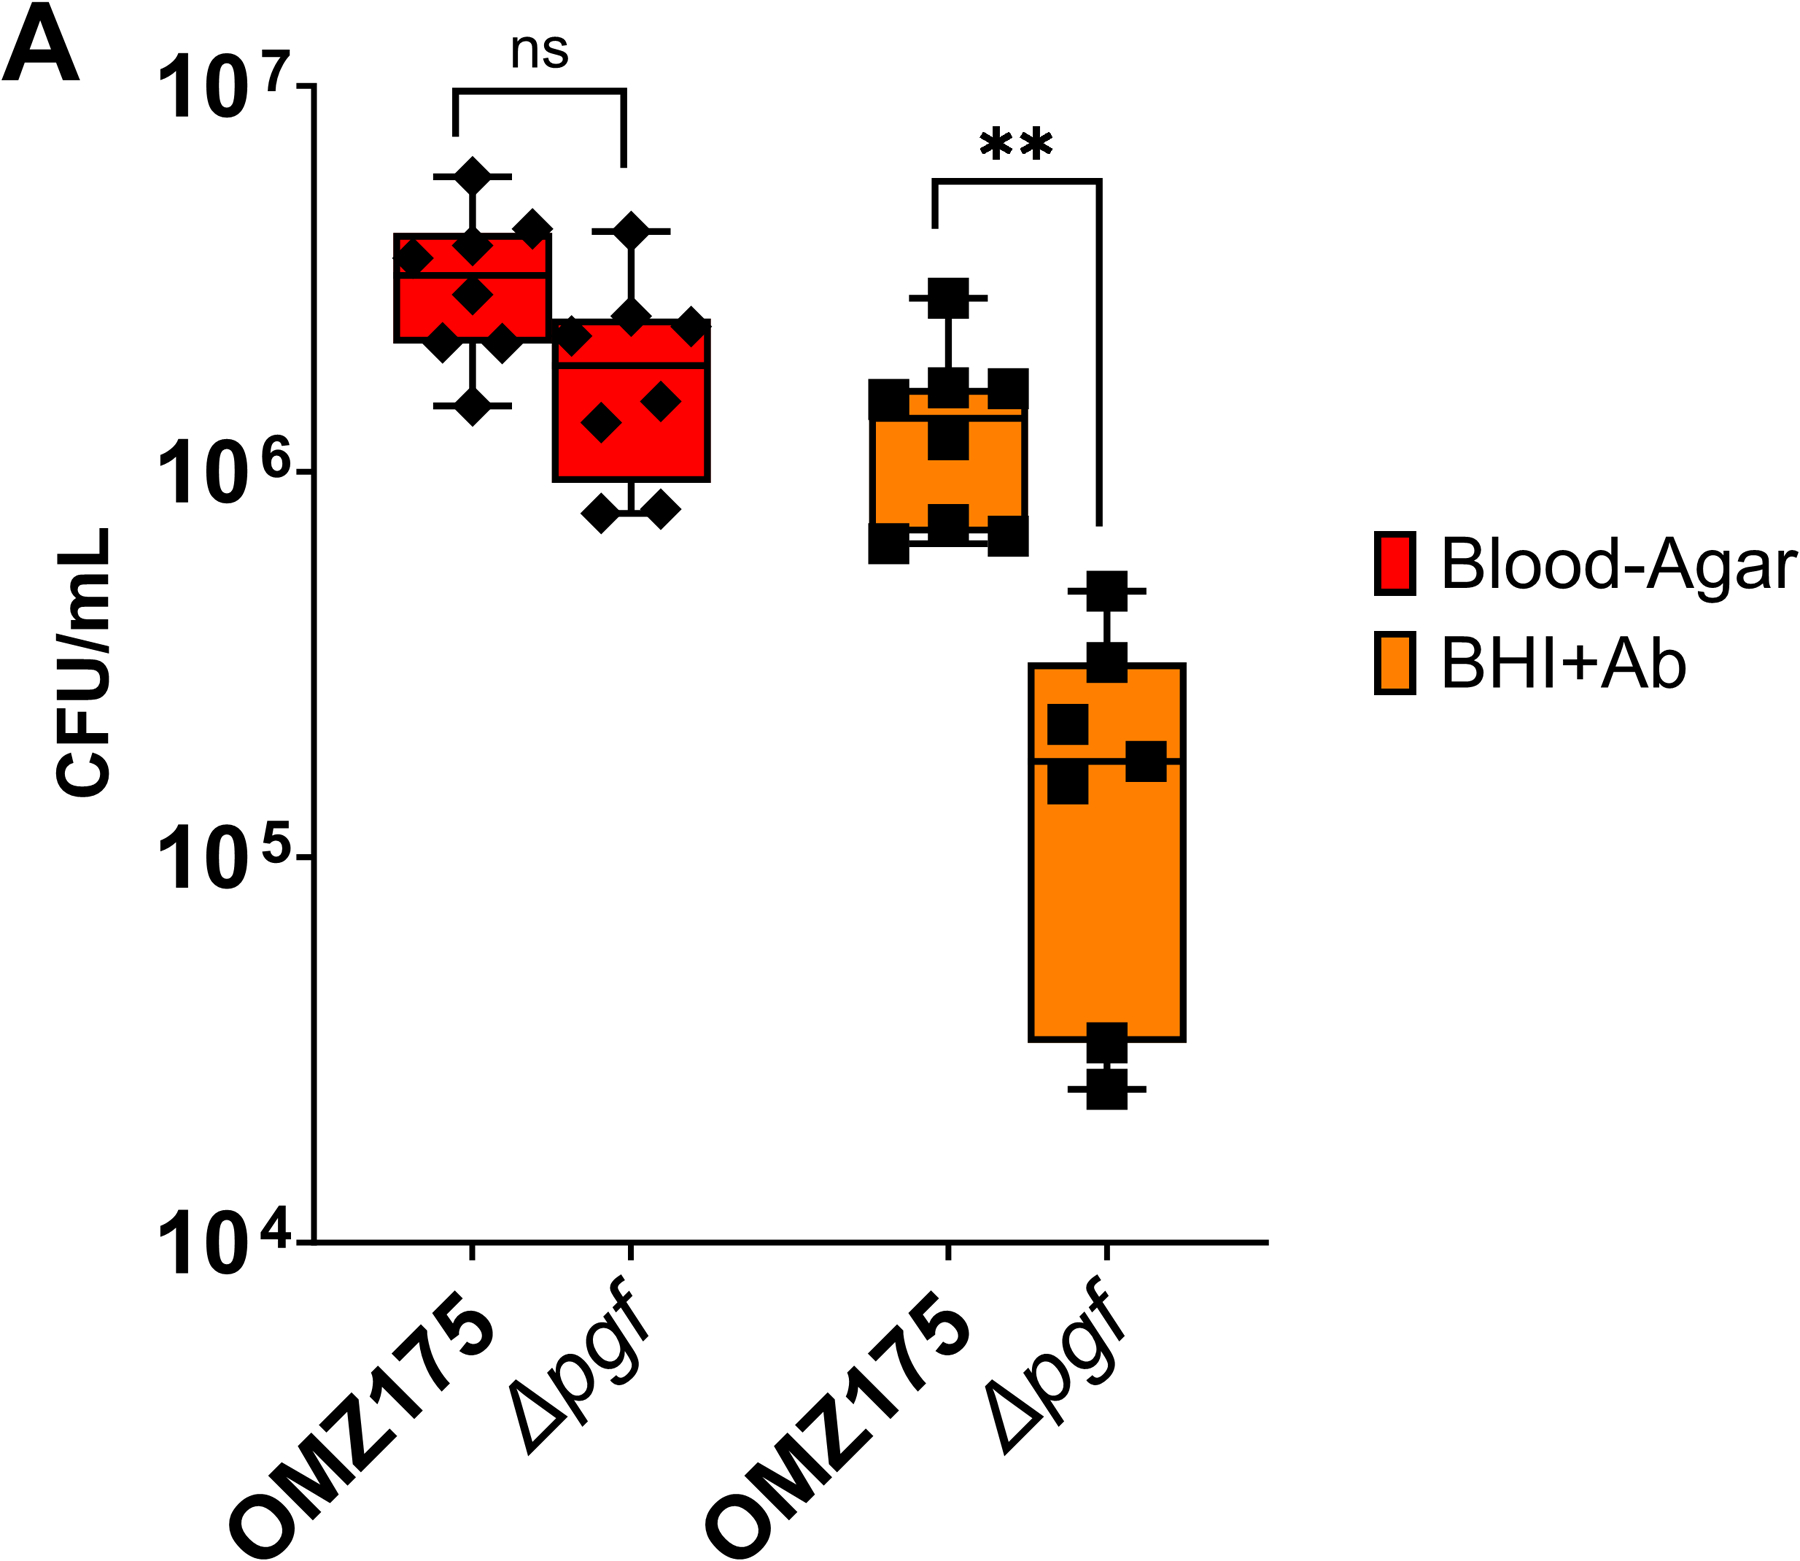
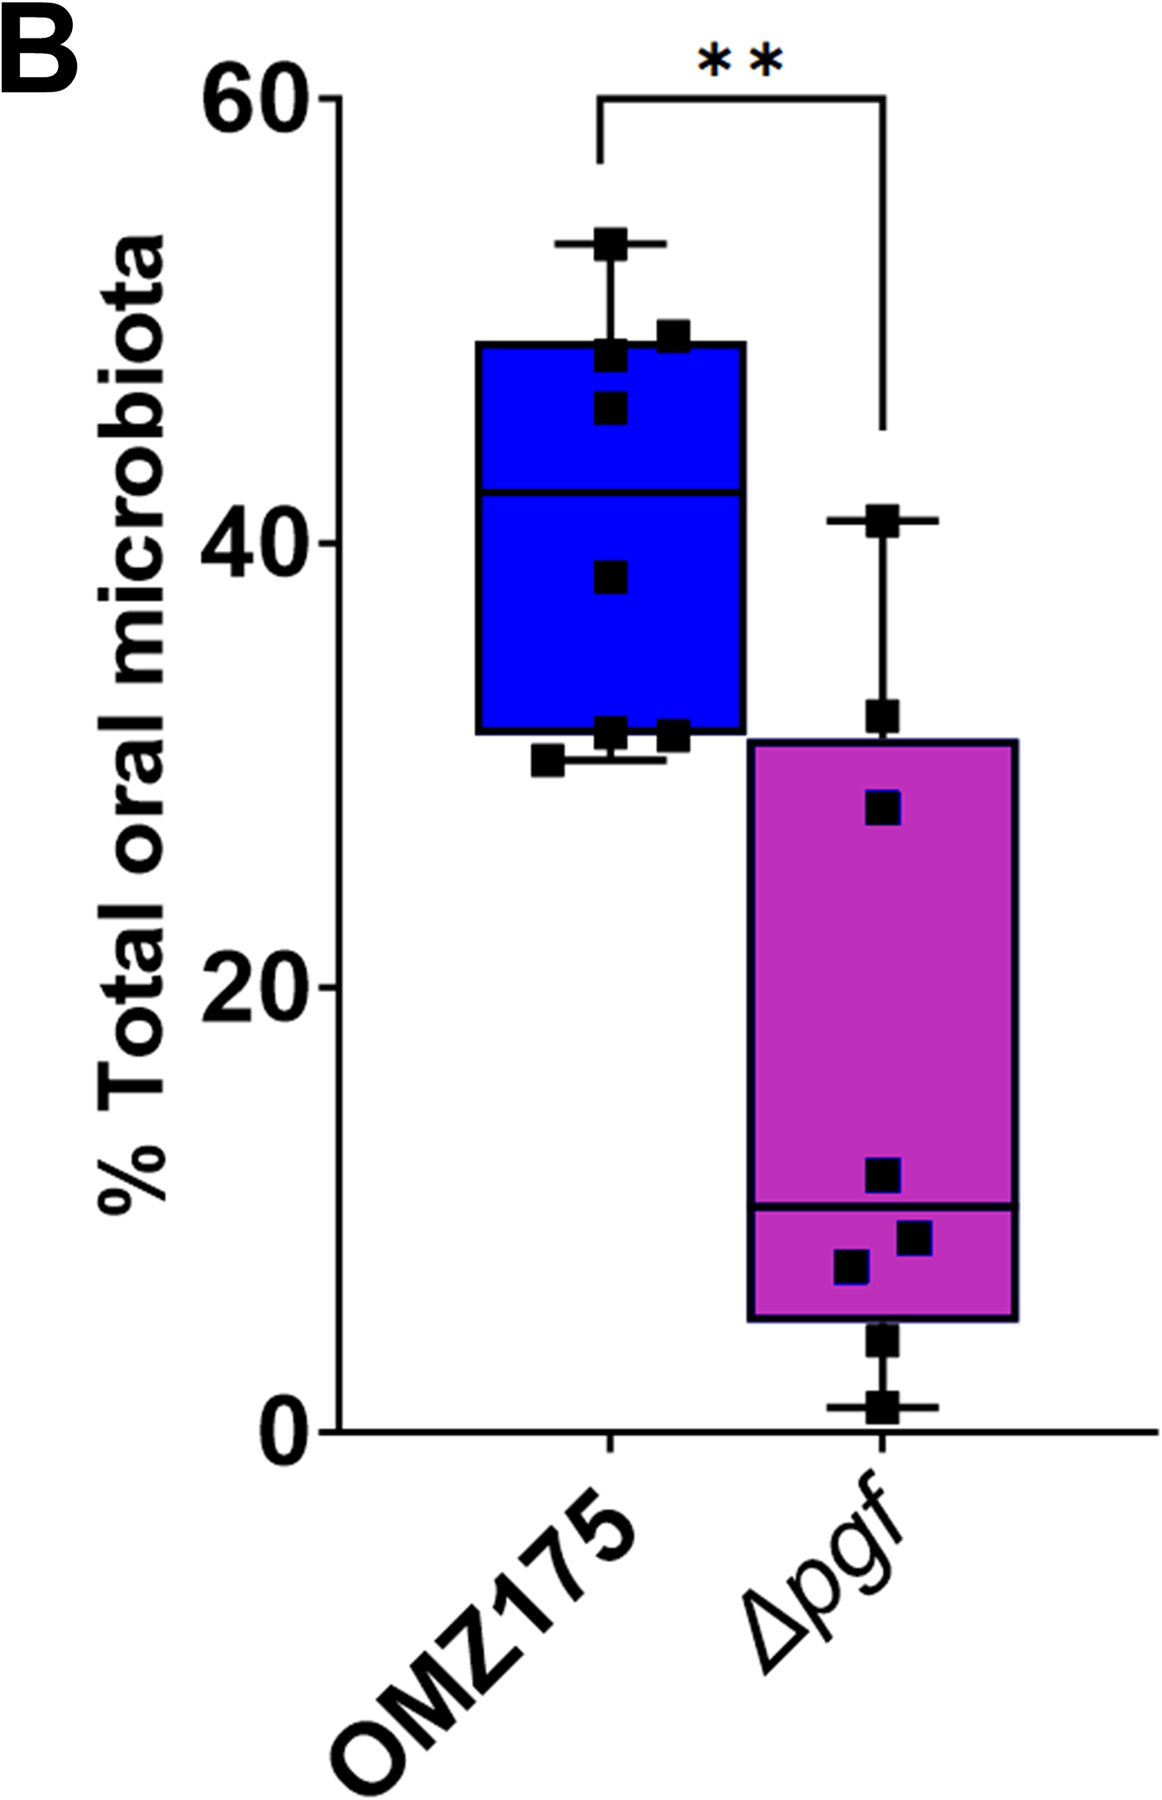
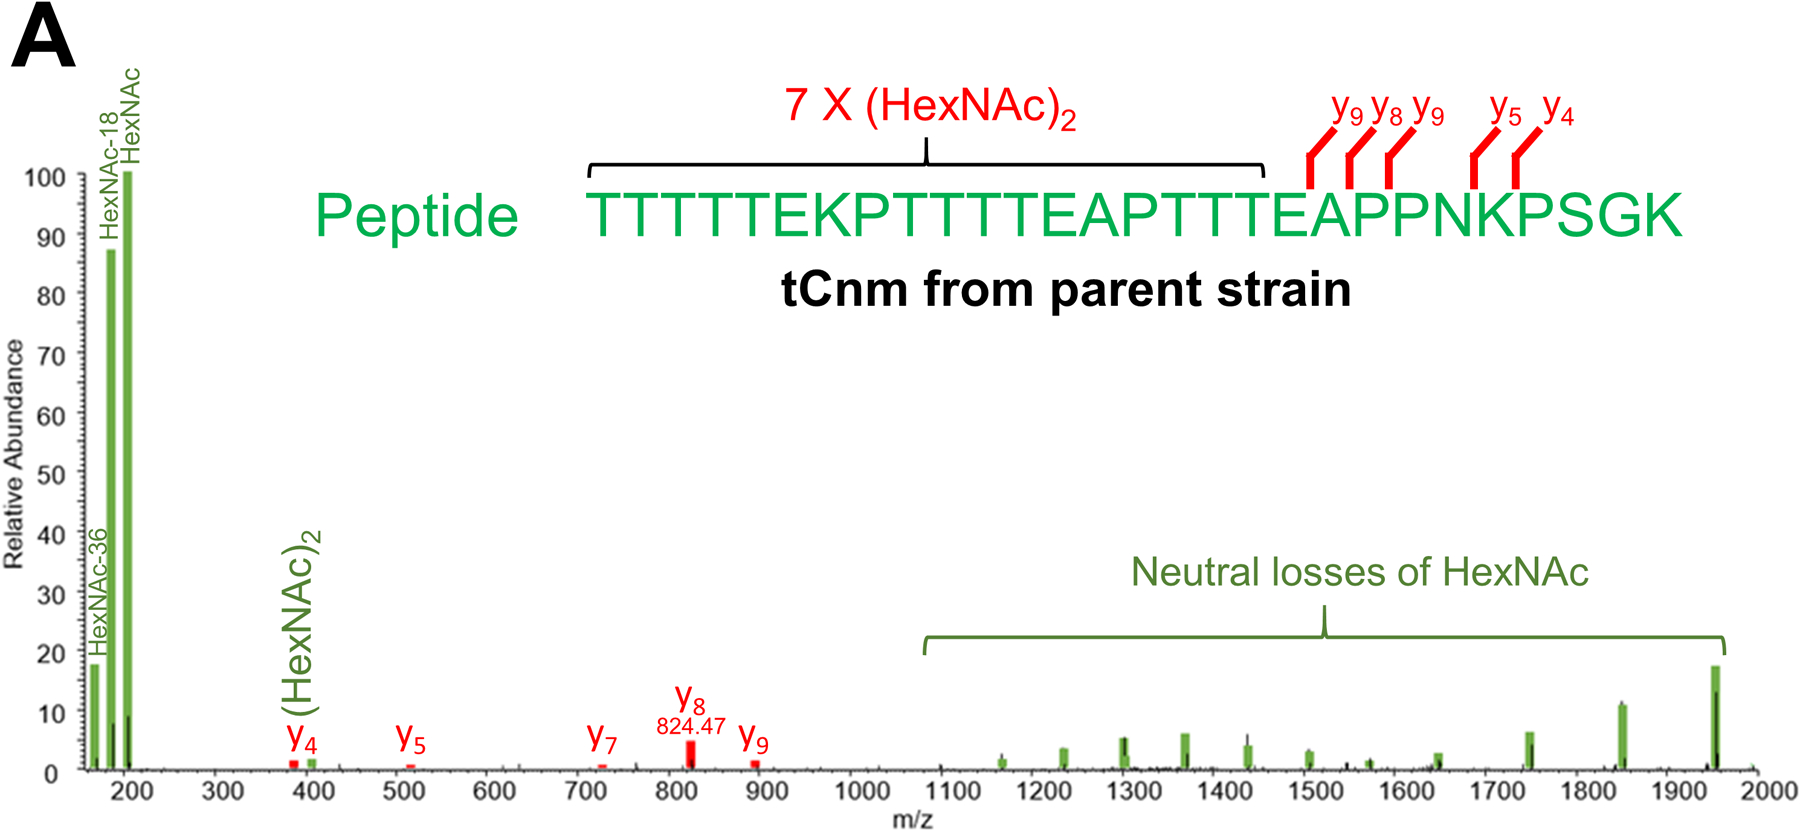
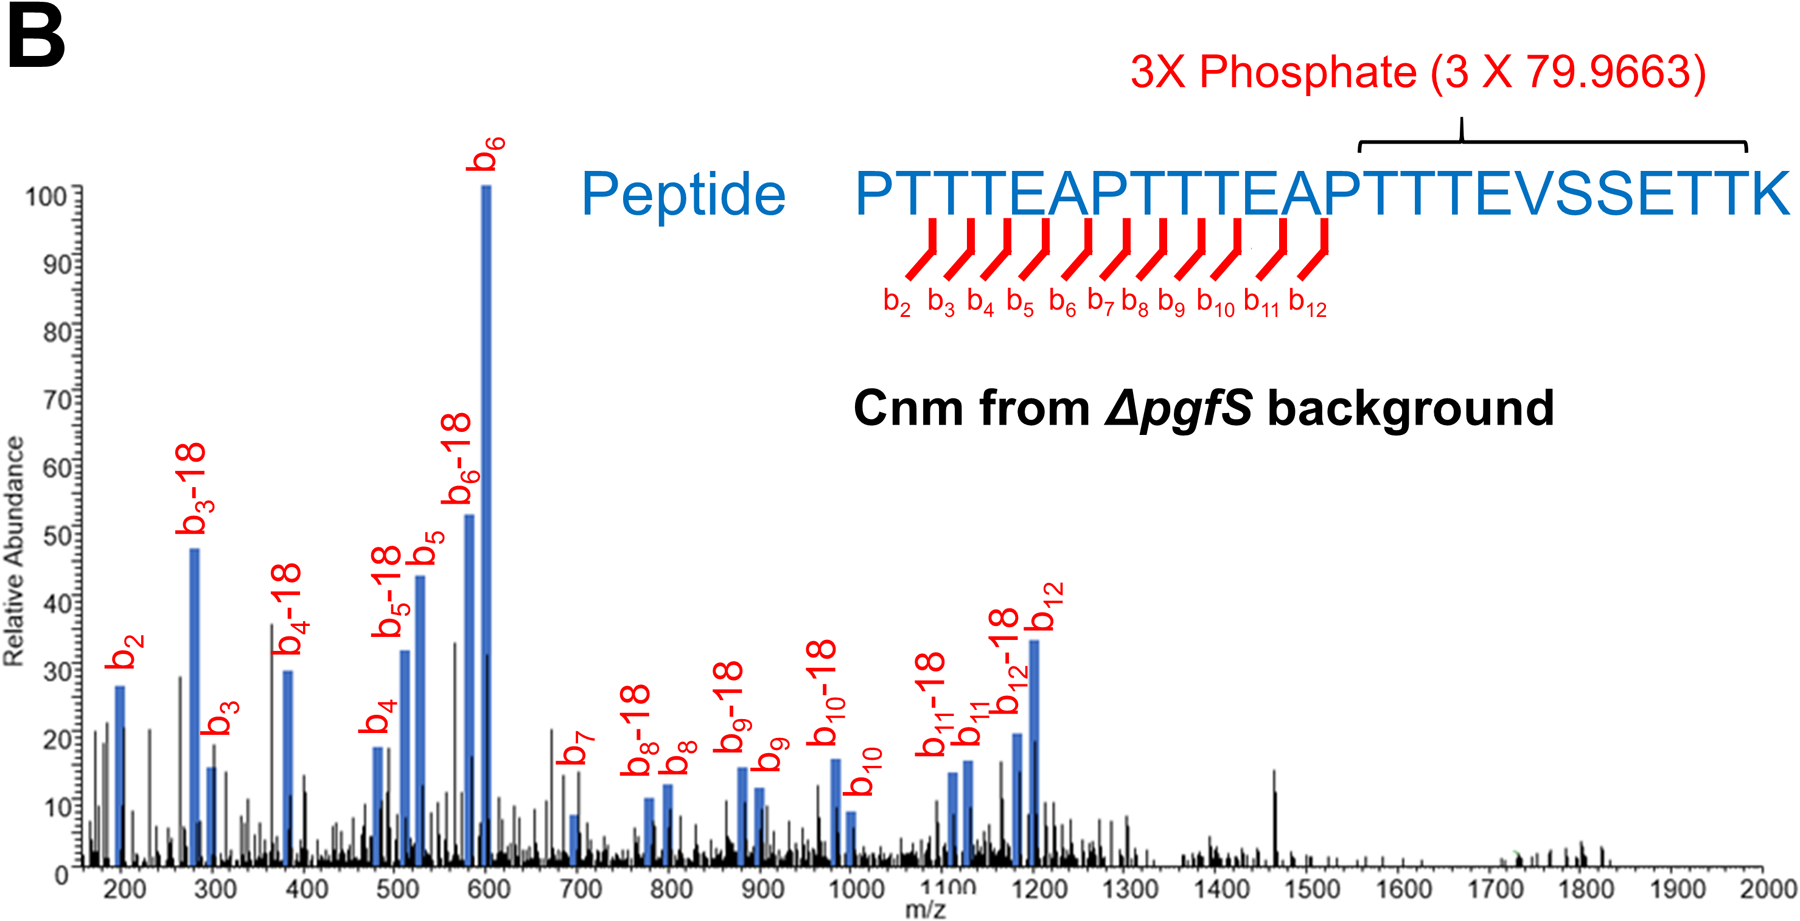
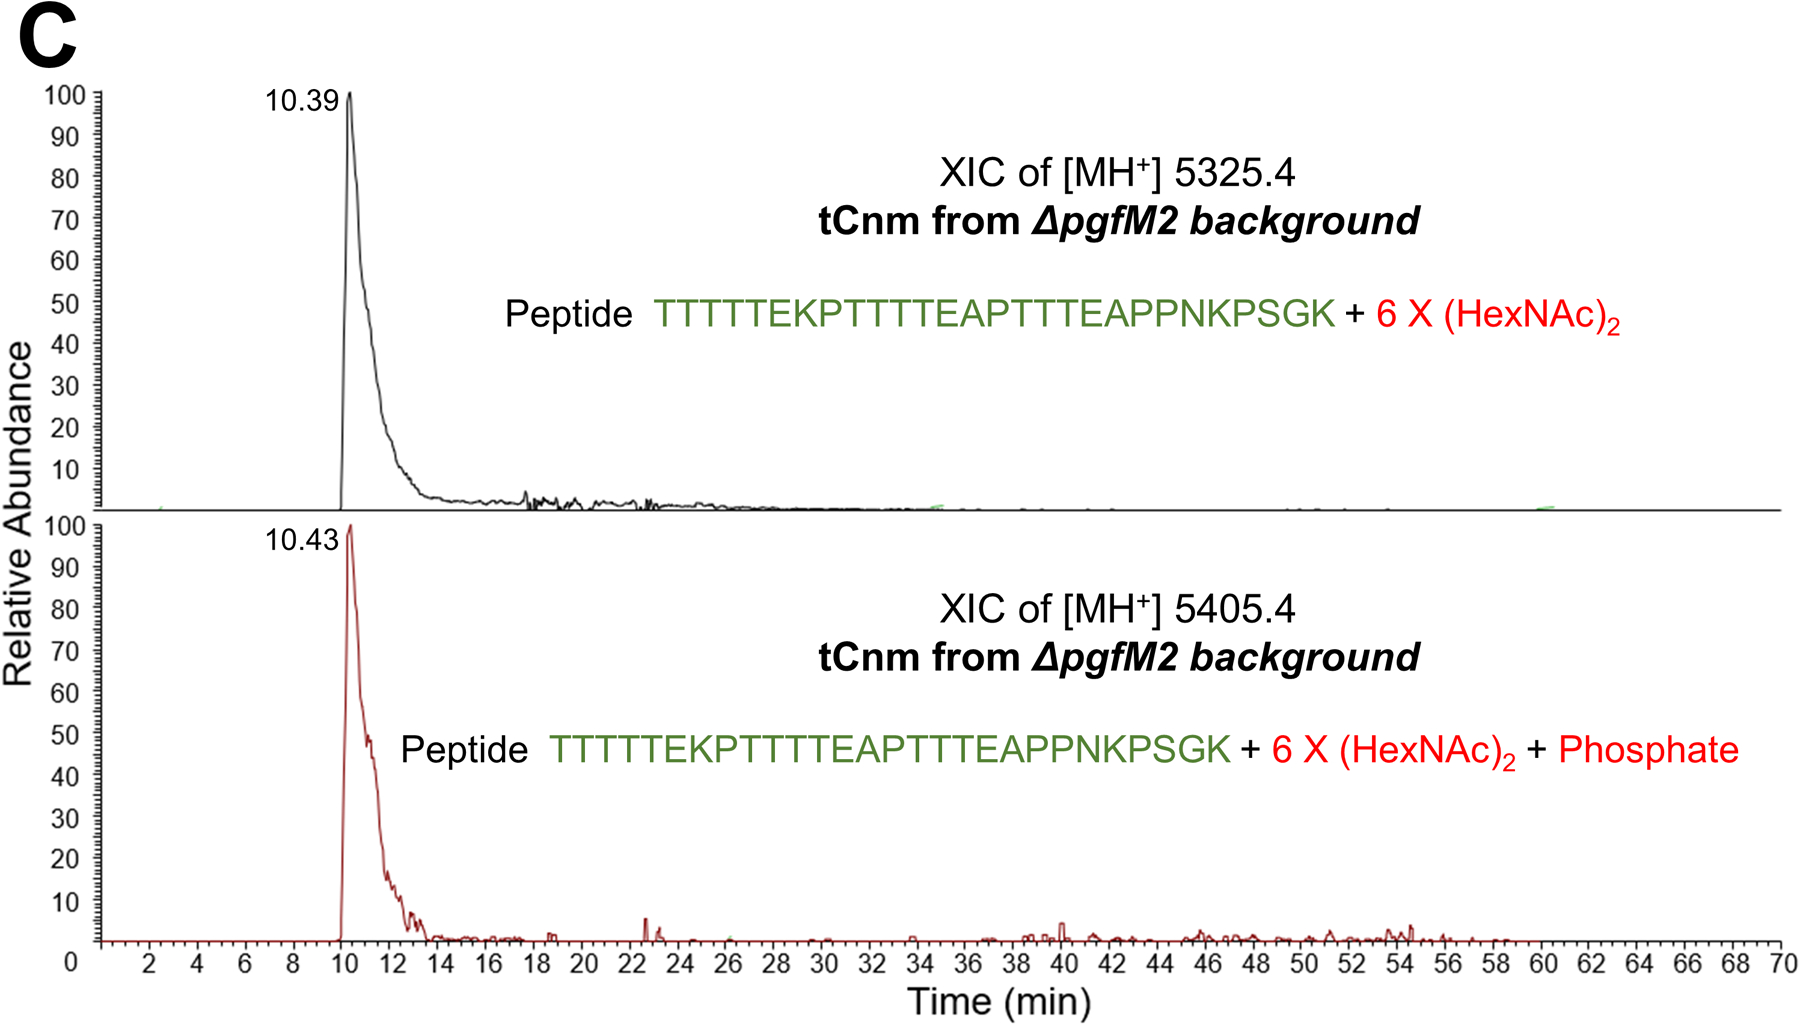
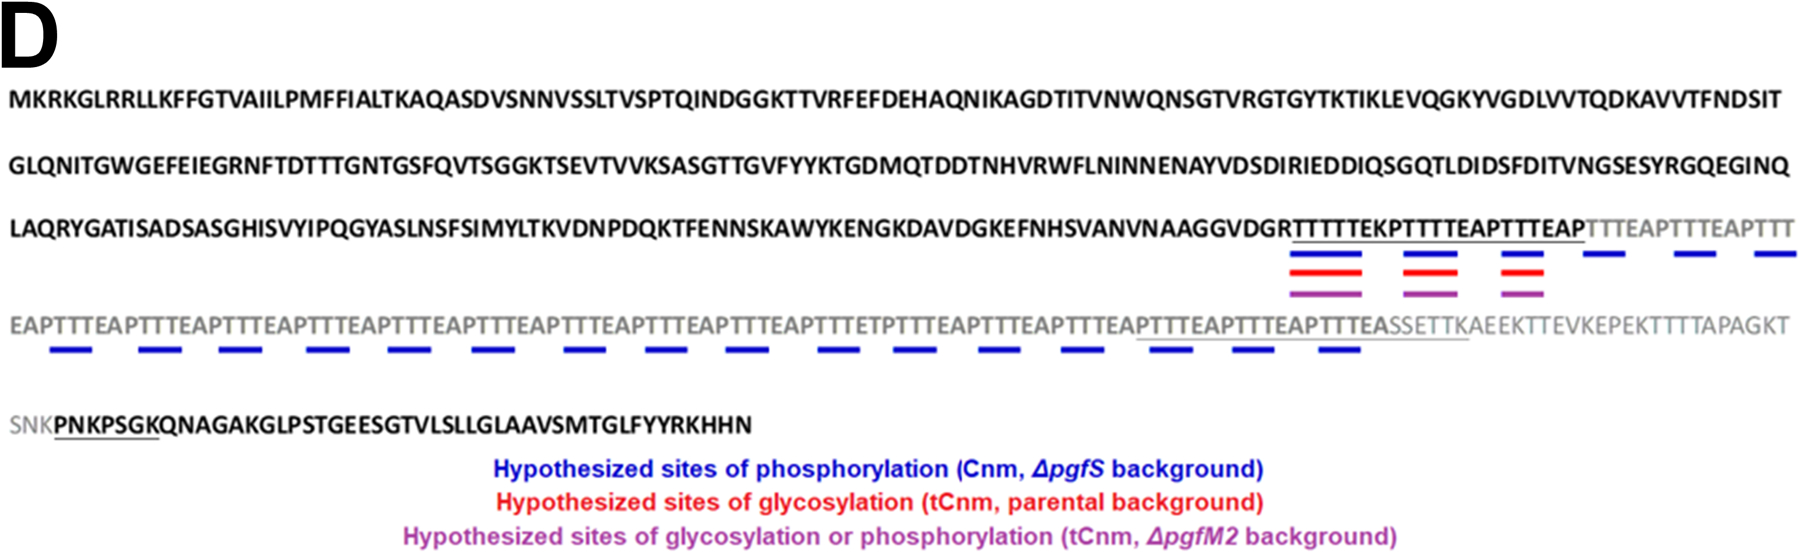
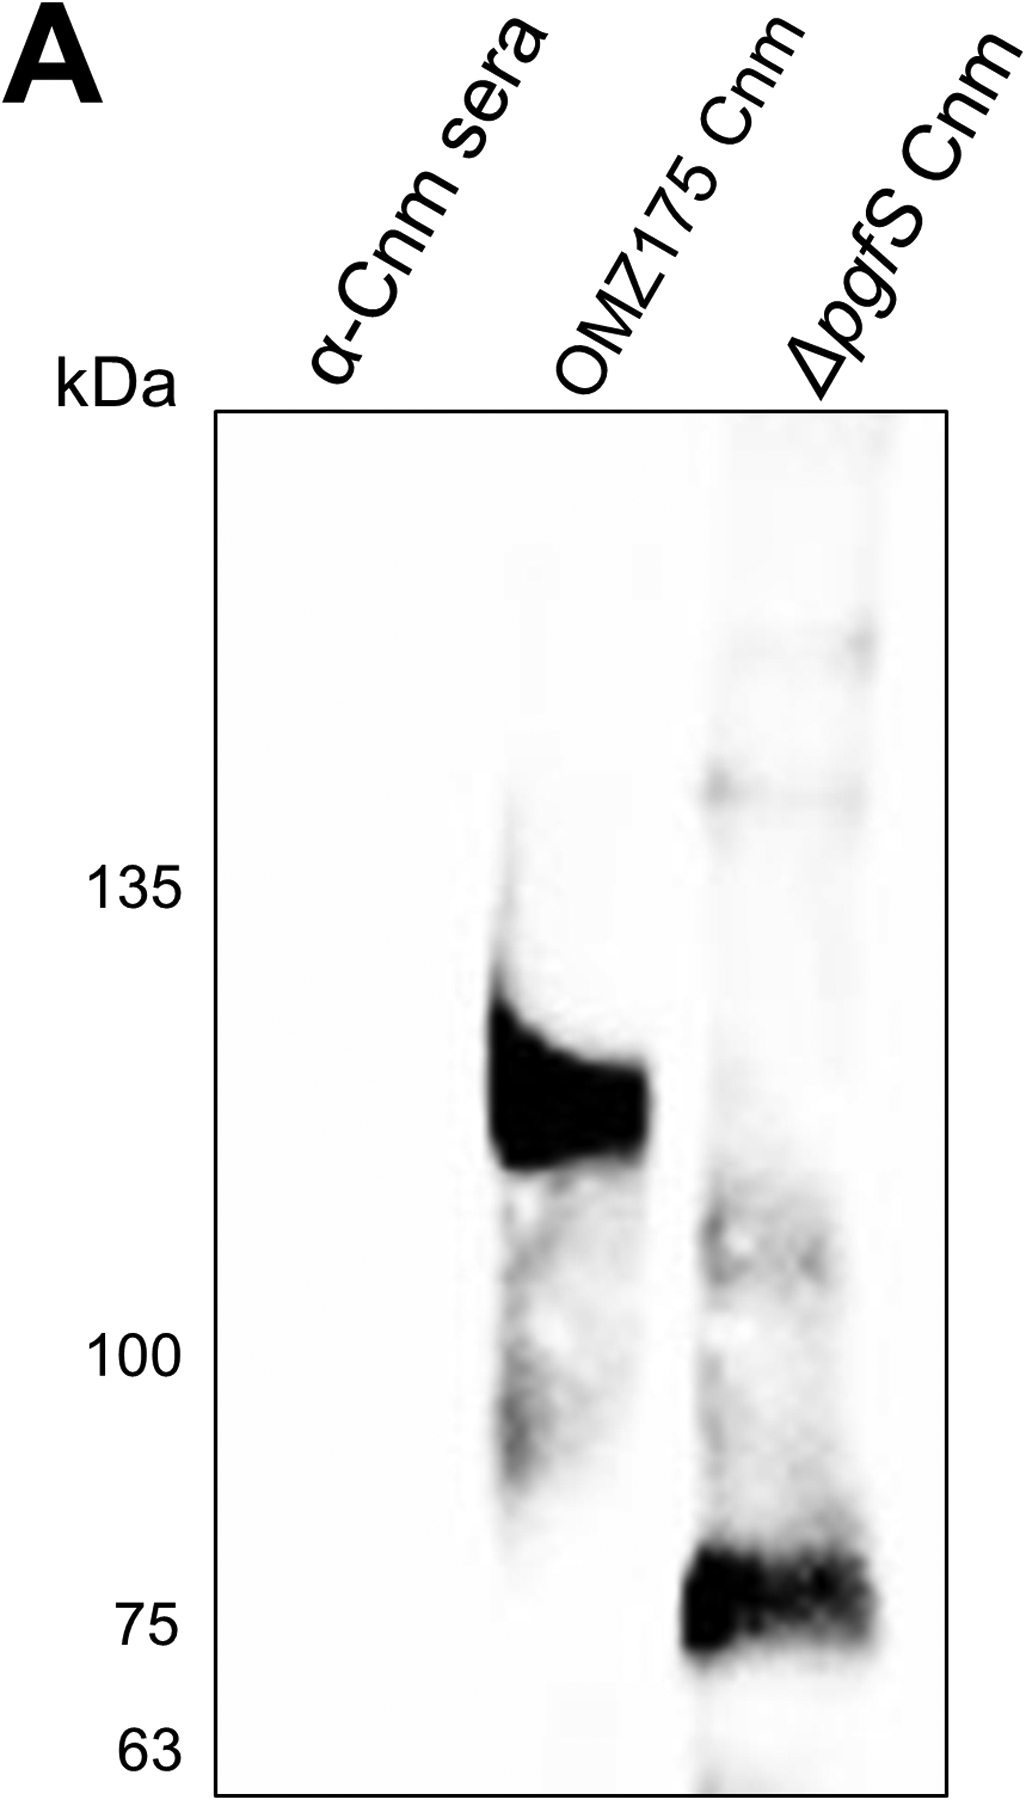
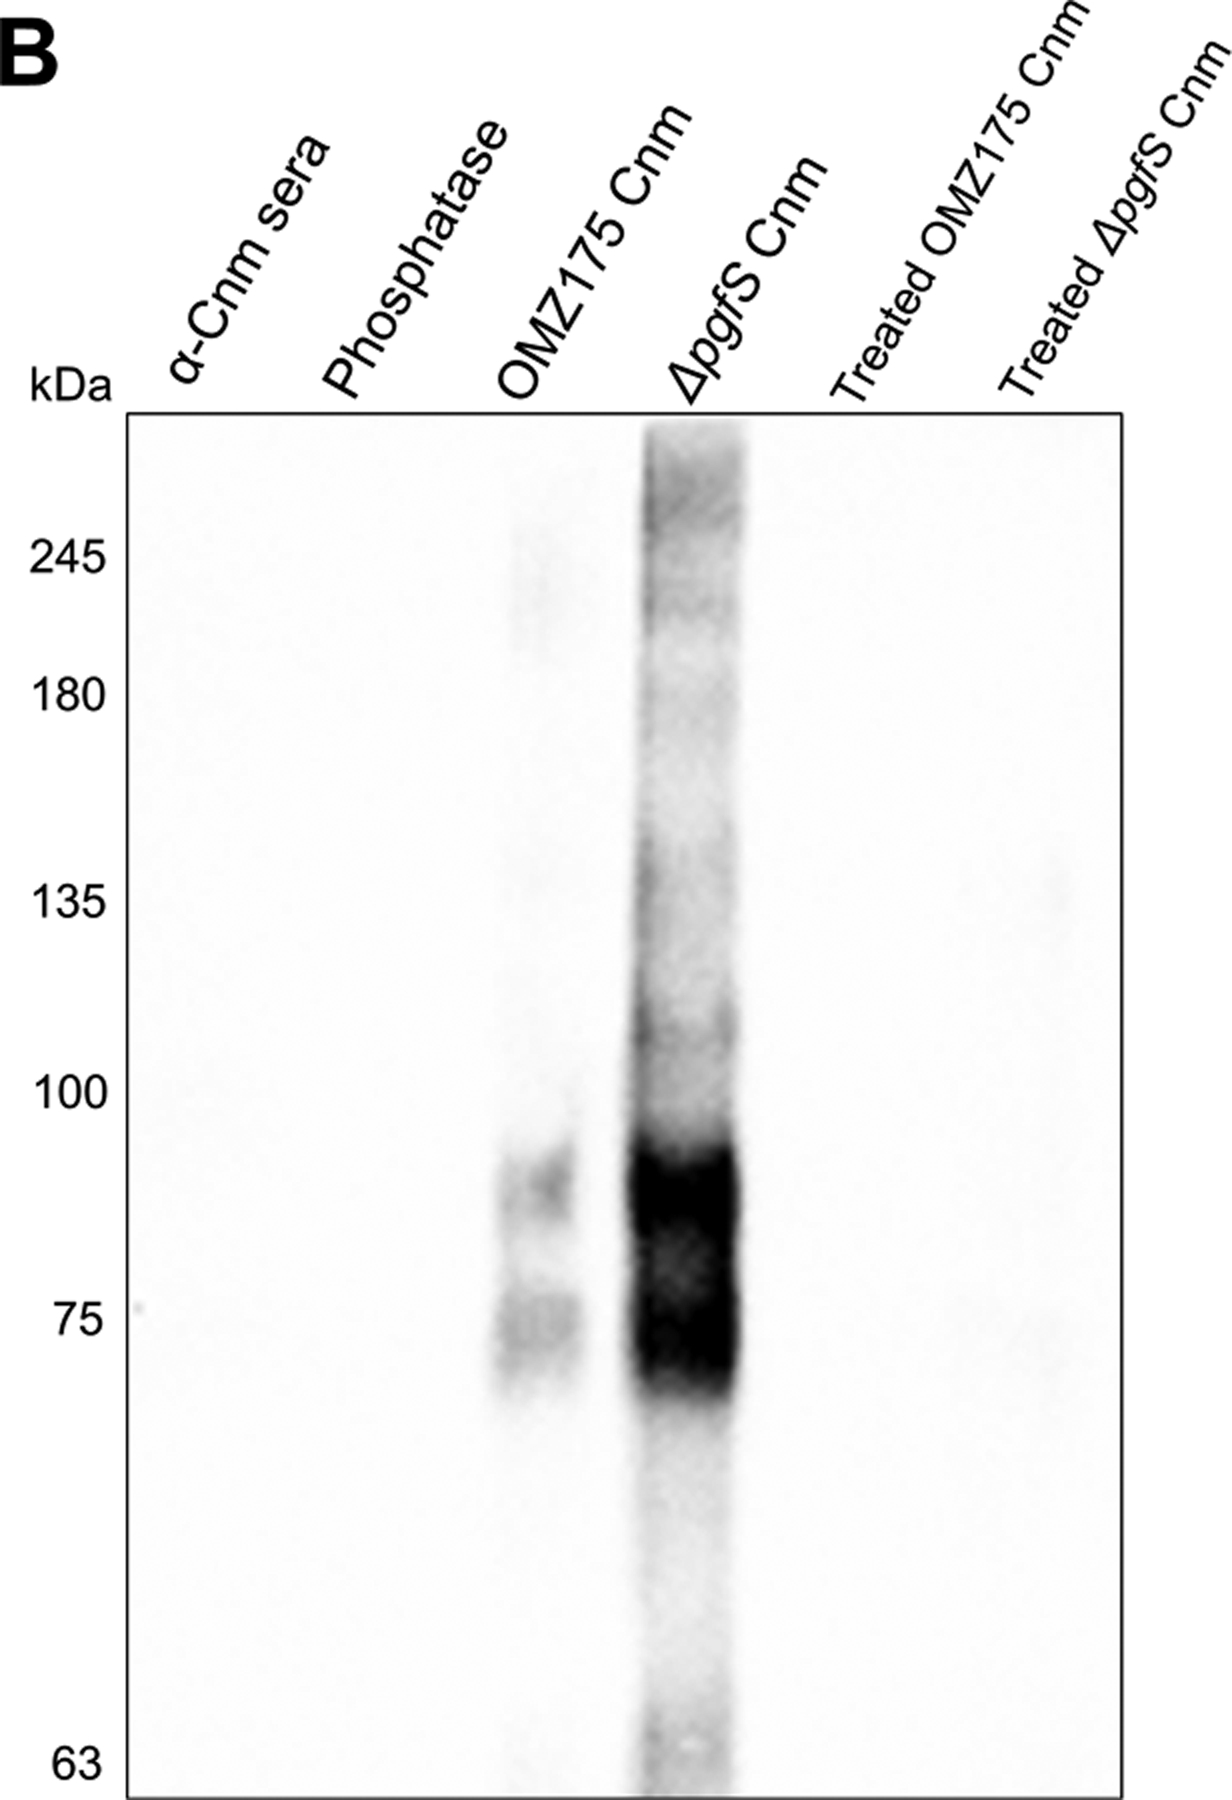
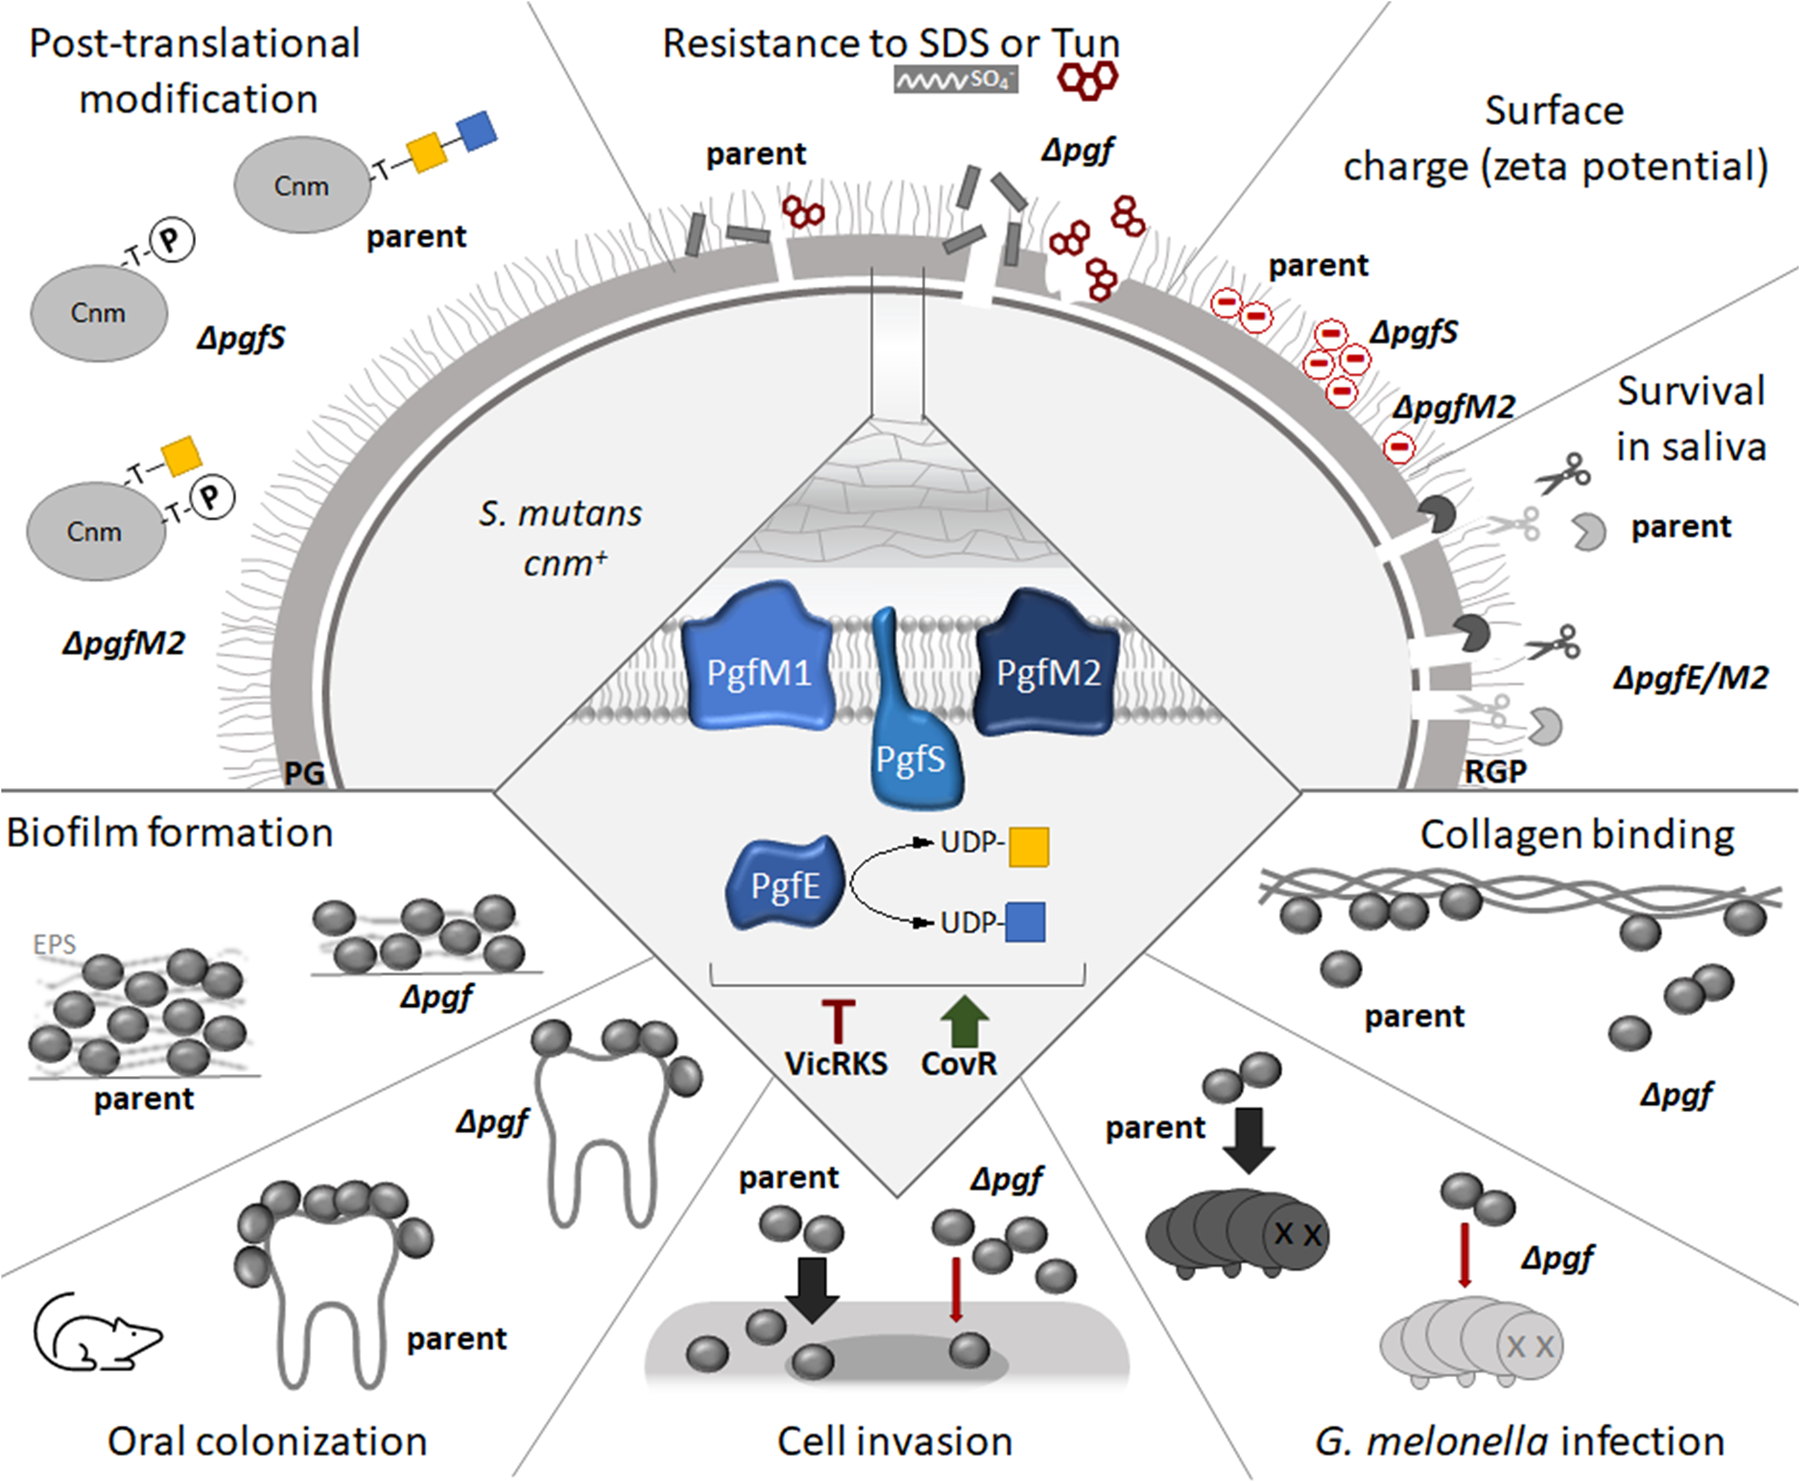
Streptococcus mutans is commonly associated with dental caries and the ability to form biofilms is essential for its pathogenicity. We recently identified the Pgf glycosylation machinery of S. mutans, responsible for the post-translational modification of the surface-associated adhesins Cnm and WapA. Since the four-gene pgf operon (pgfS-pgfM1-pgfE-pgfM2) is part of the S. mutans core genome, we hypothesized that the scope of the Pgf system goes beyond Cnm and WapA glycosylation. In silico analyses and tunicamycin sensitivity assays suggested a functional overlap between the Pgf machinery and the rhamnose-glucose polysaccharide synthesis pathway. Phenotypic characterization of pgf mutants (ΔpgfS, ΔpgfE, ΔpgfM1, ΔpgfM2, and Δpgf) revealed that the Pgf system is important for biofilm formation, surface charge, membrane stability, and survival in human saliva. Moreover, deletion of the entire pgf operon (Δpgf strain) resulted in significantly impaired colonization in a rat oral colonization model. Using Cnm as a model, we showed that Cnm is heavily modified with N-acetyl hexosamines but it becomes heavily phosphorylated with the inactivation of the PgfS glycosyltransferase, suggesting a crosstalk between these two post-translational modification mechanisms. Our results revealed that the Pgf machinery contributes to multiple aspects of S. mutans pathobiology that may go beyond Cnm and WapA glycosylation.

Keywords: Streptococcus mutans; Cnm; Pgf machinery; oral colonization; protein glycosylation; protein phosphorylation.


Conflict of interest statement

Conflicts of Interest

The authors declare no conflicts of interest.

Figures

Figure 1.
Figure 1.
Bioinformatics prediction of structural features of Pgf proteins. (A) Monomer analysis via AlphaFold2 (structure prediction), InterPro (Domains), and DeepTMHMM (prediction of domain positions in transmembrane proteins). Colors indicate AlphaFold per-residue estimate of confidence (pLDDT). (B) Rossmann fold regions from predicted structures of PgfS and PgfE. Color scheme selected to facilitate visualization of alternating α-helices and β-sheets. (C) GalaxyHomomer template-based modeling for Pgf proteins predicts PgfS as a tetramer (template PDB - 5EKP) and PgfE as a dimer (template PDB - 1I3K). Each color indicates a different monomer.
Figure 1.
Figure 1.
Bioinformatics prediction of structural features of Pgf proteins. (A) Monomer analysis via AlphaFold2 (structure prediction), InterPro (Domains), and DeepTMHMM (prediction of domain positions in transmembrane proteins). Colors indicate AlphaFold per-residue estimate of confidence (pLDDT). (B) Rossmann fold regions from predicted structures of PgfS and PgfE. Color scheme selected to facilitate visualization of alternating α-helices and β-sheets. (C) GalaxyHomomer template-based modeling for Pgf proteins predicts PgfS as a tetramer (template PDB - 5EKP) and PgfE as a dimer (template PDB - 1I3K). Each color indicates a different monomer.
None
Figure 2. The Pgf machinery contributes to cell surface charge but not to membrane permeability in S. mutans OMZ175. (A) Membrane permeability analysis using Ethidium Bromide (emission at 600 nm, extinction at 530 nm). Error bars indicate standard deviations. (B) Zeta potential of cells grown to mid-log phase. Bars indicate mean values and error bars indicate standard deviations. One-way ANOVA was performed to determine differences between each mutant and the parental strain (p < .0001). Asterisks denote post hoc comparison with the parental strain. * = p < .05; *** = p < .001.
Figure 3.
Figure 3.
Survival of S. mutans OMZ175 and its isogenic pgf mutants in saliva (A) and serum (B) and to opsonophagocytosis by peripheral blood mononuclear cells (C). The Pgf glycosylation machinery contributes to S. mutans’ survival in human saliva supplemented with 20 μM of glucose (A). 0.1% survival was the limit of detection. Connected dots indicate means and error bars indicate standard deviations. One-way ANOVA was performed on each time point to determine differences between each mutant and the parental strain. Asterisks denote post hoc comparison with the parental strain. (a) denotes differences between parental and ΔpgfS/ΔpgfM2 (p < .05) and between parental and Δpgf/ΔpgfE/ΔpgfM1 (p < .0001). (b) denotes differences between parental and ΔpgfM2 only (p < .0001). ns = non-significant; **** = p < .0001. (B) No significant variations in survival to human serum complemented with baby rabbit complement were observed at 24 or 48 hours of analysis. (C) The Δpgf mutant had comparable survival to the parental strain to opsonophagocytosis by peripheral blood mononuclear cells, whether in the presence of intact (NHS) or heat-inactivated (HIS) human complement serum.
Figure 3.
Figure 3.
Survival of S. mutans OMZ175 and its isogenic pgf mutants in saliva (A) and serum (B) and to opsonophagocytosis by peripheral blood mononuclear cells (C). The Pgf glycosylation machinery contributes to S. mutans’ survival in human saliva supplemented with 20 μM of glucose (A). 0.1% survival was the limit of detection. Connected dots indicate means and error bars indicate standard deviations. One-way ANOVA was performed on each time point to determine differences between each mutant and the parental strain. Asterisks denote post hoc comparison with the parental strain. (a) denotes differences between parental and ΔpgfS/ΔpgfM2 (p < .05) and between parental and Δpgf/ΔpgfE/ΔpgfM1 (p < .0001). (b) denotes differences between parental and ΔpgfM2 only (p < .0001). ns = non-significant; **** = p < .0001. (B) No significant variations in survival to human serum complemented with baby rabbit complement were observed at 24 or 48 hours of analysis. (C) The Δpgf mutant had comparable survival to the parental strain to opsonophagocytosis by peripheral blood mononuclear cells, whether in the presence of intact (NHS) or heat-inactivated (HIS) human complement serum.
Figure 4.
Figure 4.
The Pgf glycosylation machinery is important for proper biofilm formation in S. mutans OMZ175. Biofilms were grown for 48 hours with 1% (m/v) sucrose as the sole carbon source. Deletion of the entire pgf operon or each gene individually, except for pgfS, results in defects in biofilm biomass, viable cell recovery, and biofilm volume. (A) Crystal violet staining of biofilms relative to the parental strain, measured by absorbance at 595 nm (p < .0001). (B) Colony forming units (CFUs) recovered from biofilms (p = .0023). CFUs were estimated by plating serially diluted biofilms in BHI. Bars indicate mean values and error bars indicate standard deviations. (C) Confocal Laser Scanning Microscopy of the panel of S. mutans strains in volumetric view displays architectural differences for all pgf mutants when compared to the parental strain. A top (from above) and a slice view (middle of biofilm) are also represented. Representative images were chosen from four biological replicates, with three images collected for each replicate. Green = S. mutans cells, Red = Extracellular Polysaccharides (EPS). Each side of the square base = 210 μm. Scale bar = 50 μm. (D) Biofilm thickness as measured on a volumetric view via CLMS (p < .001). (E) The estimated volume of biofilms was calculated from Confocal Laser Microscopy Scanning by multiplying each area by the distance between layers. (p < .0001 for S. mutans; p = .0003 for EPS; p < .0001 for sum). (F) No differences in the amount of extracellular DNA in the biofilm matrix were observed for the pgf mutants in OMZ175. Bars indicate mean values and error bars indicate standard deviations. Analyses were performed with ANOVA. Asterisks denote post hoc comparison with the parental strain. ns = non-significant; * = p < .05; ** = p < .01; *** = p < .001; **** = p < .0001.
Figure 4.
Figure 4.
The Pgf glycosylation machinery is important for proper biofilm formation in S. mutans OMZ175. Biofilms were grown for 48 hours with 1% (m/v) sucrose as the sole carbon source. Deletion of the entire pgf operon or each gene individually, except for pgfS, results in defects in biofilm biomass, viable cell recovery, and biofilm volume. (A) Crystal violet staining of biofilms relative to the parental strain, measured by absorbance at 595 nm (p < .0001). (B) Colony forming units (CFUs) recovered from biofilms (p = .0023). CFUs were estimated by plating serially diluted biofilms in BHI. Bars indicate mean values and error bars indicate standard deviations. (C) Confocal Laser Scanning Microscopy of the panel of S. mutans strains in volumetric view displays architectural differences for all pgf mutants when compared to the parental strain. A top (from above) and a slice view (middle of biofilm) are also represented. Representative images were chosen from four biological replicates, with three images collected for each replicate. Green = S. mutans cells, Red = Extracellular Polysaccharides (EPS). Each side of the square base = 210 μm. Scale bar = 50 μm. (D) Biofilm thickness as measured on a volumetric view via CLMS (p < .001). (E) The estimated volume of biofilms was calculated from Confocal Laser Microscopy Scanning by multiplying each area by the distance between layers. (p < .0001 for S. mutans; p = .0003 for EPS; p < .0001 for sum). (F) No differences in the amount of extracellular DNA in the biofilm matrix were observed for the pgf mutants in OMZ175. Bars indicate mean values and error bars indicate standard deviations. Analyses were performed with ANOVA. Asterisks denote post hoc comparison with the parental strain. ns = non-significant; * = p < .05; ** = p < .01; *** = p < .001; **** = p < .0001.
Figure 5.
Figure 5.
The Pgf glycosylation machinery contributes to S. mutans OMZ175 fitness in vivo. Rat oral colonization experiment was performed with S. mutans OMZ175 and the quadruple Δpgf strain. (A) Direct comparison of recovered CFUs between strains for each type of media. Blood-agar indicates CFU counts of total cultivable microbiota, and BHI + antibiotics (BHI + Ab) indicates S. mutans CFU counts. (B) Comparison between the percentage of S. mutans relative to the total oral microbiota for each strain. T-tests were performed for each pair. ns = not significant; ** = p < .01. Bars indicate mean values and error bars indicate standard deviations.
Figure 5.
Figure 5.
The Pgf glycosylation machinery contributes to S. mutans OMZ175 fitness in vivo. Rat oral colonization experiment was performed with S. mutans OMZ175 and the quadruple Δpgf strain. (A) Direct comparison of recovered CFUs between strains for each type of media. Blood-agar indicates CFU counts of total cultivable microbiota, and BHI + antibiotics (BHI + Ab) indicates S. mutans CFU counts. (B) Comparison between the percentage of S. mutans relative to the total oral microbiota for each strain. T-tests were performed for each pair. ns = not significant; ** = p < .01. Bars indicate mean values and error bars indicate standard deviations.
Figure 6.
Figure 6.
Mass spectrometric analysis of glycosylation and phosphorylation status of Cnm and tCnm purified from parent and ΔpgfS and ΔpgfM2 mutants. Truncated Cnm (tCnm) is glycosylated with HexNAc in the TRRR whereas unglycosylated Cnm from the ΔpgfS mutant is phosphorylated. (A) MS/MS fragmentation (HCD) of a glycosylated peptide from parent tCnm. (B) MS/MS fragmentation (HCD) of a phosphorylated peptide from Cnm purified from the ΔpgfS mutant. (C) Extracted ion chromatographs (XICs) of tCnm peptides purified from the ΔpgfM2 mutant indicate partial glycosylation and partial phosphorylation. (D) Summary of discoveries displayed on panels A-C. Sequence of full-length Cnm (in black + grey) and tCnm (in black only) with proposed sites of post-translational modifications within the TRRR. Peptides shown in panels A-C are underlined.
Figure 6.
Figure 6.
Mass spectrometric analysis of glycosylation and phosphorylation status of Cnm and tCnm purified from parent and ΔpgfS and ΔpgfM2 mutants. Truncated Cnm (tCnm) is glycosylated with HexNAc in the TRRR whereas unglycosylated Cnm from the ΔpgfS mutant is phosphorylated. (A) MS/MS fragmentation (HCD) of a glycosylated peptide from parent tCnm. (B) MS/MS fragmentation (HCD) of a phosphorylated peptide from Cnm purified from the ΔpgfS mutant. (C) Extracted ion chromatographs (XICs) of tCnm peptides purified from the ΔpgfM2 mutant indicate partial glycosylation and partial phosphorylation. (D) Summary of discoveries displayed on panels A-C. Sequence of full-length Cnm (in black + grey) and tCnm (in black only) with proposed sites of post-translational modifications within the TRRR. Peptides shown in panels A-C are underlined.
Figure 7.
Figure 7.
Cnm purified from Streptococcus mutans OMZ175 and OMZ175ΔpgfS reacts with α-phosphothreonine antibodies. (A) Western blot using α-Cnm sera of Cnm purified from OMZ175 and its isogenic ΔpgfS mutant displays glycosylated and unglycosylated Cnm, respectively, at expected molecular weights. (B) Western blot using α-phosphothreonine antibodies and the same purified Cnm used for panel A. Two bands suggest the presence of different phosphorylated Cnm isoforms in both the OMZ175 and the ΔpgfS protein. Less phosphorylated Cnm were detected in OMZ175, suggesting a competition between phosphorylation and glycosylation machineries. When proteins were treated with a phosphatase enzyme, all bands vanished.
Figure 7.
Figure 7.
Cnm purified from Streptococcus mutans OMZ175 and OMZ175ΔpgfS reacts with α-phosphothreonine antibodies. (A) Western blot using α-Cnm sera of Cnm purified from OMZ175 and its isogenic ΔpgfS mutant displays glycosylated and unglycosylated Cnm, respectively, at expected molecular weights. (B) Western blot using α-phosphothreonine antibodies and the same purified Cnm used for panel A. Two bands suggest the presence of different phosphorylated Cnm isoforms in both the OMZ175 and the ΔpgfS protein. Less phosphorylated Cnm were detected in OMZ175, suggesting a competition between phosphorylation and glycosylation machineries. When proteins were treated with a phosphatase enzyme, all bands vanished.
Figure 8.
Figure 8.
Summary of findings from our current and previous studies. The Pgf glycosylation machinery is directly involved in the glycosylation of surface adhesins and possibly of the rhamnose-glucose polysaccharide layer. Using Cnm as a model of a Pgf substrate, we observed both glycosylation and phosphorylation modifications in our panel of mutants. Glycosylation appears to be favored over phosphorylation, suggesting crosstalk or competition between post-translational modification pathways. Pgf glycosylation also modulates surface charge, membrane homeostasis, biofilm formation, saliva survival, and fitness in an oral colonization model. Previously studied phenotypes associated with proper glycosylation of Cnm are endothelial and epithelial cell invasion, systemic infection in the Galleria mellonella model, and collagen binding. Expression of pgf genes is under positive regulation via CovR and negative regulation via VicRKS. PG = peptidoglycan; RGP = rhamnose-glycose polysaccharide; P = phosphate; EPS = extracellular polysaccharides. Following the Symbol Nomenclature For Glycans, GlcNAc (N-Acetylglucosamine) is depicted as a blue square and GalNAc (N-Acetylgalactosamine) is depicted as a yellow square.

Similar articles

Cited by

References

    1. Abranches J, Miller JH, Martinez AR, Simpson-Haidaris PJ, Burne RA, and Lemos JA (2011) The collagen-binding protein Cnm is required for Streptococcus mutans adherence to and intracellular invasion of human coronary artery endothelial cells. Infection and Immunity 79: 2277–2284. - PMC - PubMed
    1. Allen KN, and Imperiali B (2019) Structural and mechanistic themes in glycoconjugate biosynthesis at membrane interfaces. Curr Opin Struct Biol 59: 81–90. - PMC - PubMed
    1. Alves LA, Ganguly T, Mattos-Graner RO, Kajfasz J, Harth-Chu EN, Lemos JA, et al. (2018) CovR and VicRKX regulate transcription of the collagen binding protein Cnm of Streptococcus mutans. Journal of Bacteriology 200: 1–14. - PMC - PubMed
    1. Andresen S, Cologna N. de M. di, Archer-Hartman S, Rogers AM, Samaddar S, Black IM, et al. (2023) Involvement of the Streptococcus mutans UDP-4-epimerases PgfE and GalE in protein glycosylation, carbon metabolism and cell surface glycosylation. Glycobiology 33: 245–259. - PMC - PubMed
    1. Andresen S, Fantone K, Chapla D, Rada B, Moremen KW, Pierce M, and Szymanski CM (2022) Human Intelectin-1 Promotes Cellular Attachment and Neutrophil Killing of Streptococcus pneumoniae in a Serotype-Dependent Manner. Infection and Immunity 90 https://journals.asm.org/doi/10.1128/iai.00682-21. - DOI - PMC - PubMed

Publication types

MeSH terms

LinkOut - more resources