. 2023 Nov 21;120(47):e2313137120.
doi: 10.1073/pnas.2313137120. Epub 2023 Nov 16.

SOS1 and KSR1 modulate MEK inhibitor responsiveness to target resistant cell populations based on PI3K and KRAS mutation status

Affiliations

SOS1 and KSR1 modulate MEK inhibitor responsiveness to target resistant cell populations based on PI3K and KRAS mutation status

Brianna R Daley et al. Proc Natl Acad Sci U S A. .

Abstract

KRAS is the most commonly mutated oncogene. Targeted therapies have been developed against mediators of key downstream signaling pathways, predominantly components of the RAF/MEK/ERK kinase cascade. Unfortunately, single-agent efficacy of these agents is limited both by intrinsic and acquired resistance. Survival of drug-tolerant persister cells within the heterogeneous tumor population and/or acquired mutations that reactivate receptor tyrosine kinase (RTK)/RAS signaling can lead to outgrowth of tumor-initiating cells (TICs) and drive therapeutic resistance. Here, we show that targeting the key RTK/RAS pathway signaling intermediates SOS1 (Son of Sevenless 1) or KSR1 (Kinase Suppressor of RAS 1) both enhances the efficacy of, and prevents resistance to, the MEK inhibitor trametinib in KRAS-mutated lung (LUAD) and colorectal (COAD) adenocarcinoma cell lines depending on the specific mutational landscape. The SOS1 inhibitor BI-3406 enhanced the efficacy of trametinib and prevented trametinib resistance by targeting spheroid-initiating cells in KRASG12/G13-mutated LUAD and COAD cell lines that lacked PIK3CA comutations. Cell lines with KRASQ61 and/or PIK3CA mutations were insensitive to trametinib and BI-3406 combination therapy. In contrast, deletion of the RAF/MEK/ERK scaffold protein KSR1 prevented drug-induced SIC upregulation and restored trametinib sensitivity across all tested KRAS mutant cell lines in both PIK3CA-mutated and PIK3CA wild-type cancers. Our findings demonstrate that vertical inhibition of RTK/RAS signaling is an effective strategy to prevent therapeutic resistance in KRAS-mutated cancers, but therapeutic efficacy is dependent on both the specific KRAS mutant and underlying comutations. Thus, selection of optimal therapeutic combinations in KRAS-mutated cancers will require a detailed understanding of functional dependencies imposed by allele-specific KRAS mutations.

Keywords: KSR1; RAS; SOS1; resistance; trametinib.


Conflict of interest statement

The Kortum laboratory receives funding from Boehringer Ingelheim to study SOS1 as a therapeutic target in RAS-mutated cancers.

Figures

Fig. 1.
Fig. 1.
MEK and SOS1 inhibition synergize to prevent rebound signaling in KRASG12/PIK3CAWT-mutated LUAD cells. (A) Heat map of cell viability (Top) and excess over Bliss (EOB, Bottom) for the indicated KRAS-mutated LUAD cell lines treated with increasing (semilog) doses of trametinib (10−10.5 to 10−7), BI-3406 (10−9 to 10−5.5) or the combination of trametinib + BI-3406 under 3D spheroid culture conditions. The KRAS and PIK3CA mutational status of each cell line is indicated. Data are the mean from three independent experiments, each experiment had three technical replicates. (B, D, and E) The sum of excess over Bliss for the 9×9 matrix of cells treated with trametinib + BI-3406 from A (B), KRASG12/PIK3CAWT cells expressing a WT or H1047R mutant p110α catalytic subunit (D), or KRASG12/PIK3CAmut-mutated LUAD cells treated with increasing doses of copanlisib (E). EOB > 0 indicates increasing synergy. (C) Western blots of WCLs of 3D spheroid cultured H727 cells treated with trametinib (10 nM) ± BI-3406 (300 nM) for the indicated times. Western blots are for pERK, ERK, pAKT (Ser 473), and AKT. (F) GDP/GTP RAS cycling in different KRAS mutations with the proposed SOS1 inhibitor sensitivities.
Fig. 2.
Fig. 2.
SOS1 inhibition prevents trametinib-induced SIC outgrowth. (A) Aldefluor staining for ALDH enzyme activity in DEAB negative control (DEAB), untreated H727 cells, or H727 cells treated with 100 nM trametinib or selumetinib for 72 h. (B–G) SIC frequency from in situ ELDAs of the indicated cell lines pretreated with 100 nM trametinib or selumetinib for 72 h (B), cells where SOS1 has been knocked out vs. nontargeting controls (C), H727 cells treated with the indicated doses of BI-3406 (D), cells pretreated with trametinib for 72 h to upregulate TICs and then left untreated or treated with BI-3406 (E), cells expressing WT or H1047R mutant p110α pretreated with trametinib for 72 h to upregulate TICs and then left untreated or treated with BI-3406 (F), LU99A cells treated with the indicated dose of copanlisib alone (Left) or pretreated with 100 nM trametinib ± the indicated dose of copanlisib for 72 h to upregulate TICs and then left untreated or treated with BI-3406 (G). #P < 0.05 vs. untreated; ##P < 0.01 vs. untreated for TIC upregulation by MEK inhibitor treatment vs. untreated controls. *P < 0.05 vs. untreated; **P < 0.01 for TIC inhibition by BI-3406 treatment compared to untreated controls; ^P < 0.05, ^^P < 0.01 vs. untreated for copanlisib treated cells. Data are representative of three independent experiments.
Fig. 3.
Fig. 3.
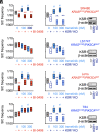
KSR1 KO inhibits TIC survival and enhances sensitivity to trametinib in KRASQ61-mutated LUAD cells. (A) In vivo limiting dilution analysis data showing TIC frequency in H460 (KRASQ61H/PIK3CAMUT) cells. The indicated numbers of cells were injected into the shoulder and flank of NCG mice (Charles River). Tumors were scored at 30 d. (B and C) EC50 values (B) and trametinib dose-response curve indicating % cell viability (GellTitre Glo, left axis) and relative cell death (CellTox Green, right axis) (C) for H460 cells treated with the indicated concentrations of trametinib in anchorage-independent (3D) conditions for 72 h. Vertical dashed lines show the intersection of viability and death curves for each population; KSR1 KO or addback lines are shown for comparison. (D and E) Western blots of WCLs from H460 cells treated with trametinib (100 nM) for the indicated times (D) or with the indicated dose of trametinib for 24 h (E). Western blots are for pERK and ERK. (F) PLA assessing MEK-ERK complex stability in H460 cells treated with the indicated dose of trametinib for 24 h; red = MEK-ERK complexes, blue = DAPI. (G) Quantification of the total area of MEK-ERK clusters from PLA in F. Each individual point represents a cell, data are quantified from >20 cells from three fields from three independent experiments. (H) Single-cell colony-forming assays for NT vs. KSR1 KO H460 cells expressing the indicated ERK2-MEK1 fusion proteins. Cells were single-cell plated in nonadherent conditions, and colony formation was scored at 14 d by CellTitre Glo. Each individual point represents a colony. Western blots for KSR1 and β-actin in each cell population are shown in A. *P < 0.05; ***P < 0.001 vs. nontargeting controls; #P < 0.05, ##P < 0.01, ###P < 0.001 vs. KSR1 KO.
Fig. 4.
Fig. 4.
KSR1 KO and SOS1 inhibition show differential inhibition of basal and trametinib-induced SICs in KRAS-mutated COAD cells. (A) SIC frequency from in situ ELDAs in the indicated COAD cell lines pretreated with trametinib for 72 h to upregulate SICs, and then left untreated or treated with the SOS1 inhibitor BI-3406. The KRAS and PIK3CA mutational status for each cell line is indicated. (B) SIC frequency from in situ ELDAs in the indicated NT and KSR1 KO COAD cells pretreated with trametinib for 72 h. Western blots of WCLs for KSR1 and β-actin are shown on the Right. #P < 0.05 vs. untreated; ##P < 0.01 vs. untreated for SIC upregulation by MEK inhibitor treatment vs. untreated controls. **P < 0.01 for SIC inhibition by BI-3406 treatment compared to untreated controls. ^P < 0.05; ^^P < 0.01 for KSR1 KO compared to untreated controls. Data are representative of three independent experiments.
Fig. 5.
Fig. 5.
KSR1 regulation of TICs/SICs in COAD is dependent on interaction with ERK and relevant in vivo. (A) Western blot for KSR1 and β-actin loading controls from WCLs of HCT116 (KRASG13D/PIK3CAmut) NT, KSR1 KO, KSR1 KO + KSR1 addback, and KSR1 KO+ERK-binding mutant KSR1 (KSR1AAAP) addback cells. (B) Aldefluor staining for ALDH enzyme activity in the indicated cells including a DEAB negative control. (C) Single-cell colony-forming assays. Cells were single-cell plated in nonadherent conditions, and colony formation was scored at 14 d by CellTitre Glo. Each individual point represents a colony. (D) Soft agar colony-forming assay. A total of 1 × 10³ cells per well were plated in 0.4% agar, and colony formation was scored at 28 d. (E) In vivo limiting dilution analysis data showing frequency of TICs in nontargeting control (NT) and KSR1 KO HCT116 COAD cells. The indicated numbers of cells were injected into the shoulder and flank of NCG mice (Charles River). Tumors were scored at 30 d. (F) Single-cell colony-forming assay in H460 cells pretreated with the indicated doses of trametinib for 72 h. Cells were single-cell plated in nonadherent conditions, and colony formation was scored at 14 d by CellTitre Glo. Each individual point represents a colony. ##P < 0.01, ###P < 0.001 vs. untreated for SIC upregulation by MEK inhibitor treatment vs. untreated controls; ***P < 0.001, ****P < 0.0001 for TIC/SIC inhibition by KSR1 KO vs. controls; ^^^P < 0.001, ^^^^P < 0.0001 vs. KSR1 KO.
Fig. 6.
Fig. 6.
SOS1 inhibition and KSR1 KO delay outgrowth of trametinib-resistant cells in multiwell resistance assays depending upon the KRAS mutational status. Multiwell resistance assay was performed as outlined in the Materials and Methods. (A–E) Trametinib resistance in KRASG12/PIK3CAWT H727 (A) and H358 (B), KRASG12/PIK3CAMUT LU99A (C), KRASQ61/PIK3CAWT Calu6 cells treated with trametinib (D), or KRASQ61/PIK3CAWT H460 cells (E) treated with an EC85 dose of trametinib with and without SOS1 inhibitor BI-3406. (F and G) Trametinib resistance in control and KSR1 KO KRASQ61K-mutated/PIK3CAMUT H460 LUAD cells (F) and KRASG13D-mutated/PIK3CAMUT HCT116 COAD cells (G). In (G), rescue of KSR1 KO using either WT KSR1 or a KSR1AAAP ERK-binding mutant on trametinib resistance was also tested. Data from N = 3 independent experiments were combined to generate Kaplan–Meier curves. ***P < 0.001 vs. single-drug treatment (A–E) or NT controls (F–G).

Similar articles

Cited by

References

    1. Cox A. D., Fesik S. W., Kimmelman A. C., Luo J., Der C. J., Drugging the undruggable RAS: Mission possible? Nat. Rev. Drug Discov. 13, 828–851 (2014). - PMC - PubMed
    1. Prior I. A., Hood F. E., Hartley J. L., The frequency of Ras mutations in cancer. Cancer Res. 80, 2969–2974 (2020). - PMC - PubMed
    1. Reck M., Carbone D. P., Garassino M., Barlesi F., Targeting KRAS in non-small-cell lung cancer: Recent progress and new approaches. Ann. Oncol. 32, 1101–1110 (2021). - PubMed
    1. Bear A. S., et al. , Biochemical and functional characterization of mutant KRAS epitopes validates this oncoprotein for immunological targeting. Nat. Commun. 12, 4365 (2021). - PMC - PubMed
    1. Hayes T. K., et al. , Long-term ERK inhibition in KRAS-mutant pancreatic cancer is associated with MYC degradation and senescence-like growth suppression. Cancer Cell 29, 75–89 (2016). - PMC - PubMed

MeSH terms

Substances