. 2023 Dec;382(6674):1042-1050.
doi: 10.1126/science.adg5314. Epub 2023 Nov 16.

Time-resolved live-cell spectroscopy reveals EphA2 multimeric assembly

Affiliations

Time-resolved live-cell spectroscopy reveals EphA2 multimeric assembly

Xiaojun Shi et al. Science. 2023 Dec.

Abstract

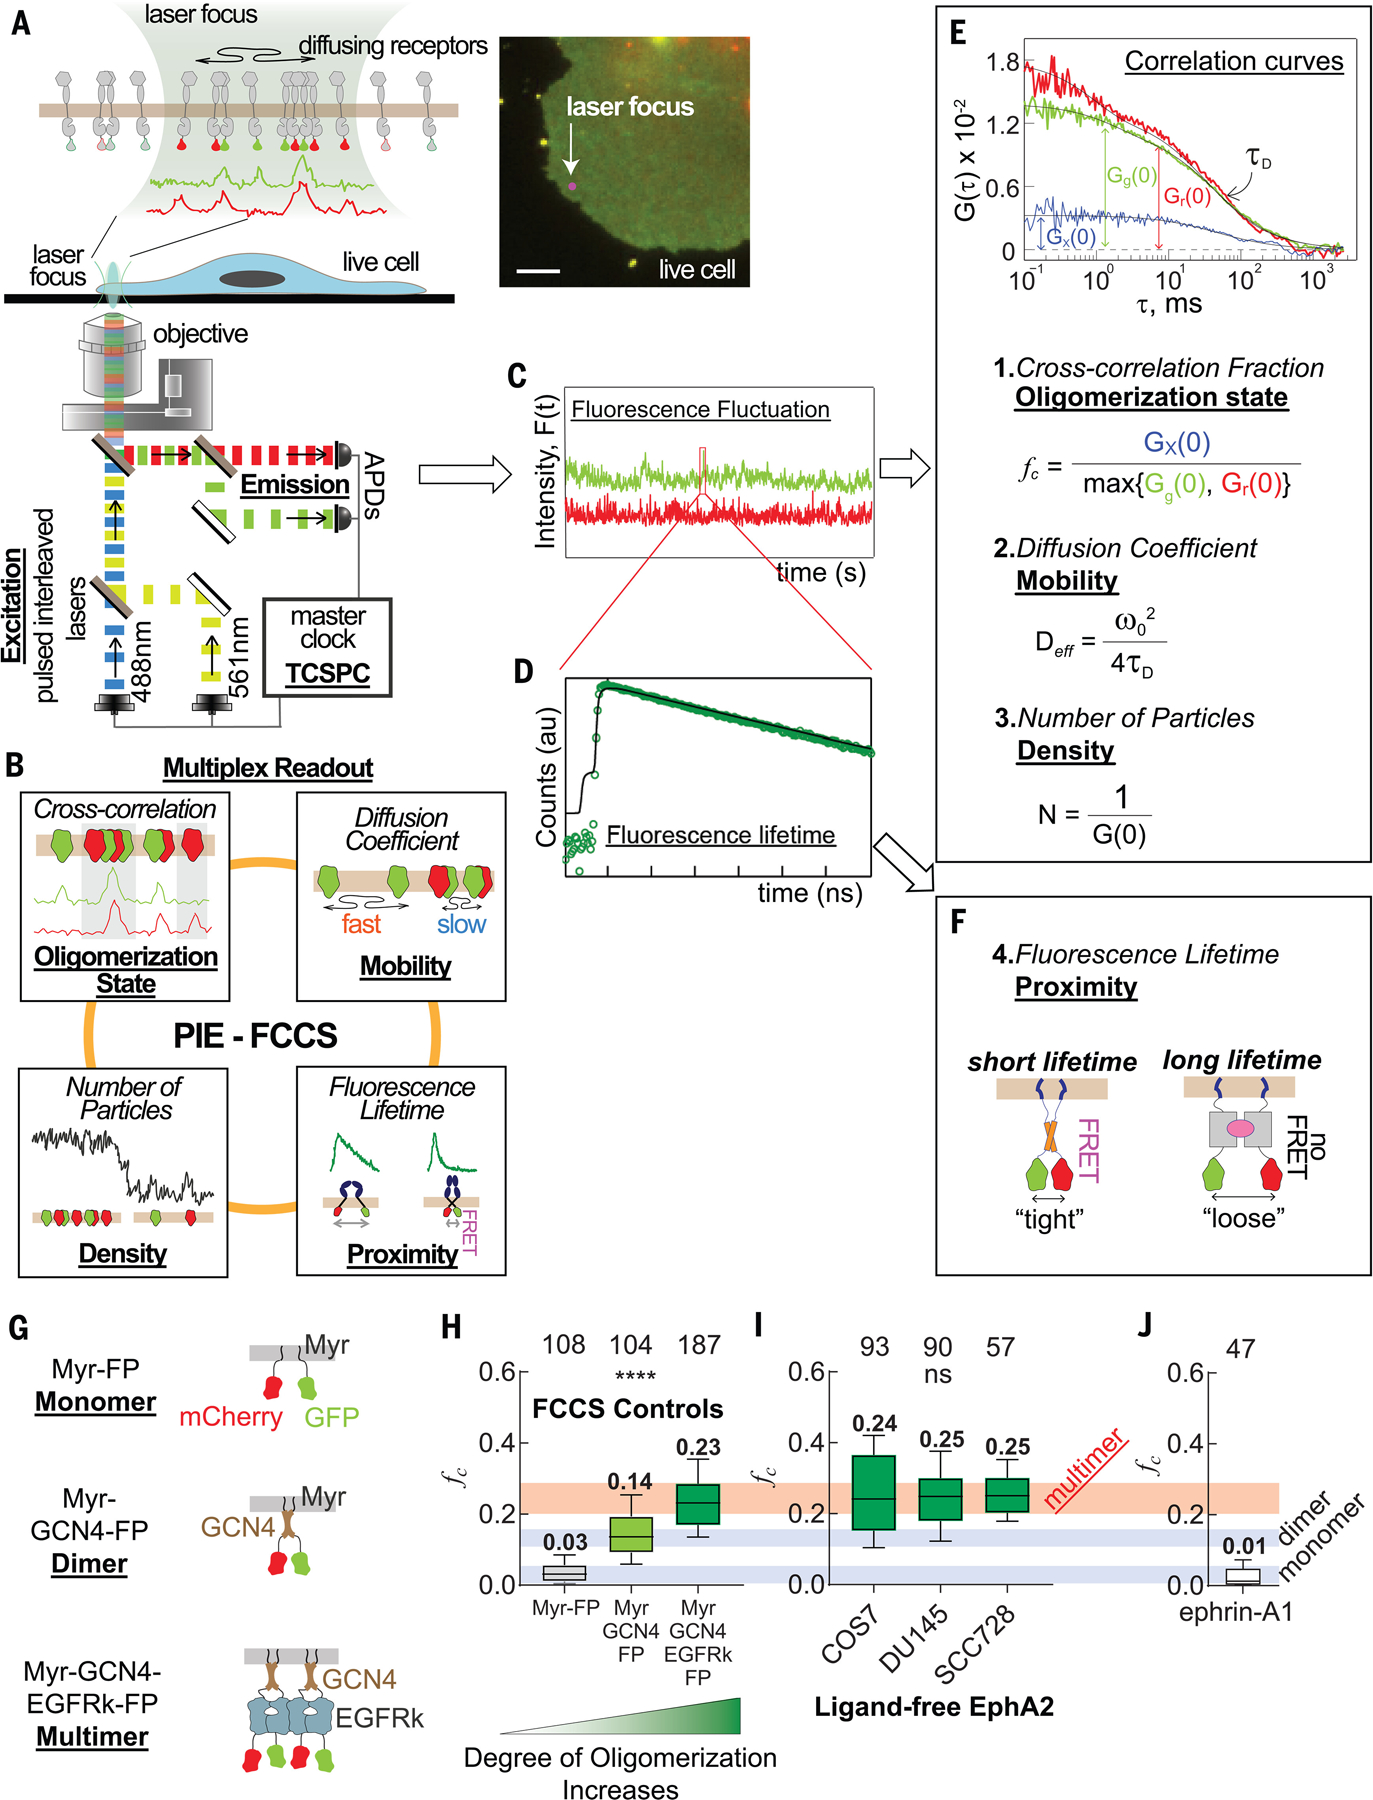
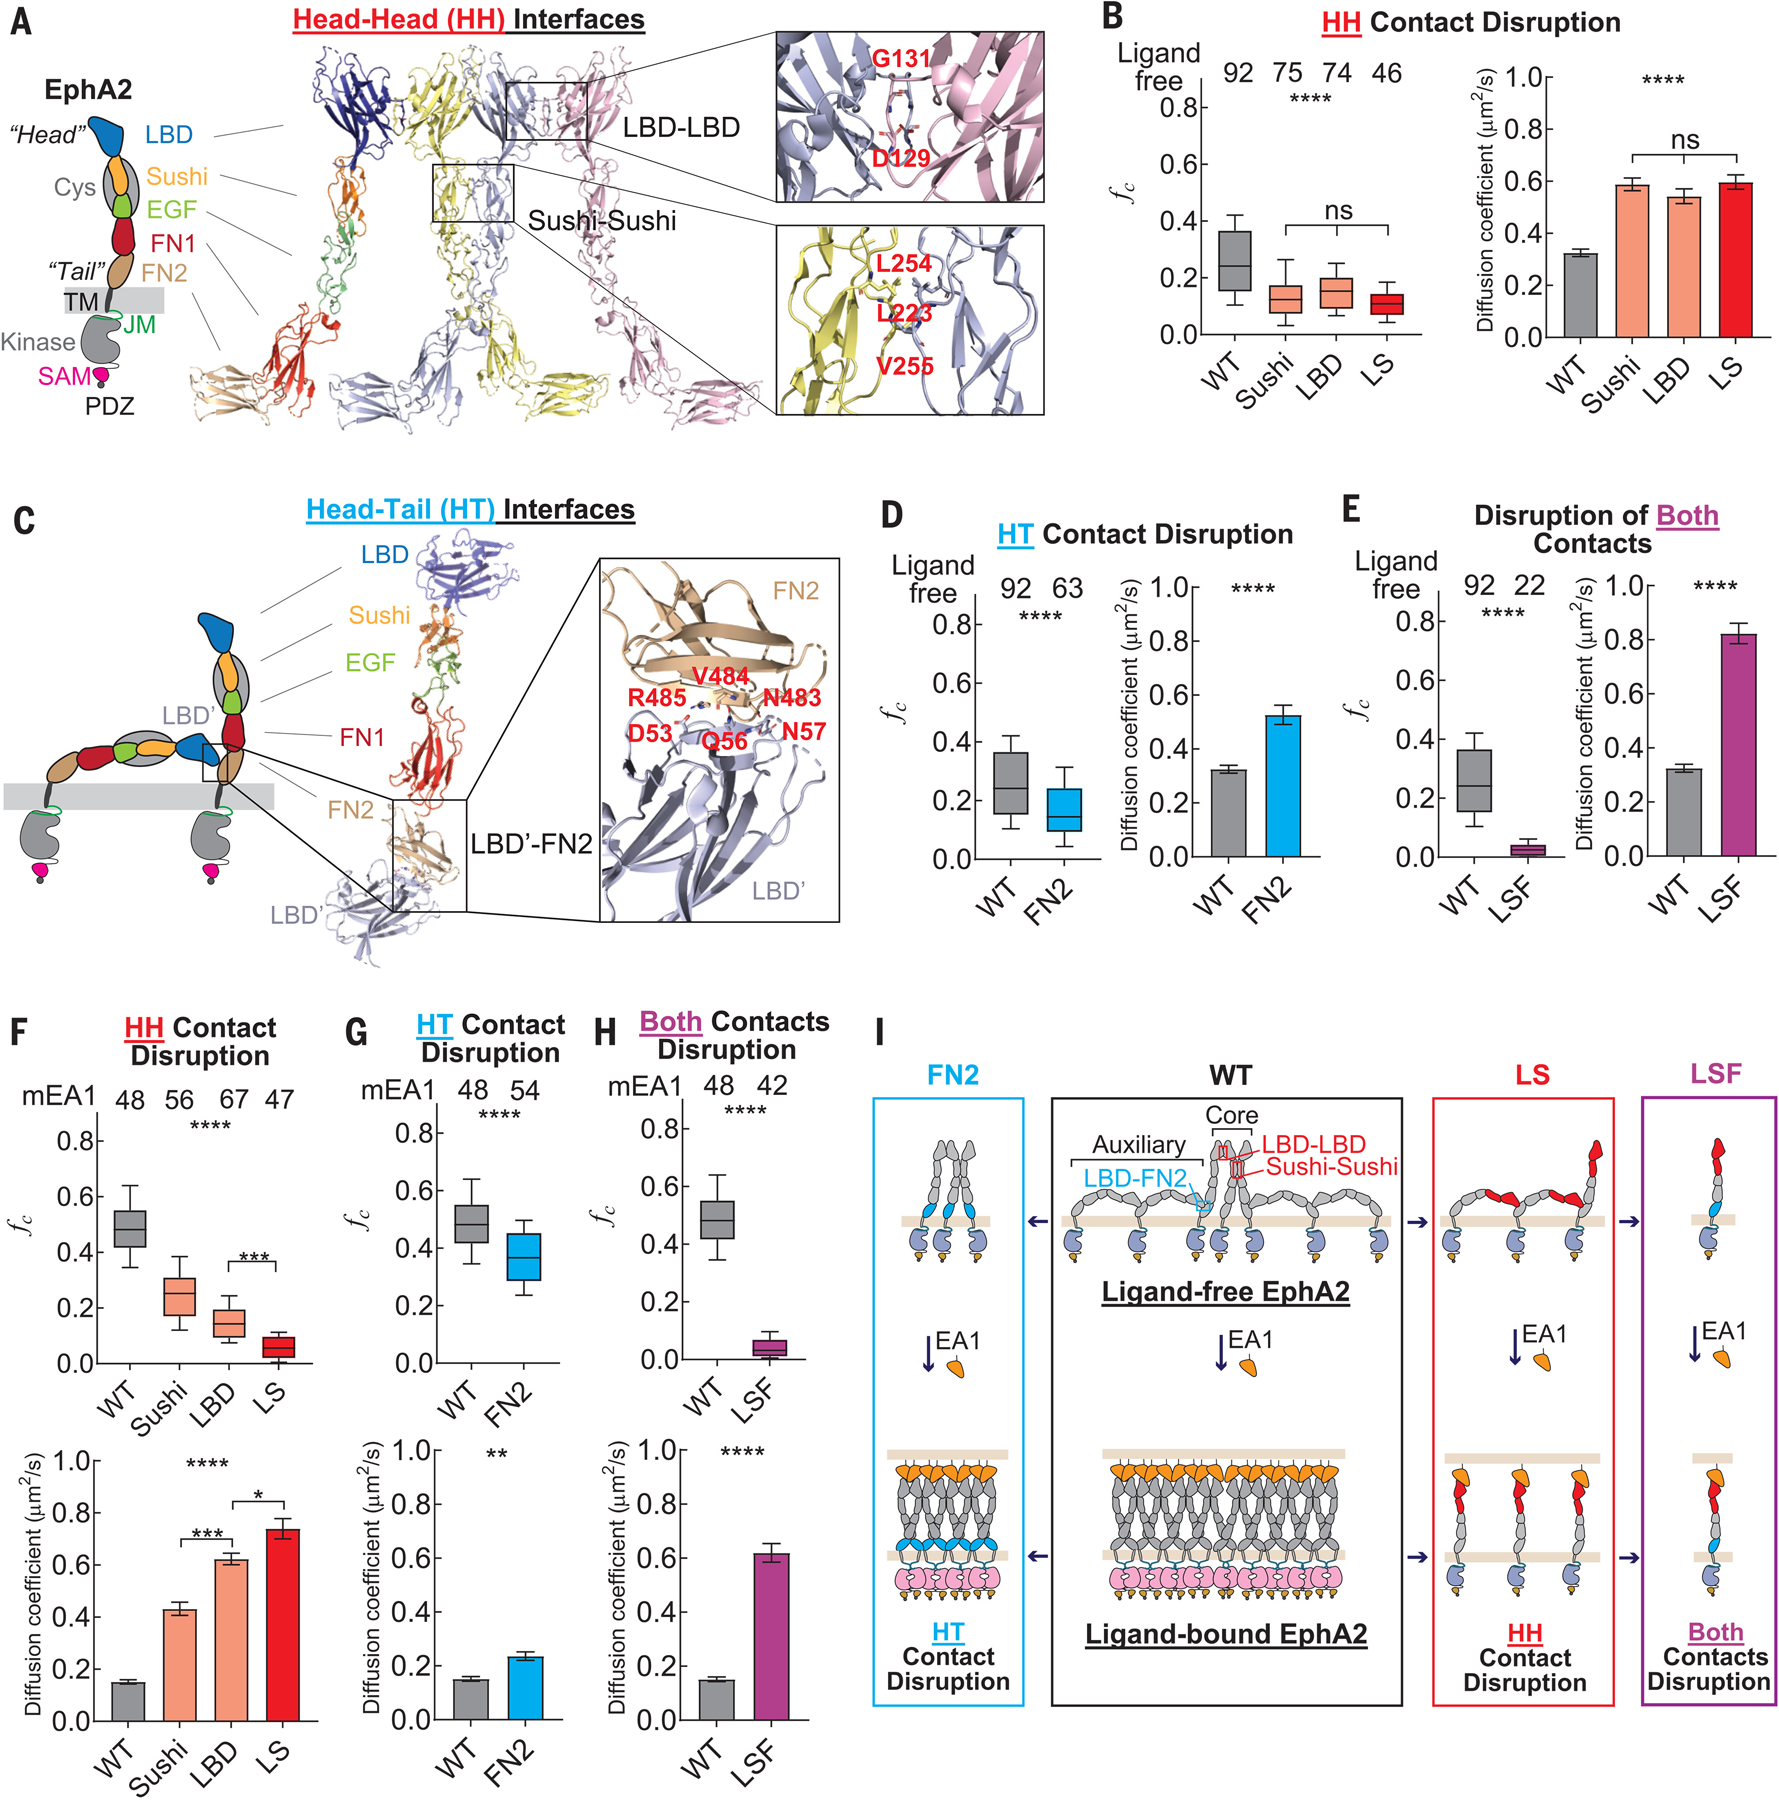
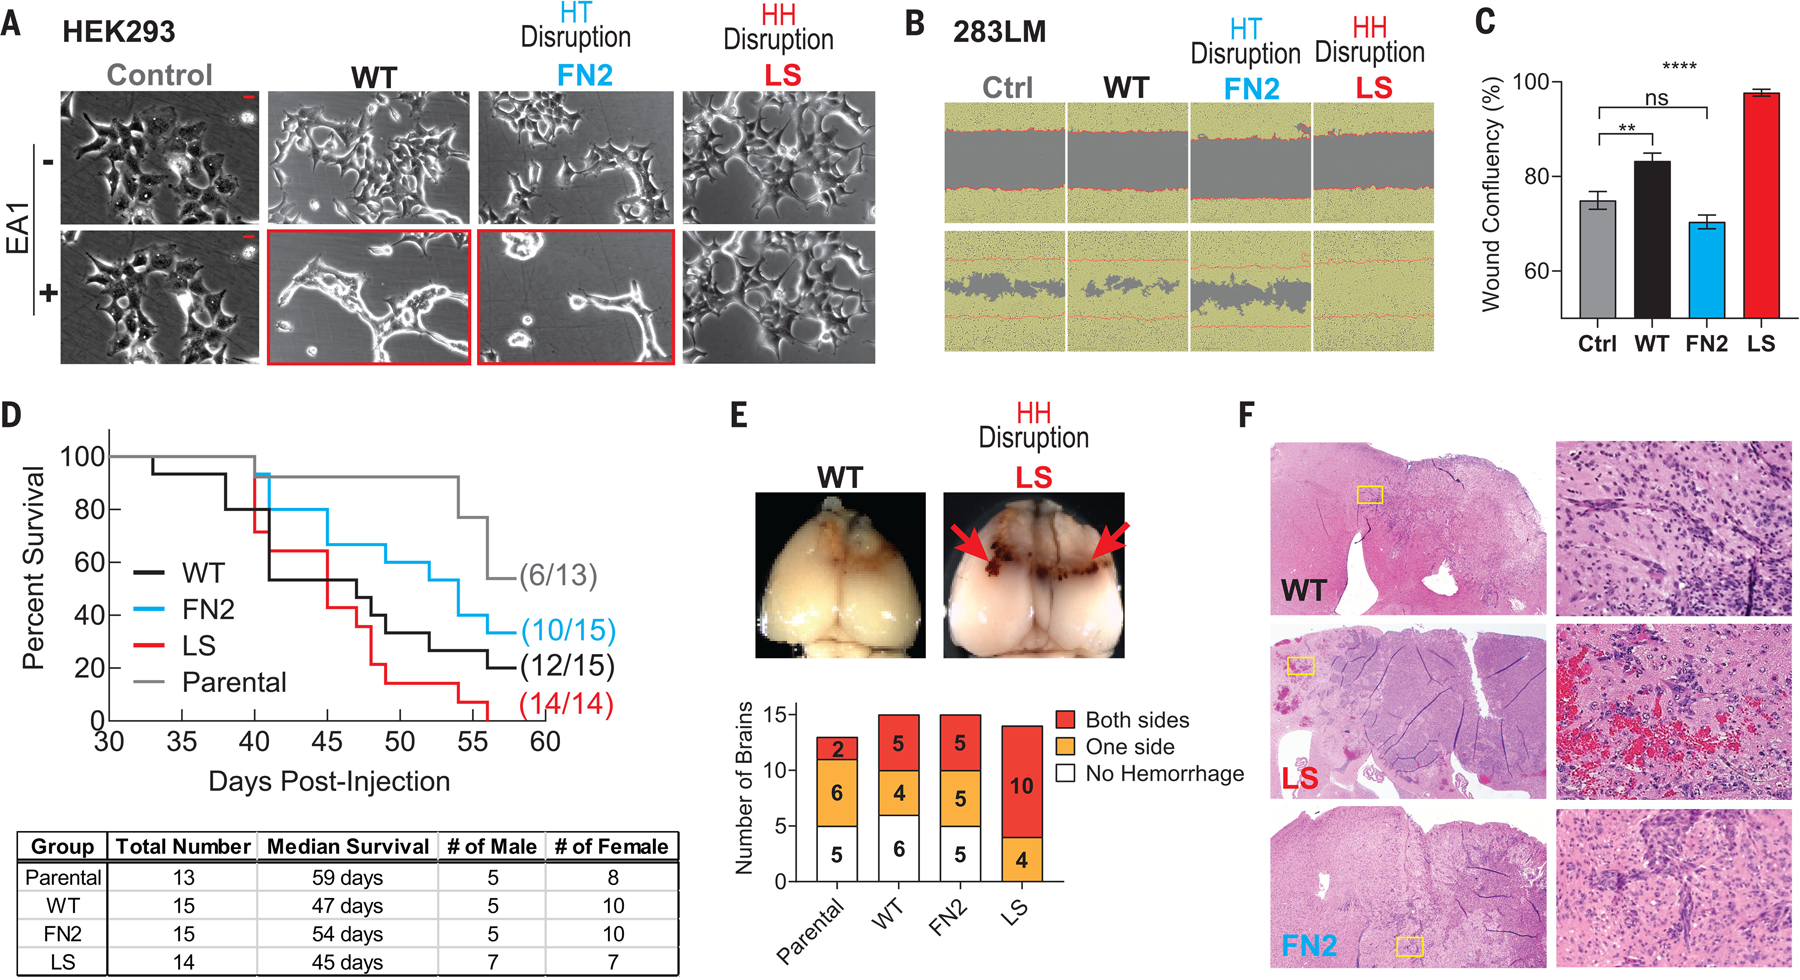
Ephrin type-A receptor 2 (EphA2) is a receptor tyrosine kinase that initiates both ligand-dependent tumor-suppressive and ligand-independent oncogenic signaling. We used time-resolved, live-cell fluorescence spectroscopy to show that the ligand-free EphA2 assembles into multimers driven by two types of intermolecular interactions in the ectodomain. The first type entails extended symmetric interactions required for ligand-induced receptor clustering and tumor-suppressive signaling that inhibits activity of the oncogenic extracellular signal-regulated kinase (ERK) and protein kinase B (AKT) protein kinases and suppresses cell migration. The second type is an asymmetric interaction between the amino terminus and the membrane proximal domain of the neighboring receptors, which supports oncogenic signaling and promotes migration in vitro and tumor invasiveness in vivo. Our results identify the molecular interactions that drive the formation of the EphA2 multimeric signaling clusters and reveal the pivotal role of EphA2 assembly in dictating its opposing functions in oncogenesis.


Conflict of interest statement

Competing interests: The authors declare that they have no competing interests.

Figures

Fig. 1.
Fig. 1.. Multimeric preassembly of ligand-free EphA2 detected by PIE-FCCS measurements.
(A) Schematic of the two-color PIE-FCCS instrument. Two pulsed lasers are focused on the peripheral membrane of a live COS7 cell (inset, epifluorescent image) that expresed GFP- or mCherry-tagged membrane receptors. Scale bar is 5 μm. APDs, avalanche photondiode detectors; TCSPC, time-correlated single photon counting. (B) Diagram of multiplexed readout of molecular dynamics of receptors in cell membranes from PIE-FCCS measurements. (C and D) Raw data, including fluorescence fluctuation signals (C) and decay of fluorescence lifetime of GFP (D), that were collected during PIE-FCCS measurements. au, arbitrary units; F(t), fluorescence signal at time t. (E) Autocorrelation (green and red) and cross-correlation (blue) functions of the fluorescence fluctuation signals, and three parameters obtained from the curves. Deff, effective diffusion coefficient; G(τ), normalized autocorrelation function of the fluorescence fluctuation; Gx, cross-correlation function; Gr, autocorrelation function of mCherry; Gg, autocorrelation function of GFP; τD, the lateral diffusion time within the confocal volume; ω, radius of the confocal volume. (F) Diagram of the fluorescence lifetime parameter, which indicates the C-terminal proximity within the protein oligomers. A shorter fluorescence lifetime of GFP is observed in oligomers with tight C-terminal assembly due to FRET. (G) Diagram of oligomerization control constructs. The monomeric control is a coexpression of fluorescent protein (FP, either GFP or mCherry), each fused separately to a c-Src membrane localization sequence (Myr-FP). The dimeric control has the leucine-zipper dimerization motif of GCN4 fused to GFP or mCherry and the c-Src membrane localization sequence (Myr-GCN4-FP). The multimeric control has the self-dimerizing kinase domain of EGFR introduced after the GCN4 motif (Myr-GCN4-EGFRk-FP). (H) Single-cell fc values for each of the control constructs taken concurrently with the EphA2 data. (I) Single-cell fc values of ligand-free EphA2 in the plasma membranes of three cell lines: COS7, DU145, and SCC728. The fc distributions from each cell line are similar to that of the multimer control, as indicated by the red horizontal bar. (J) Single-cell fc values of ephrin-A1 in the plasma membranes of COS7, which is close to zero, suggesting that ephrinA1 is mostly monomeric. In (H) to (J), the boxes represent third quartile, median, and first quartile, and the whiskers indicate the 10th to 90th percentile. The total cell number that was used for each sample is reported at the top of the box plots. Data were analyzed by one-way analysis of variance (ANOVA) test; ****p < 0.0001, and ns is not significant.
Fig. 2.
Fig. 2.. Multimerization of ligand-free EphA2 is mediated by HH and HT interfaces.
(A) Domain composition of the EphA2 receptor. The crystal structure of EphA2 ectodomain adapting HH contact through LDB-LBD and Sushi-Sushi interfaces is shown. Residues that mediate interactions are labeled. (B) fc values (left) and diffusion coefficients (right) of ligand-free EphA2 mutants that harbor a disruption at the HH interfaces. (C) Model of two ligand-free EphA2 molecules adapting HT contact through FN2 and LBD based on the crystal structure. Residues that mediate interactions are labeled. (D) fc values (left) and diffusion coefficients (right) of the ligand-free EphA2 mutant FN2, with disruption of the HT LBD-FN2 contact. (E) fc values (left) and diffusion coefficients (right) of the ligand-free EphA2 mutant LSF, with disruptions at both the HH and HT contacts. (F to H) fc values (top) and diffusion coefficients (bottom) of mEA1-stimulated EphA2 mutants with disruption at the HH interfaces (F), at the HT contact (G), and at both contacts (H). (I) Schematic diagram of the molecular assemblies of WT EphA2 (black box) and mutants that have disruption at HT (blue box), HH (red box), and both contacts (purple box). This diagram does not represent the exact numbers of EphA2 molecules in the molecular assemblies. In (B) and (D) to (H), the apparent diffusion coefficients are summarized in bar graphs and report the mean and SEM values. In the box plots, boxes represent third quartile, median, and first quartile, and the whiskers indicate the 10th to 90th percentile. Data were analyzed by one-way ANOVA and two-tail t tests; ****p < 0.0001, ***p < 0.001, **p < 0.01, *p < 0.05, and ns is not significant.
Fig. 3.
Fig. 3.. HH and HT contacts modulate signaling and endocytosis of EphA2.
(A) EphA2 constructs expressed in SCC728 cells were stimulated with EA1-Fc (3 μg/ml) for 15 and 60 min and were then lysed. Whole-cell lysates (WCLs) were subjected to immunoblotting with the indicated antibodies. Controls were the untreated cells marked as 0 min. (B) FRET efficiency of EphA2 constructs before and after treatment of cells with ligand. The total cell number that was used for each sample is reported at the top of the box plots. Boxes represent third quartile, median, and first quartile, and the whiskers indicate the 10th to 90th percentile. Data were analyzed by two-tail t test; ****p < 0.0001, and ns is not significant. (C) Schematic diagram of signaling and changes in kinase proximity of WT, FN2, and LS EphA2. pS, phosphorylated Ser; pY, phosphorylated Tyr. (D) Confocal images of GSC827 cells expressing EphA2-GFP (green) and stained for Rab5 (magenta). The nucleus was stained with 4′,6-diamidino-2-phenylindole (DAPI) (blue). Separated images of EphA2 constructs and Rab5 proteins are shown in inverted format. Merged images of the cells are shown in color. White features indicate the colocalization of EphA2 and Rab5. All scale bars are 5 μm.
Fig. 4.
Fig. 4.. HH and HT contacts of EphA2 modulate cell migration in vitro and invasion in vivo.
(A) Sample phase-contrast images of HEK293 cells expressing WT or mutant EphA2 at 0 (−) and 20 (+) min after ligand stimulation. Zero time points represent untreated controls. Note that cell rounding occurred in WT- and FN2-expressing cells (highlighted with red boxes) but not in LS-expressing cells. A total of three independent experiments were performed. Scale bars are 5 μm. (B) Scratch-wound assay using EphA2 knockout 283LM cells restored with the WT or mutant receptors. Sample phase-contrast images at 0 hours (top) and 16 hours (bottom) are shown. The yellow masks define the area covered with cells. The red lines demarcate the starting margins of the wound areas. (C) Wound confluency at 16 hours. The wound confluency is summarized in a bar graph to report the mean value and SEM. A total of 12 wounds were used for each group, and a total of three independent experiments were performed. Data were analyzed by one-way ANOVA test; ****p < 0.0001, **p < 0.01, and ns is not significant. (D) Kaplan-Meier survival curve (top) of mice injected intracranially with 1816 cells expressing WT EphA2 or the indicated mutant EphA2. A table showing the number, sex, and median survival of mice is shown at the bottom. (E) Representative whole-mount brain images are shown at the top. Arrows point to regions of hemorrhage. The numbers of mice with brain hemorrhage and its hemispheric distribution, on the basis of gross examination of the whole brain, are shown at the bottom. (F) Histology analysis of mouse brains. Low-power views of the brain are shown on the left; corresponding magnified views of the indicated regions are shown on the right.
Fig. 5.
Fig. 5.. Schematic depictions of the molecular assembly of EphA2 on the cell surface.
(A) Multimeric assembly EphA2 in the absence of ligands. (B) Ligand-induced conformational changes of EphA2, including 71° rotation of the FN2 domain relative to the rest of the Eph ECD. (C) Rearrangement of the kinase domains into close proximity for transphosphorylation on tyrosine residues. (D) Lateral condensation into large EphA2-ephrin higher-order clusters accompanied by activation of canonical signaling and suppression of noncanonical signaling. See text for more details.

References

    1. Kania A, Klein R, Nat. Rev. Mol. Cell Biol 17, 240–256 (2016). - PubMed
    1. Wilkinson DG, Nat. Rev. Neurosci. 2, 155–164 (2001). - PubMed
    1. Pasquale EB, Cell 133, 38–52 (2008). - PubMed
    1. Wykosky J, Debinski W, Mol. Cancer Res. 6, 1795–1806 (2008). - PMC - PubMed
    1. Pasquale EB, Nat. Rev. Cancer 10, 165–180 (2010). - PMC - PubMed