. 2024 Jan;11(3):e2306535.
doi: 10.1002/advs.202306535. Epub 2023 Nov 16.

HSPA8 Activates Wnt/β-Catenin Signaling to Facilitate BRAF V600E Colorectal Cancer Progression by CMA-Mediated CAV1 Degradation

Affiliations

HSPA8 Activates Wnt/β-Catenin Signaling to Facilitate BRAF V600E Colorectal Cancer Progression by CMA-Mediated CAV1 Degradation

Bowen Li et al. Adv Sci (Weinh). 2024 Jan.

Abstract

BRAF V600E attracts wide attention in the treatment of colorectal cancer (CRC) as stratifying and predicting a refractory classification of CRC. Recent evidence indicates that Wnt/β-catenin signaling is broadly activated and participates in the refractoriness of BRAF V600E CRC, but the underlying molecular mechanism needs to be elucidated. Here, heat shock 70 kDa protein 8 (HSPA8), an essential regulator in chaperone-mediated autophagy (CMA), is identified as a potential therapeutic target for advanced BRAF V600E CRC. These results show that HSPA8 is transcriptionally upregulated in BRAF V600E CRC, which promotes CMA-dependent degradation of caveolin-1 (CAV1) to release β-catenin into the nucleus and thus activates the Wnt/β-catenin pathway, contributing to metastasis and progression of BRAF V600E CRC. Of note, HSPA8 directly interacts with the KIFSN motif on CAV1, the interaction can be enhanced by p38 MAPK-mediated CAV1 S168 phosphorylation. Furthermore, pharmacological targeting HSPA8 by VER155008 exhibits synergistic effects with BRAF inhibitors on CRC mouse models. In summary, these findings discover the important role of the HSPA8/CAV1/β-catenin axis in the development of refractory BRAF V600E CRC and highlight HSPA8 as a predictive biomarker and therapeutic target in clinical practice.

Keywords: BRAF V600E; Wnt/β-catenin; drug resistance; epithelial-mesenchymal transition; heat shock 70 kDa protein 8.


Conflict of interest statement

The authors declare no conflict of interest.

Figures
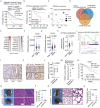
Figure 1
Figure 1
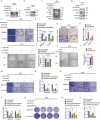
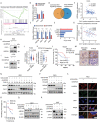
Elevated HSPA8 expression in human colorectal cancer with BRAF V600E mutation. A) Overall survival of CRC patients with no mutation, V600E mutation, or other mutations in BRAF according to a metastatic colorectal cancer dataset (MSKCC, Cancer cell, 2018). B) Overall survival of CRC patients with no mutation or V600E mutation in BRAF according to the CTPAC‐2 perspective dataset. C) Gene set enrichment analysis (GSEA) of the GEO dataset GSE98314 between groups with and without the treatment of BRAF inhibitor using the GOCC enrichment. The vertical axis represents the gene set size, and the horizontal represents normalized enrichment score (NES) (The top ten enriched pathways are represented in a scatter plot). D) Venn group designations showing that 16 genes were enriched in the GSE98314 GOCC_AUTOPHAGOSOME gene set, TCGA BRAF co‐expression genes, and chEMBL drug target gene set. E) Evaluation of the candidate genes involved in BRAF V600E targeted drug treatment based on dataset GSE98314. F–H) HSPA8 mRNA levels in CRC patients with or without BRAF V600E mutation according to TCGA, CCLE, or CTPAC‐2 perspective dataset (Student's t test). I) Gene set enrichment analysis (GSEA) of the KEGG MAPK signaling pathway was performed in the RKO and RKO shHSPA8 groups. J) Representative images of HSPA8 immunohistochemical staining in the normal colon (adjacent tissue), transition area, and cancerous colon. Scale bar: 100 µm. K) Representative images of HSPA8 immunohistochemical staining in primary (n = 25) or metastatic sites (n = 15) of CRC. Scale bar: 100 µm (above), 25 µm (below). L) Statistical quantification of HSPA8 immunohistochemical staining in primary or metastatic sites of CRC (P = 0.0458, Student's t test). M) HSPA8 mRNA levels in primary or metastatic sites of CRC patients according to the Oncomine dataset Ramaswamy Multi‐cancer (P = 0.0156, Student's t test). N) Overall survival of CRC patients according to the HSPA8 mRNA levels in TCGA dataset (P = 0.0047, log‐rank [Mantel‐Cox] test). O) Representative images of liver metastatic nodules and H&E staining of RKO (BRAF V600E)‐derived orthotopic colorectal cancer model. Scale bar: 50 mm (left), 50 µm (medium), 10 µm (right). P) Statistical quantification of liver metastatic nodule number. Q) Representative images of lung metastatic area and H&E staining of mouse tissues. Scale bar: 25 mm (left), 50 µm (medium), 10 µm (right). R) Statistical quantification of lung metastatic area of the tail vein injection mice model.
Figure 2
Figure 2
HSPA8 promotes epithelial‐mesenchymal transition in BRAF V600E CRC cells. A) Immunoblotting analysis of RKO cells stably expressing shScramble, shHSPA8, or shHSPA8+OE‐HSPA8. B) Immunoblotting analysis of HT29 cells stably expressing vector or HSPA8. C,D) Immunoblotting analysis of the effects of HSPA8 on the expression of EMT marker proteins in RKO and HT29 cells. E–H) Transwell assay showing the migration and invasion ability of RKO cells transfected with shScramble, shHSPA8, or shHSPA8+OE‐HSPA8 and HT29 cells stably expressing vector or HSPA8. Scale bar: 100 µm. I–L) Wound healing assay showing the migration of RKO cells transfected with shScramble, shHSPA8, or shHSPA8+OE‐HSPA8 and HT29 cells stably expressing vector or HSPA8 after 24 h. Scale bar: 200 µm. M–P) Transwell assays showing the effects of HSPA8 and Dabrafenib/Encorafenib on cell migration and invasion. Scale bar: 100 µm. Q–S) Representative images of the colony formation of the indicated cells and quantification of clone numbers. ***P < 0.001, **P < 0.01, *P < 0.05, and data are the mean ± SEM from at least three independent experiments.
Figure 3
Figure 3
HSPA8 activates Wnt/β‐catenin pathway though CMA‐mediated CAV1 degradation. A) GSEA of the KEGG Wnt signaling pathway was performed in the RKO WT and RKO shHSPA8 groups. B) The relative luciferase activity in control cells transfected with FOP‐flash and TOP‐flash vectors and cells transfected with shscramble and shHSPA8 is shown. C) Real‐time qPCR analysis was performed to examine the mRNA expression levels (mean ± SEM) of canonical Wnt/β‐catenin signaling components. D) Venn diagram showing that five genes enriched in the canonical Wnt signaling pathway gene set and CCLE HSPA8‐related gene set. E) Validation of the correlation between candidate genes and HSPA8. F,G) HSPA8 expression levels showed a negative correlation with CAV1 expression levels according to the CCLE and cBioportal dataset CTPAC‐2 perspective (Pearson correlation test). H) Immunoblotting analysis of CAV1 expression in RKO cells stably expressing shScramble or shHSPA8. I) Immunoblotting analysis of CAV1 expression in HT29 cells stably expressing Vector or OE‐HSPA8. J,K) CAV1 mRNA levels in patients with BRAF WT or BRAF V600E mutation in TCGA or CTPAC‐2 perspective datasets (Student's t test). L) Overall survival of CRC patients according to TCGA dataset (P = 0.0179, log‐rank [Mantel–Cox] test). M) Representative images of HSPA8 and CAV1 immunohistochemical staining in liver metastatic nodules of mouse tissues, scale bar: 50 µm (left), 5 µm (right). N,O) Immunoblotting analysis of RKO cells stably expressing shScramble or shHSPA8 (80% to 90% confluent) treated with 100 µg mL−1 CHX or solvent. Statistical quantification of CAV1 expression at different time points. P) Immunoblotting analysis of RKO cells stably expressing shScramble or shHSPA8 treated with 5 µm, 10 µm CQ or solvent. Q) Immunoblotting analysis of RKO cells stably expressing shScramble or shHSPA8 treated with 10/20 µm QX77 or solvent. R) Immunoblotting analysis of HEK293T cells stably expressing shScramble or shHSPA8 treated with siNC or siLAMP2A. S) Immunofluorescence assays display colocalization between CAV1 and LAMP2A with or without HSPA8 knockdown. Scale bar: 10 µm (top and middle), 2 µm (bottom). ***P < 0.001, **P < 0.01, and data are the mean ± SEM from at least three independent experiments.
Figure 4
Figure 4
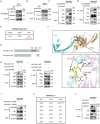
HSPA8 interacts with CAV‐1 through the KIFSN motif. A,B) The interaction between HSPA8 and CAV1 in RKO cells was determined by co‐IP assays. C,D) The interaction between myc‐HSPA8 and HA‐CAV1 in HEK293T cells was determined by co‐IP assays. E) KFERQ‐like motifs within the protein sequence of CAV1 were identified using KFERQ finder software v0.8. F) Molecular docking of 3D structures predicts the binding of the CAV1 KIFSN motif (yellow) with HSPA8. G) A schematic representation of HA‐CAV1 with full length (WT) and KIFSN motif deletion (Del). H,I) The interaction between myc‐HSPA8 and HA‐CAV1 (WT or Del) in HEK293T cells was determined by co‐IP assays. J) The interaction between HSPA8 and HA‐CAV1 with the S168A or S168D mutation in HEK293T cells was determined by co‐IP assays. K) Potential kinases to phosphorylate the CAV1 S168 site predicted by NetPhos 3.1. L) The interaction between HA‐CAV1 and p38 in HEK293T cells transfected with siNC or siMAPK14 was determined by co‐IP assays.
Figure 5
Figure 5
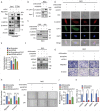
HSPA8 activates EMT by abrogating CAV1‐mediated inhibition of the β‐catenin/Wnt pathway in BRAF V600E CRC cells. A) The interactions between CAV1 and several proteins, including LAMP2A, β‐catenin, and LC3, in HEK293T cells were determined by co‐IP assays. B) The interaction between CAV1 and β‐catenin in RKO cells stably expressing shScramble or shHSPA8 was determined by co‐IP assays. C) Immunoblotting analysis of β‐catenin protein expression in the cytoplasm or nucleus in RKO cells stably expressing shScramble or shHSPA8. GAPDH is used as cytoplasmic marker and Histone 3 (H3) is a nuclear marker. D,E) Immunofluorescence assays display the subcellular localization of β‐catenin in RKO cells transfected with shScramble, shHSPA8, shScramble+siCAV1, or shHSPA8+siCAV1. Scale bar: 10 µm. F) Immunoblotting analysis of the expression of HSPA8, CAV1, and ZO‐1 in RKO cells transfected with shScramble, shHSPA8, shScramble+siCAV1, or shHSPA8+siCAV1. G,H) Transwell assays showing the cell migration and invasion of RKO cells transfected with shScramble, shHSPA8, or shHSPA8+siCAV1. Scale bar: 100 µm. I,J) Wound healing assay showing the migration of RKO cells transfected with shScramble, shHSPA8, or shHSPA8+siCAV1 after 24 h. Scale bar: 200 µm. K) Real‐time qPCR analysis was performed to examine the mRNA expression levels (mean ± SEM) of MMPs in RKO cells stably expressing shScramble or shHSPA8. ***P < 0.001, **P < 0.01, *P < 0.05, and data are the mean ± SEM from at least three independent experiments.
Figure 6
Figure 6
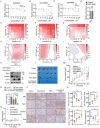
The HSPA8 inhibitor VER155008 showed a synergistic effect with the BRAF inhibitors in BRAF V600E CRC. A–D) Cell viability assay of RKO cells treated with VER155008 (5 µm), with the indicated concentration of Dabrafenib, Encorafenib, or Agerafenib for 24 h. E–J) The drug combination dose‐response matrices of VER155008 with Dabrafenib, Encorafenib, or Agerafenib in RKO cells. The drug interaction landscapes were calculated based on the ZIP model. K) Immunoblotting assays for HSPA8, CAV1, and EMT marker proteins levels in RKO cells treated with solvent, VER155008, Encorafenib, or VER155008+Encorafenib. L) Representative images of isolated tumors. Scale bar: 1 cm. M) The volume of tumors from each group (5 mice per group) was measured at the indicated time points. N) Tumor weight from each group (5 mice per group) was measured. O) The body weight of mice in each group was measured at the indicated time points. P,Q) Representative immunohistochemistry images of tumors treated with or without VER155008 or Encorafenib. The expression score of Ki67, CAV1, Claudin‐1, and Slug were calculated. Scale bar: 200 µm. ***P < 0.001, **P < 0.01, *P < 0.05, and data are the mean ± SEM from at least three independent experiments.

References

    1. Sung H., Ferlay J., Siegel R. L., Laversanne M., Soerjomataram I., Jemal A., Bray F., CA Cancer J Clin 2021, 71, 209. - PubMed
    1. Siegel R. L., Miller K. D., Fuchs H. E., Jemal A., CA Cancer J Clin 2021, 71, 7. - PubMed
    1. Grothey A., Fakih M., Tabernero J., Ann. Oncol. 2021, 32, 959. - PubMed
    1. Prahallad A., Sun C., Huang S., Di Nicolantonio F., Salazar R., Zecchin D., Beijersbergen R. L., Bardelli A., Bernards R., Nature 2012, 483, 100. - PubMed
    1. a) Corcoran R. B., Ebi H., Turke A. B., Coffee E. M., Nishino M., Cogdill A. P., Brown R. D., Pelle P. D., Dias‐Santagata D., Hung K. E., Flaherty K. T., Piris A., Wargo J. A., Settleman J., Mino‐Kenudson M., Engelman J. A., Cancer Discovery 2012, 2, 227; - PMC - PubMed
    2. b) Yaeger R., Corcoran R. B., Cancer Discovery 2019, 9, 329. - PMC - PubMed

Publication types

MeSH terms

LinkOut - more resources