

TET1 Participates in Complete Freund's Adjuvant-induced Trigeminal Inflammatory Pain by Regulating Kv7.2 in a Mouse Model
- PMID: 37973721
- PMCID: PMC11178721
- DOI: 10.1007/s12264-023-01139-1
TET1 Participates in Complete Freund's Adjuvant-induced Trigeminal Inflammatory Pain by Regulating Kv7.2 in a Mouse Model
Abstract
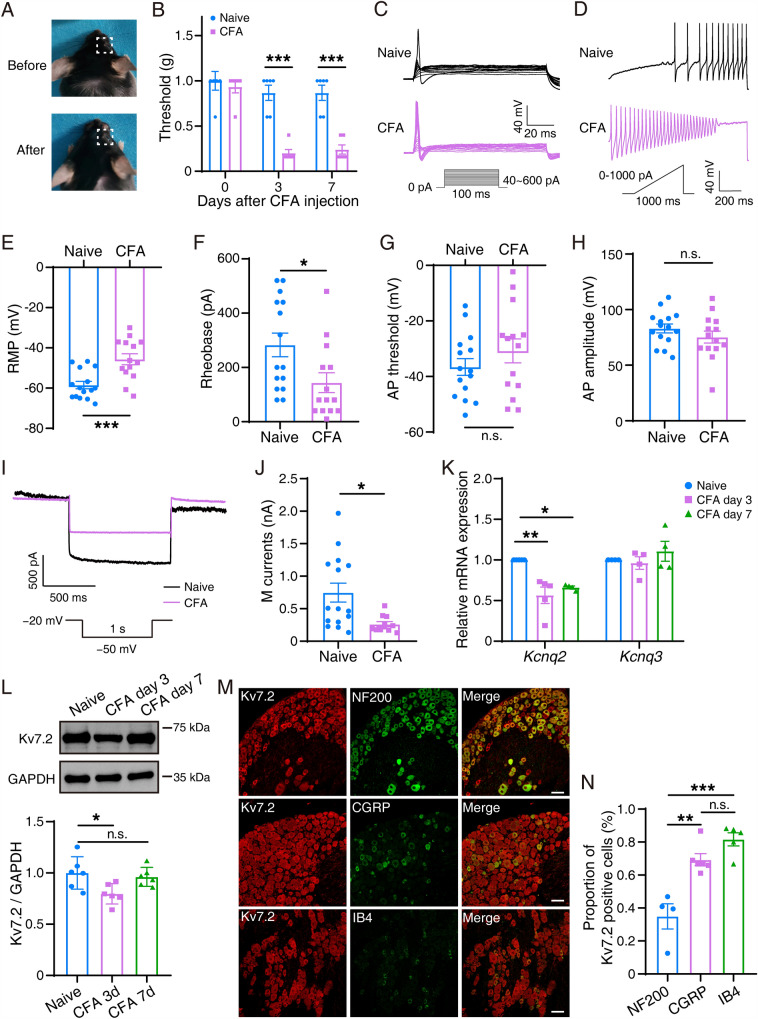
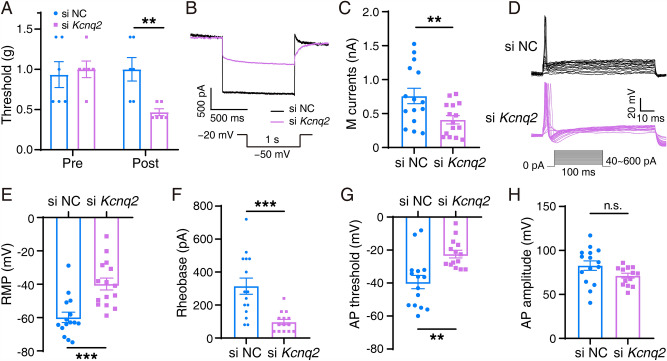
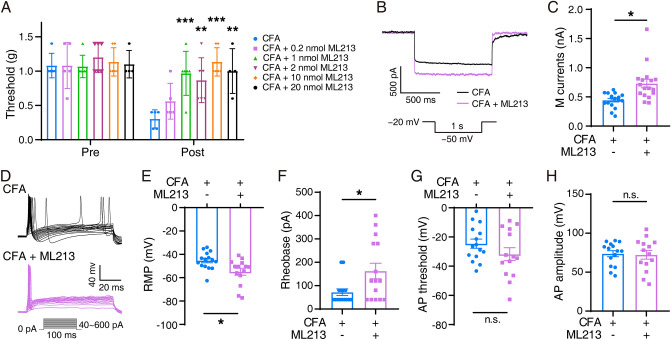
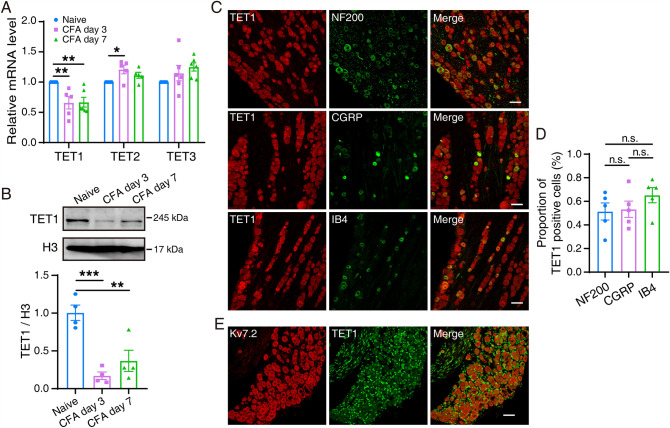
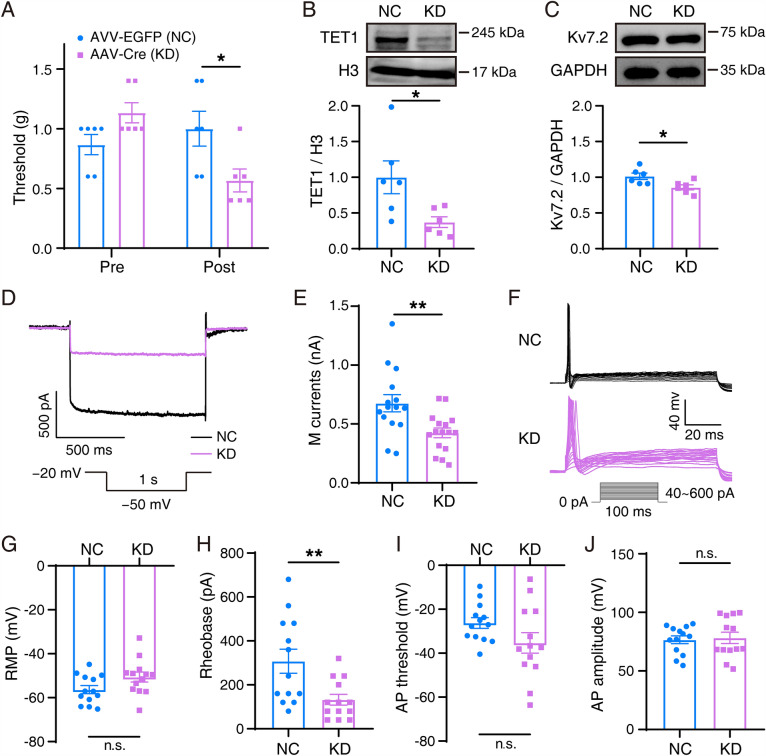
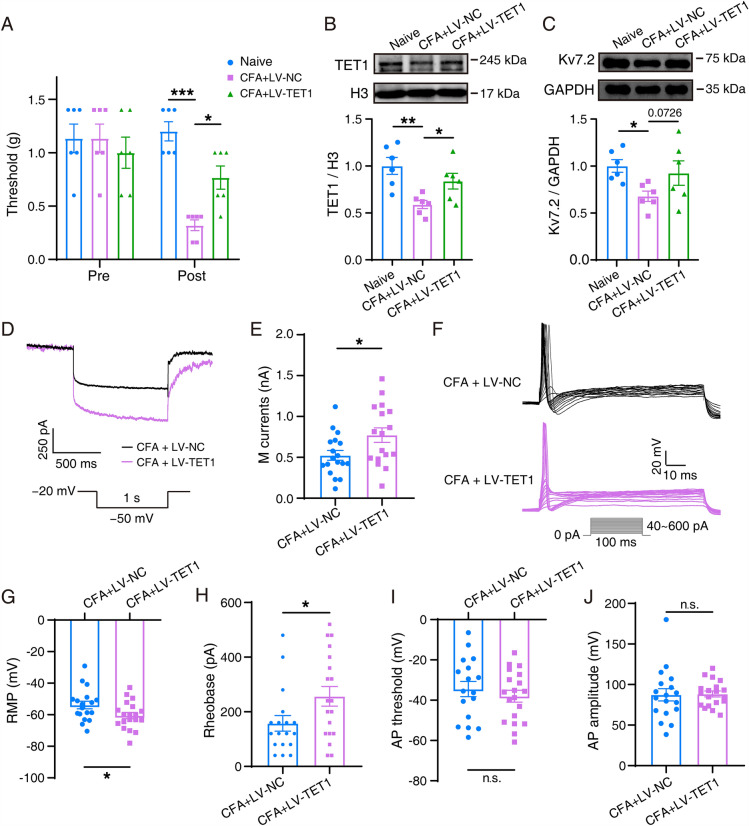
Trigeminal inflammatory pain is one of the most severe pain-related disorders in humans; however, the underlying mechanisms remain largely unknown. In this study, we investigated the possible contribution of interaction between ten-eleven translocation methylcytosine dioxygenase 1 (TET1) and the voltage-gated K+ channel Kv7.2 (encoded by Kcnq2) to orofacial inflammatory pain in mice. We found that complete Freund's adjuvant (CFA) injection reduced the expression of Kcnq2/Kv7.2 in the trigeminal ganglion (TG) and induced orofacial inflammatory pain. The involvement of Kv7.2 in CFA-induced orofacial pain was further confirmed by Kv7.2 knockdown or overexpression. Moreover, TET1 knockdown in Tet1flox/flox mice significantly reduced the expression of Kv7.2 and M currents in the TG and led to pain-like behaviors. Conversely, TET1 overexpression by lentivirus rescued the CFA-induced decreases of Kcnq2 and M currents and alleviated mechanical allodynia. Our data suggest that TET1 is implicated in CFA-induced trigeminal inflammatory pain by positively regulating Kv7.2 in TG neurons.
Keywords: Facial pain; KCNQ2 potassium channel; TET1 protein.
© 2023. Center for Excellence in Brain Science and Intelligence Technology, Chinese Academy of Sciences.
Conflict of interest statement
All authors claim that there are no conflicts of interest.
Figures
Similar articles
-
Chemokine CCL12 in trigeminal ganglion contributes to CFA-induced mechanical allodynia in mice.Neuroscience. 2025 Aug 6;580:115-123. doi: 10.1016/j.neuroscience.2025.06.026. Epub 2025 Jun 13. Neuroscience. 2025. PMID: 40517940
-
TET1-mediated epigenetic regulation of tumor necrosis factor-α in trigeminal ganglia contributes to chronic temporomandibular joint pain.Life Sci. 2024 Jan 1;336:122283. doi: 10.1016/j.lfs.2023.122283. Epub 2023 Nov 20. Life Sci. 2024. PMID: 37993094
-
Role of KCNQ2 channels in orofacial cold sensitivity: KCNQ2 upregulation in trigeminal ganglion neurons after infraorbital nerve chronic constrictive injury.Neurosci Lett. 2018 Jan 18;664:84-90. doi: 10.1016/j.neulet.2017.11.026. Epub 2017 Nov 10. Neurosci Lett. 2018. PMID: 29133175 Free PMC article.
-
Alternation of gene expression in trigeminal ganglion neurons following complete Freund's adjuvant or capsaicin injection into the rat face.J Mol Neurosci. 2010 Oct;42(2):200-9. doi: 10.1007/s12031-010-9348-7. Epub 2010 Mar 28. J Mol Neurosci. 2010. PMID: 20349343
-
A potent and selective calcitonin gene-related peptide (CGRP) receptor antagonist, MK-8825, inhibits responses to nociceptive trigeminal activation: Role of CGRP in orofacial pain.Exp Neurol. 2015 Sep;271:95-103. doi: 10.1016/j.expneurol.2015.05.005. Epub 2015 May 14. Exp Neurol. 2015. PMID: 25981890
Cited by
-
Post-Traumatic Trigeminal Neuropathy: Neurobiology and Pathophysiology.Biology (Basel). 2024 Mar 4;13(3):167. doi: 10.3390/biology13030167. Biology (Basel). 2024. PMID: 38534437 Free PMC article. Review.
-
TET1 participates in oxaliplatin-induced neuropathic pain by regulating microRNA-30b/Nav1.6.J Biol Chem. 2025 Mar;301(3):108228. doi: 10.1016/j.jbc.2025.108228. Epub 2025 Jan 27. J Biol Chem. 2025. PMID: 39864621 Free PMC article.
-
Galangin, a novel Kv7 potassium channel opener, exerts potent antinociceptive effects in multiple chronic pain mouse models.Acta Pharmacol Sin. 2025 Aug 7. doi: 10.1038/s41401-025-01627-2. Online ahead of print. Acta Pharmacol Sin. 2025. PMID: 40775535
-
Advances in the pathological mechanisms and clinical treatments of chronic visceral pain.Mol Pain. 2024 Jan-Dec;20:17448069241305942. doi: 10.1177/17448069241305942. Mol Pain. 2024. PMID: 39673493 Free PMC article. Review.
References
-
- Horst OV, Cunha-Cruz J, Zhou L, Manning W, Mancl L, DeRouen TA. Prevalence of pain in the orofacial regions in patients visiting general dentists in the Northwest Practice-based REsearch Collaborative in Evidence-based DENTistry research network. J Am Dent Assoc. 2015;146:721–728.e3. doi: 10.1016/j.adaj.2015.04.001. - DOI - PMC - PubMed
-
- Headache Classification Committee of the International Headache Society (IHS). The International Classification of Headache Disorders, 3rd edition (beta version). Cephalalgia 2013, 33: 629–808. - PubMed
MeSH terms
Substances
LinkOut - more resources
Full Text Sources
Molecular Biology Databases
Miscellaneous
