. 2023 Nov 16;14(1):7417.
doi: 10.1038/s41467-023-43279-y.

Infant microbiome cultivation and metagenomic analysis reveal Bifidobacterium 2'-fucosyllactose utilization can be facilitated by coexisting species

Affiliations

Infant microbiome cultivation and metagenomic analysis reveal Bifidobacterium 2'-fucosyllactose utilization can be facilitated by coexisting species

Yue Clare Lou et al. Nat Commun. .

Abstract

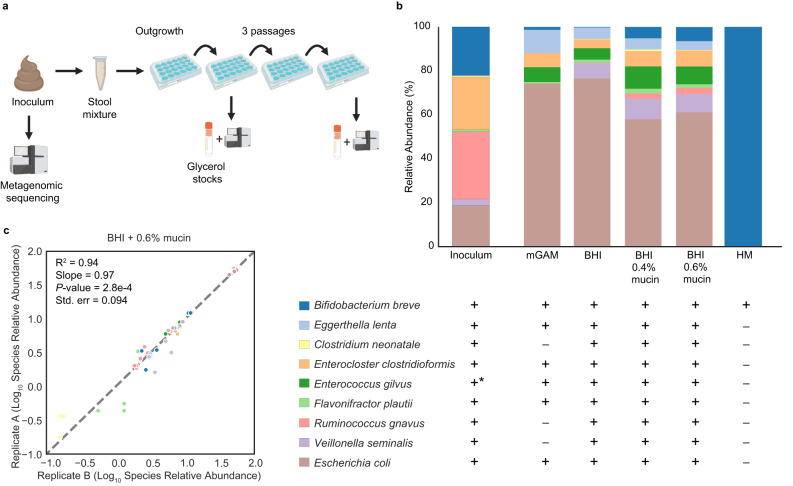
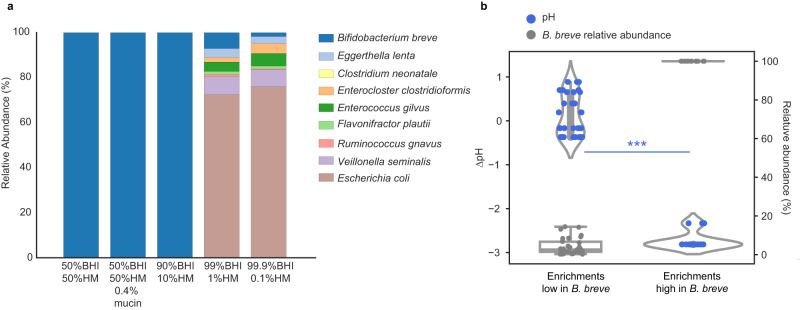
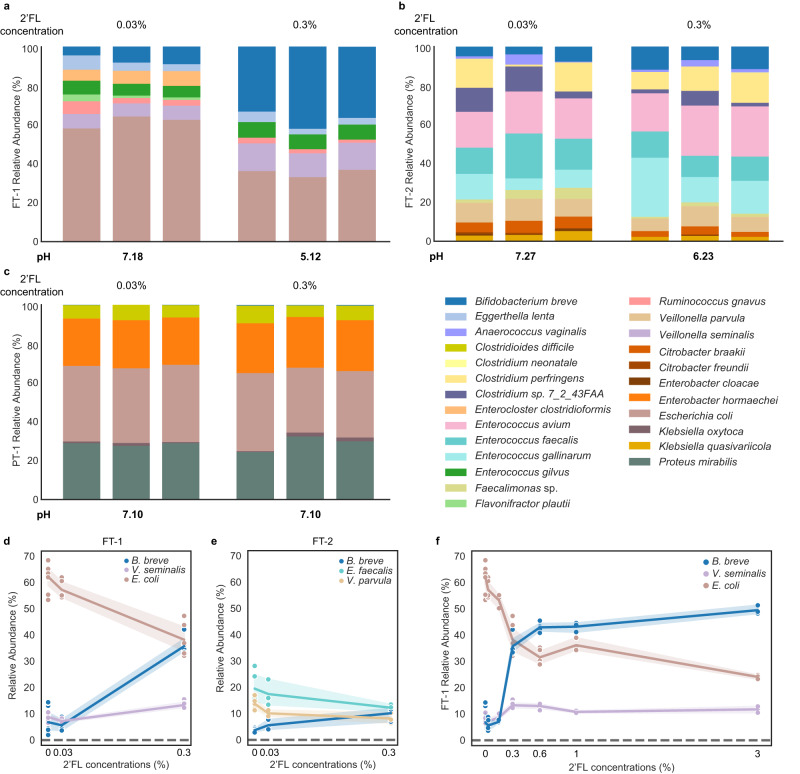
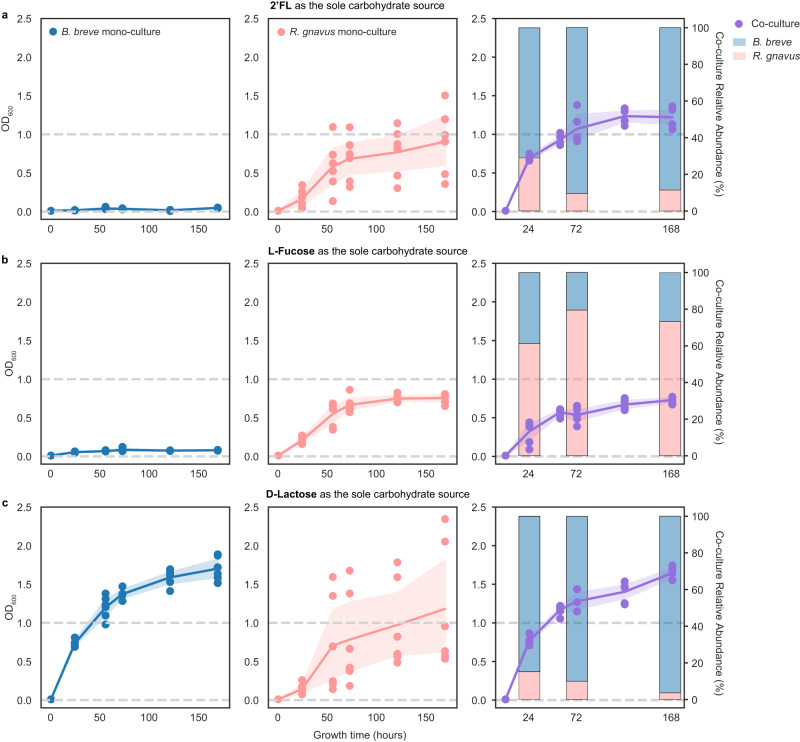
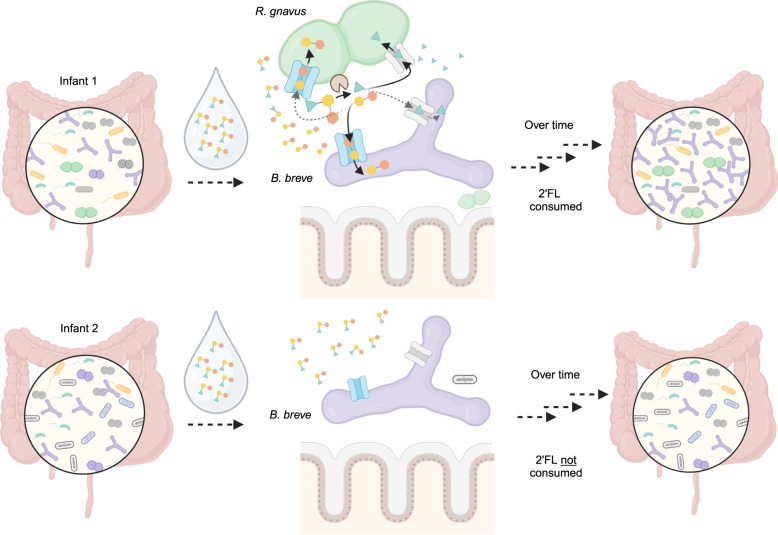
The early-life gut microbiome development has long-term health impacts and can be influenced by factors such as infant diet. Human milk oligosaccharides (HMOs), an essential component of breast milk that can only be metabolized by some beneficial gut microorganisms, ensure proper gut microbiome establishment and infant development. However, how HMOs are metabolized by gut microbiomes is not fully elucidated. Isolate studies have revealed the genetic basis for HMO metabolism, but they exclude the possibility of HMO assimilation via synergistic interactions involving multiple organisms. Here, we investigate microbiome responses to 2'-fucosyllactose (2'FL), a prevalent HMO and a common infant formula additive, by establishing individualized microbiomes using fecal samples from three infants as the inocula. Bifidobacterium breve, a prominent member of infant microbiomes, typically cannot metabolize 2'FL. Using metagenomic data, we predict that extracellular fucosidases encoded by co-existing members such as Ruminococcus gnavus initiate 2'FL breakdown, thus critical for B. breve's growth. Using both targeted co-cultures and by supplementation of R. gnavus into one microbiome, we show that R. gnavus can promote extensive growth of B. breve through the release of lactose from 2'FL. Overall, microbiome cultivation combined with genome-resolved metagenomics demonstrates that HMO utilization can vary with an individual's microbiome.


Conflict of interest statement

The Regents of the University of California have a patent pending related to this work on which Y.C.L., B.E.R., A.L.B., and J.F.B. are inventors. J.F.B. is a co-founder of Metagenomi. J.A.D. is a co-founder of Caribou Biosciences, Editas Medicine, Scribe Therapeutics, Intellia Therapeutics, and Mammoth Biosciences. J.A.D. is a scientific advisory board member of Vertex, Caribou Biosciences, Intellia Therapeutics, Scribe Therapeutics, Mammoth Biosciences, The Column Group, and Inari. J.A.D. is a Director at Johnson & Johnson, Altos Labs, and Tempus and has research projects sponsored by AppleTree Partners and Roche. B.E.R. is a shareholder of Caribou Biosciences, Intellia Therapeutics, Locus Biosciences, Inari, TreeCo, and Ancilia Biosciences. The authors declare no competing interests.

Figures

Fig. 1
Fig. 1. FT-1 microbiome cultivation overview.
a Microbiome cultivation experimental setup. The frozen pilot infant fecal sample was resuspended in a phosphate-buffered saline (PBS) solution before inoculating it into anaerobic media. After an initial 48-hour outgrowth period, the enrichments were subsequently passaged every 48 h for a total of three passages. A fraction of the enrichment was harvested from the 1st and the 3rd passaged enrichments for metagenomic sequencing and long-term storage. Figure created with BioRender. b Microbiome compositions grown on different complex media after one passage. Bar height represents normalized species relative abundance, and bars are colored by species. The x-axis represents the growth media, and the data are the averages of all replicates. One biological set (n = 3) was run for modified Gifu anaerobic medium (mGAM), brain–heart infusion (BHI), and human breast milk (HM). Three and four independent biological replicates (n = 2 or 3 for each independent experiment) were run for BHI + 0.4% mucin and BHI + 0.6% mucin, respectively. “+” and “−” represent the presence and absence, respectively, of the organism detected in the initial FT-1 inoculum. “*” indicates E. gilvus was below the detection limit in the initial inoculum and its presence was detected through cultivating in non-HM-rich media. c Pairwise species relative abundance comparison among technical replicates. Correlations were calculated using the two-sided linear least-squares regression. Only species in both technical replicates were considered when calculating correlation metrics (R2, slope, P-value, and standard error). Source data are provided as a Source Data file.
Fig. 2
Fig. 2. HM poses strong selective pressures on FT-1.
a Community compositions grown on HM-supplemented media with one passage. Bar height represents normalized species relative abundance, and bars are colored by species. The x-axis represents the growth media, and the data are averages of the replicates (n = 3). b Correlation between the change of pH (∆pH) and B. breve abundance for samples grown on HM-supplemented media with one passage. The left y-axis represents the change in pH (∆pH), and the right y-axis represents the relative abundance of B. breve. Each circle represents a culture replicate and is colored by either ∆pH (blue) or B. breve abundance in that culture (gray). The x-axis represents the community type, either dominated (n = 16 technical replicates from 6 independent experiments) or not dominated (n = 30 technical replicates from 11 independent experiments) by B. breve (***P = 1.92e−11; Wilcoxon rank sum test). The box plot shows the interquartile range (IQR) of B. breve relative abundances in different growth media with the central line representing the median; the whiskers extend from the lower and upper quartiles to 1.5 times the IQR. Similarly, the violin plot shows the distribution of ∆pH in cultures enriched or depleted with B. breve; the inner box shows the IQR. Source data are provided as a Source Data file.
Fig. 3
Fig. 3. 2’FL supplementation resulted in distinct responses from different infant gut microbiomes.
ac The compositions of the FT-1 (a), FT-2 (b), and PT-1 (c) enrichments grown in BHI-mucin supplemented with 0.03% and 0.3% 2’FL with one passage. Bar height represents normalized species relative abundance, and bars are colored by species. The x-axis represents the growth media, and all replicates are shown (n = 3). The pH of each enrichment is the mean across the three replicates. The figure legend is shown on the bottom right of the figure panel. d, e The significant enrichment or depletion of FT-1 (d) and FT-2 (e) species cultured in different 2’FL concentrations (0, 0.03%, and 0.3%) with one passage. Each circle represents a species whose abundance changed significantly in different 2’FL concentrations (Spearman correlation |r| ≥ 0.8 and q < 0.05; Supplementary Table 2), and the line represents the average of all replicates; error bands indicate the 95% confidence interval. The x-axis represents the 2’FL concentrations (replicate numbers for FT-1: n = 9 from 4 independent experiments for 0% 2FL, n = 5 from 2 independent experiments for 0.03% 2’FL, n = 6 from 3 independent experiments for 0.3% 2’FL; for FT-2: n = 3 from 1 independent experiment for all 2’FL concentrations). f The FT-1 inoculum grown in media with up to 3% 2’FL with one passage and species that showed a significant depletion or enrichment in (d) are shown. The line represents the average of all replicates; error bands indicate the 95% confidence interval. The x-axis represents 2’FL concentrations (replicate numbers: n = 9 from 4 independent experiments for 0% 2FL; n = 5 from 2 independent experiments for 0.03% 2’FL; n = 3 from 1 independent experiment for 0.15% 2’FL; n = 6 from 3 independent experiments for 0.3% 2’FL; n = 5 from 2 independent experiments for 0.6% 2’FL; n = 3 from 1 independent experiment for 1% 2’FL; n = 3 with 1 independent experiment 3% 2’FL). Source data are provided as a Source Data file.
Fig. 4
Fig. 4. Mono- and co-culture growth on 2’FL, l-fucose, and d-lactose.
B. breve (blue) and R. gnavus (pink) monocultures and cocultures (purple) grew in media in which 2’FL (a), l-fucose (b), or d-lactose (c) was the only carbohydrate source. The x-axis represents the growth time (in hours). The left y-axis represents OD600, and the right y-axis in the co-culture panels represents the normalized relative abundance, calculated using sequencing coverage and shown as the averages of all replicates (n = 6). The experiment was done in triplicates and was repeated once. Each circle represents a mono- or co-culture replicate sample and the line represents the average of all replicates at each time point; error bands indicate the 95% confidence interval. The relative abundance of each species (B. breve or R. gnavus) at the 24th, 72nd, and 168th hours was shown in stacked bar charts in less saturated colors in the co-culture panels. Source data are provided as a Source Data file.
Fig. 5
Fig. 5. Adding R. gnavus to PT-1 enriched B. breve in 2’FL-supplemented media.
The PT-1 community with or without the supplementation of R. gnavus was grown in media containing 0.3% 2’FL with one passage. Bar height represents normalized species relative abundance, and bars are colored by species. The x-axis represents the community type, and all replicates are shown. Source data are provided as a Source Data file.
Fig. 6
Fig. 6. 2’FL exerts beneficial effects on functionally matching microbiomes.
Infant 1 and Infant 2 both consisted of a Bifidobacterium breve strain (purple) that cannot metalize 2’FL itself. The main difference between these two infant microbiomes is the presence (Infant 1) or absence (Infant 2) of an extracellular-fucosidase-encoding Ruminococcus gnavus strain (green). When feeding these two infants with the same 2’FL-supplemented drink, only Infant 1’s gut microbiome was positively modified. This is mainly due to R. gnavus breaking 2’FL into fucose and lactose, which can be used by B. breve and other community members for growth. Infant 2, which lacks R. gnavus, minimally changed following feeding. Figure created with BioRender.

References

    1. Stewart CJ, et al. Temporal development of the gut microbiome in early childhood from the TEDDY study. Nature. 2018;562:583–588. doi: 10.1038/s41586-018-0617-x. - DOI - PMC - PubMed
    1. Tamburini S, Shen N, Wu HC, Clemente JC. The microbiome in early life: implications for health outcomes. Nat. Med. 2016;22:713–722. doi: 10.1038/nm.4142. - DOI - PubMed
    1. Enav H, Bäckhed F, Ley RE. The developing infant gut microbiome: a strain-level view. Cell Host Microbe. 2022;30:627–638. doi: 10.1016/j.chom.2022.04.009. - DOI - PubMed
    1. Ma J, et al. Comparison of gut microbiota in exclusively breast-fed and formula-fed babies: a study of 91 term infants. Sci. Rep. 2020;10:15792. doi: 10.1038/s41598-020-72635-x. - DOI - PMC - PubMed
    1. Robertson RC, Manges AR, Finlay BB, Prendergast AJ. The human microbiome and child growth—first 1000 days and beyond. Trends Microbiol. 2019;27:131–147. doi: 10.1016/j.tim.2018.09.008. - DOI - PubMed

Publication types