. 2023 Nov 16;13(1):20063.
doi: 10.1038/s41598-023-47183-9.

Ensemble classification of integrated CT scan datasets in detecting COVID-19 using feature fusion from contourlet transform and CNN

Affiliations

Ensemble classification of integrated CT scan datasets in detecting COVID-19 using feature fusion from contourlet transform and CNN

Md Nur-A-Alam et al. Sci Rep. .

Abstract

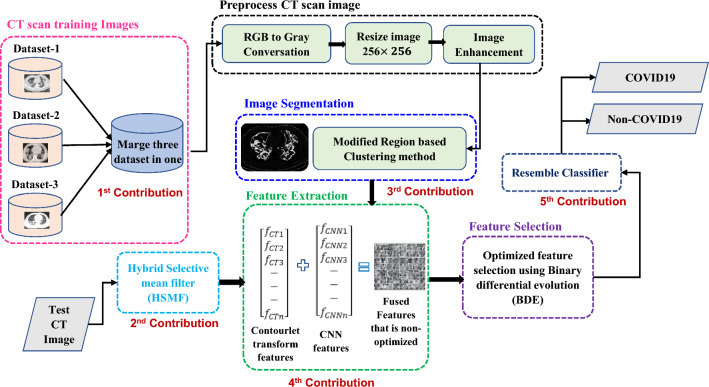
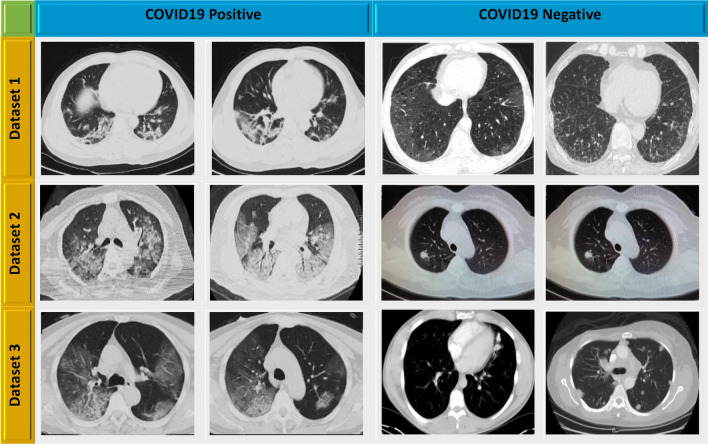
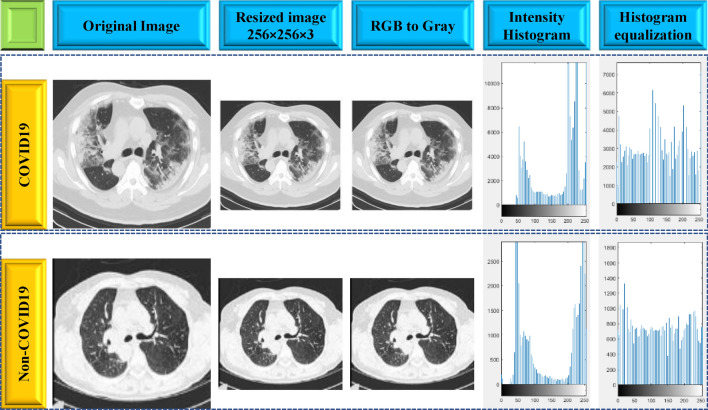
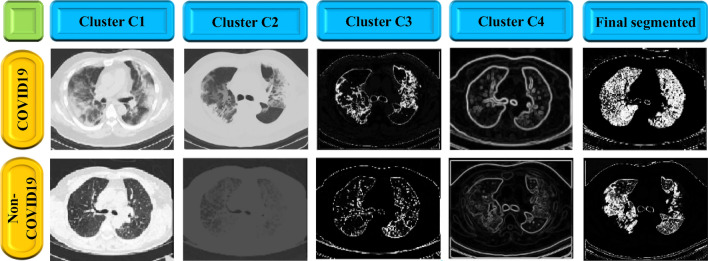
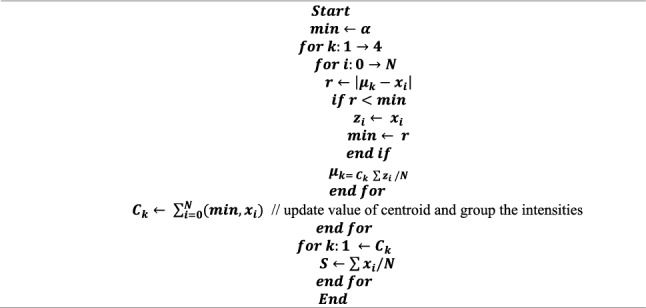
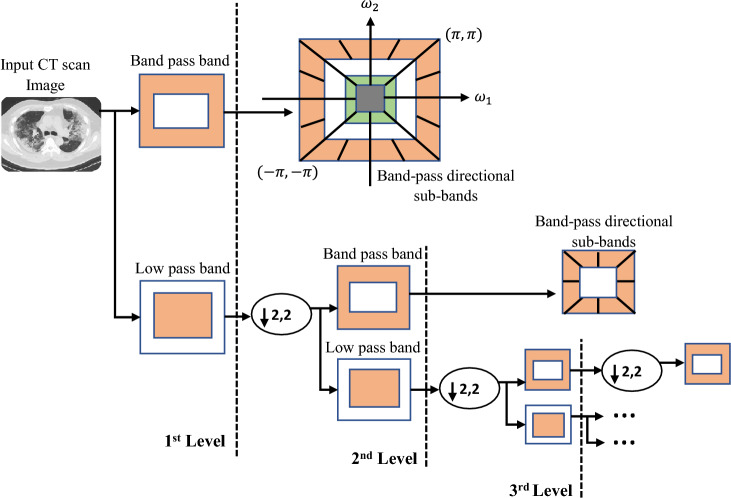
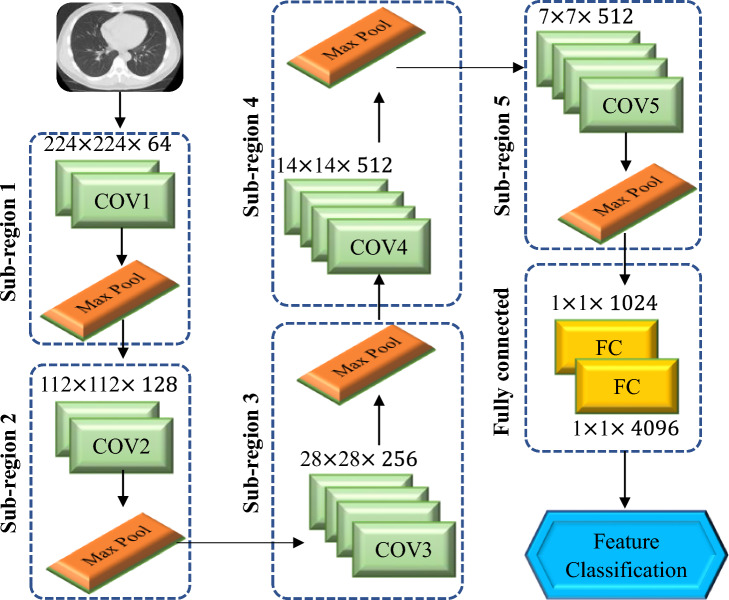
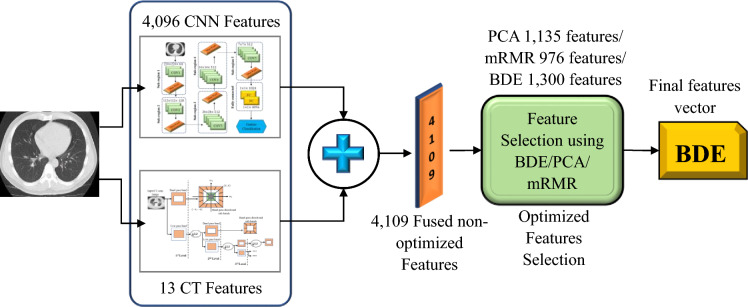
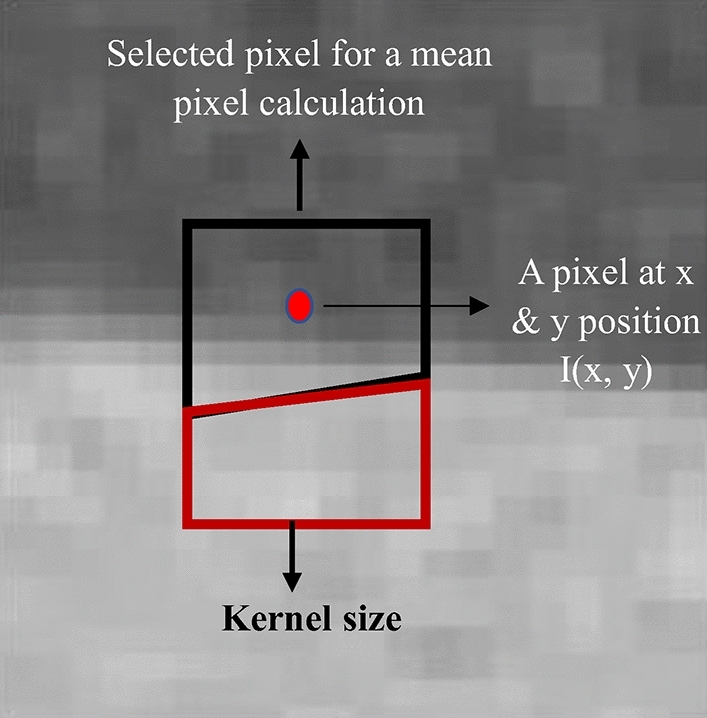
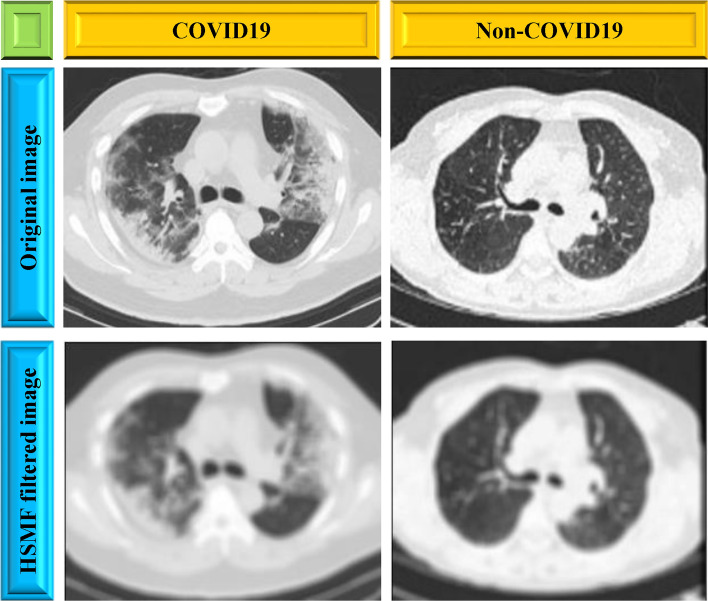
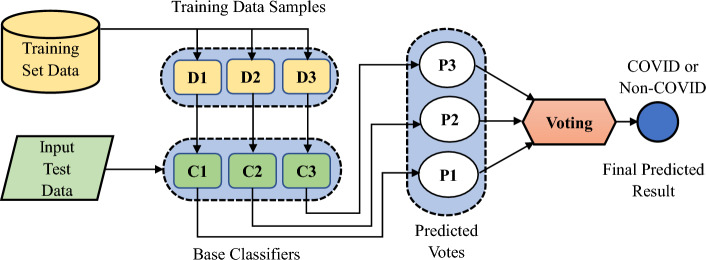
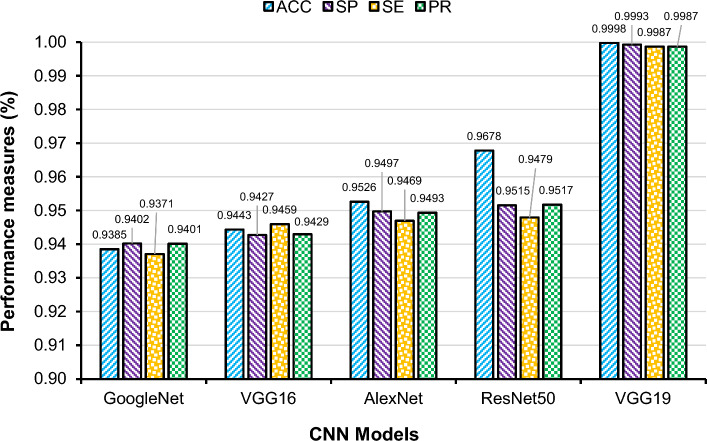
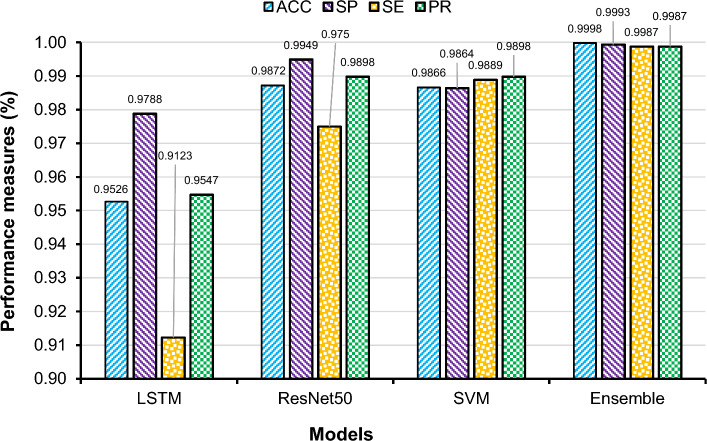
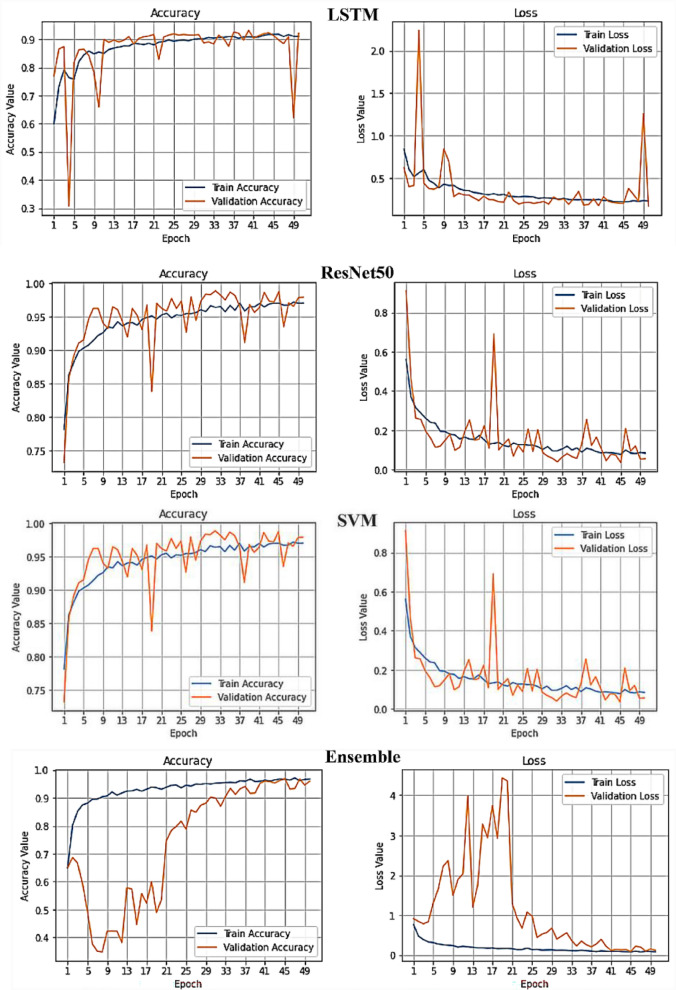
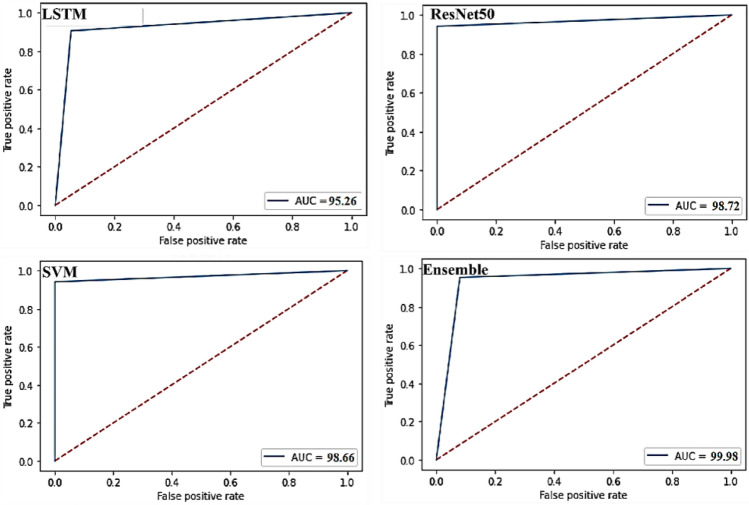
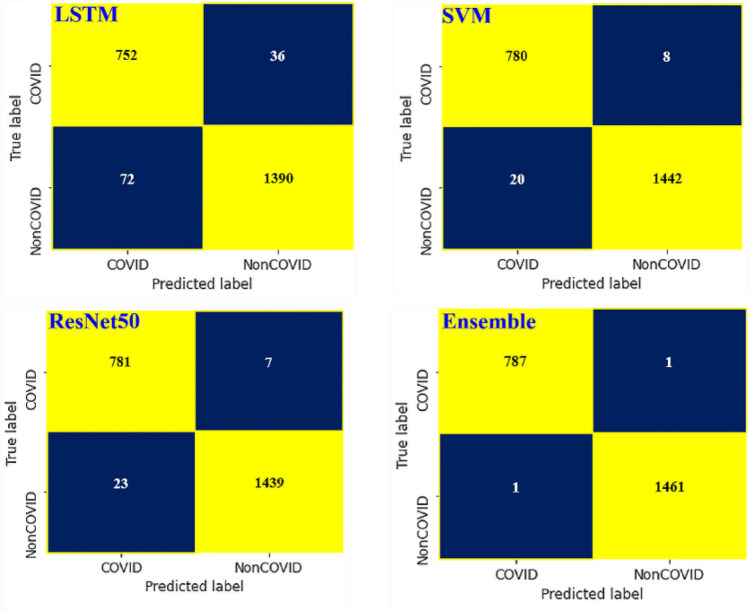
The COVID-19 disease caused by coronavirus is constantly changing due to the emergence of different variants and thousands of people are dying every day worldwide. Early detection of this new form of pulmonary disease can reduce the mortality rate. In this paper, an automated method based on machine learning (ML) and deep learning (DL) has been developed to detect COVID-19 using computed tomography (CT) scan images extracted from three publicly available datasets (A total of 11,407 images; 7397 COVID-19 images and 4010 normal images). An unsupervised clustering approach that is a modified region-based clustering technique for segmenting COVID-19 CT scan image has been proposed. Furthermore, contourlet transform and convolution neural network (CNN) have been employed to extract features individually from the segmented CT scan images and to fuse them in one feature vector. Binary differential evolution (BDE) approach has been employed as a feature optimization technique to obtain comprehensible features from the fused feature vector. Finally, a ML/DL-based ensemble classifier considering bagging technique has been employed to detect COVID-19 from the CT images. A fivefold and generalization cross-validation techniques have been used for the validation purpose. Classification experiments have also been conducted with several pre-trained models (AlexNet, ResNet50, GoogleNet, VGG16, VGG19) and found that the ensemble classifier technique with fused feature has provided state-of-the-art performance with an accuracy of 99.98%.


Conflict of interest statement

The authors declare no competing interests.

Figures

Figure 1
Figure 1
Proposed methodology for detecting COVID-19.
Figure 2
Figure 2
Sample CT scan images from three datasets.
Figure 3
Figure 3
Preprocessing steps applied to the COVID-19 and non-COVID-19 images.
Figure 4
Figure 4
Applied modified region based clustering method for COVID19 and non-COVID19 image segmentation.
None
Algorithm 1: Proposed segmentation algorithm.
Figure 5
Figure 5
Overall structure of contourlet transform feature extraction method.
Figure 6
Figure 6
Architecture of VGG19 for feature extraction from CT scan images.
Figure 7
Figure 7
Block diagram of optimised feature selection process.
Figure 8
Figure 8
An illustration of picking neighboring pixels for noise reduction in the hybrid selective mean filter (HSMF) method.
Figure 9
Figure 9
Filtered CT scan images using hybrid selective mean filter method.
Figure 10
Figure 10
The bagging approach in the ensemble classifier.
Figure 11
Figure 11
Comparisons of the classification performance results achieved by different CNN models for feature extraction and fusion combined with contourlet transform (feature selection by BDE optimisation and classification with ensemble technique).
Figure 12
Figure 12
Comparison of the performances of individual and ensemble classifiers (feature extraction and fusion by VGG-19 and contourlet transform and feature selection by BDE optimisation).
Figure 13
Figure 13
Comparison of training accuracy and loss performance curves for different classifiers.
Figure 14
Figure 14
Receiver operating characteristics (ROC) curves for different models.
Figure 15
Figure 15
Confusion matrixes for different models.
Figure 16
Figure 16
ROC curves for k-fold validation.
Figure 17
Figure 17
Training accuracy and training loss curves, confusion matrix, and ROC curves by appling generalization method. for COVID-19 Radiography database.

Similar articles

References

    1. Wiersinga WJ, Rhodes A, Cheng AC, Peacock SJ, Prescott HC. Pathophysiology, transmission, diagnosis, and treatment of coronavirus disease 2019 (COVID-19): A review. JAMA. 2020;324(8):782–793. doi: 10.1001/jama.2020.12839. - DOI - PubMed
    1. Cucinotta D, Vanelli M. WHO declares COVID-19 a pandemic. Acta Biomed. 2020;91(1):157–160. doi: 10.23750/abm.v91i1.9397. - DOI - PMC - PubMed
    1. Li J, Zhao G, Tao Y, Zhai P, Chen H, He H, Cai T. Multi-task contrastive learning for automatic CT and X-ray diagnosis of COVID-19. Pattern Recogn. 2021;114:107848. doi: 10.1016/j.patcog.2021.107848. - DOI - PMC - PubMed
    1. Kwekha-Rashid AS, Abduljabbar HN, Alhayani B. Coronavirus disease (COVID-19) cases analysis using machine-learning applications. Appl. Nanosci. 2021;2013:1–13. - PMC - PubMed
    1. Hu B, Guo H, Zhou P, Shi Z-L. Characteristics of SARS-CoV-2 and COVID-19. Nat. Rev. Microbiol. 2020 doi: 10.1038/s41579-020-00459-7. - DOI - PMC - PubMed