. 2023 Dec;25(12):1860-1872.
doi: 10.1038/s41556-023-01269-8. Epub 2023 Nov 16.

Host extracellular vesicles confer cytosolic access to systemic LPS licensing non-canonical inflammasome sensing and pyroptosis

Affiliations

Host extracellular vesicles confer cytosolic access to systemic LPS licensing non-canonical inflammasome sensing and pyroptosis

Puja Kumari et al. Nat Cell Biol. 2023 Dec.

Abstract

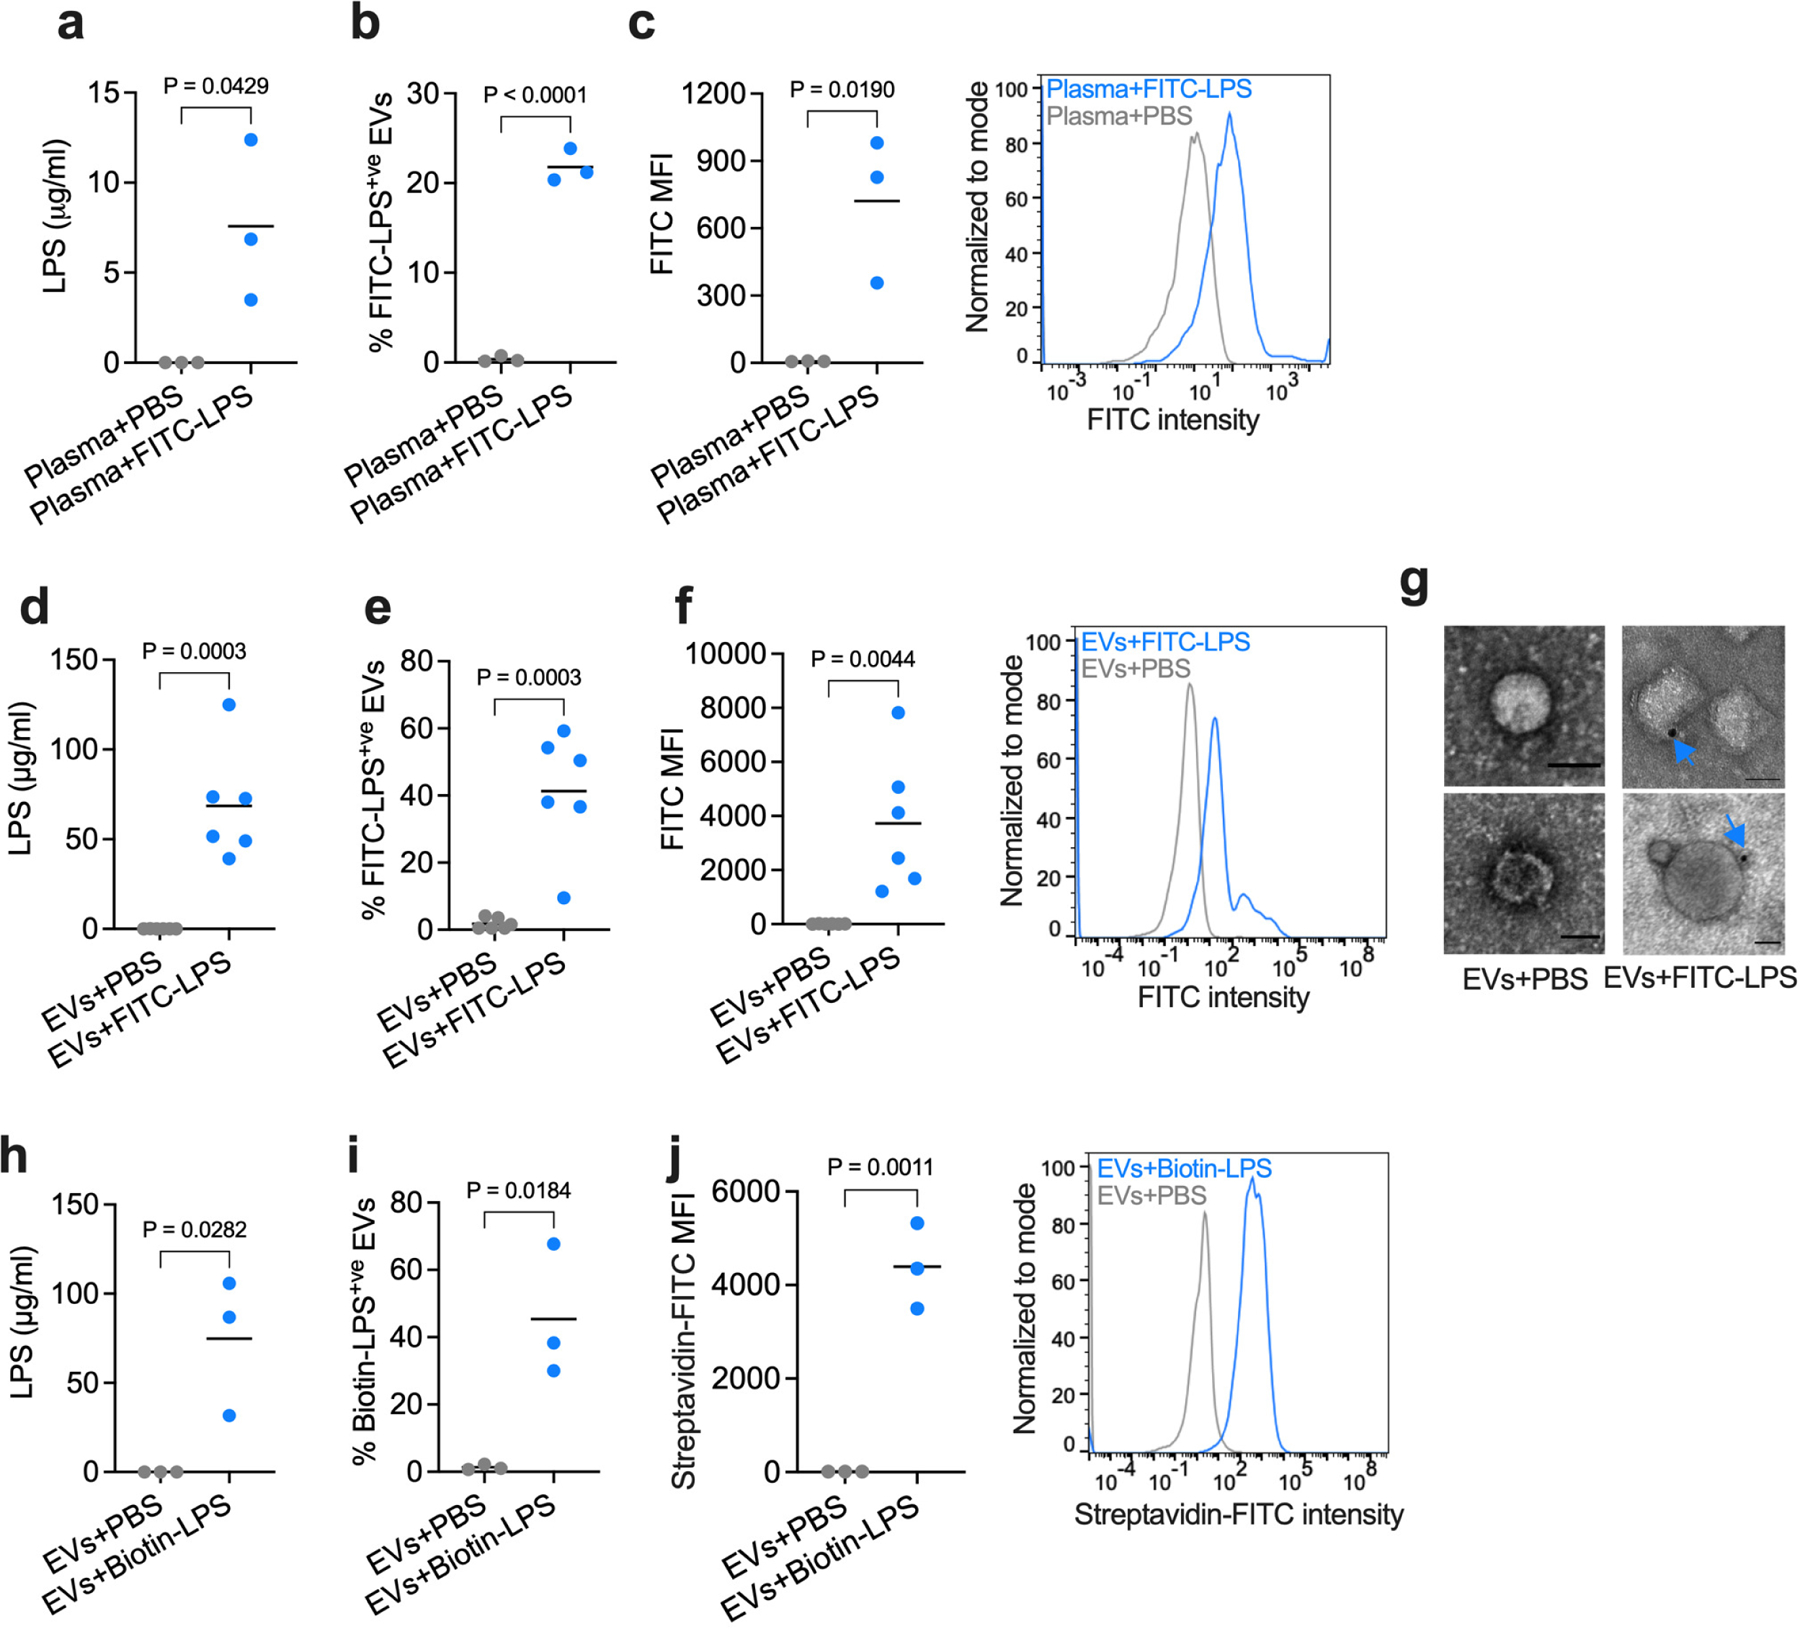
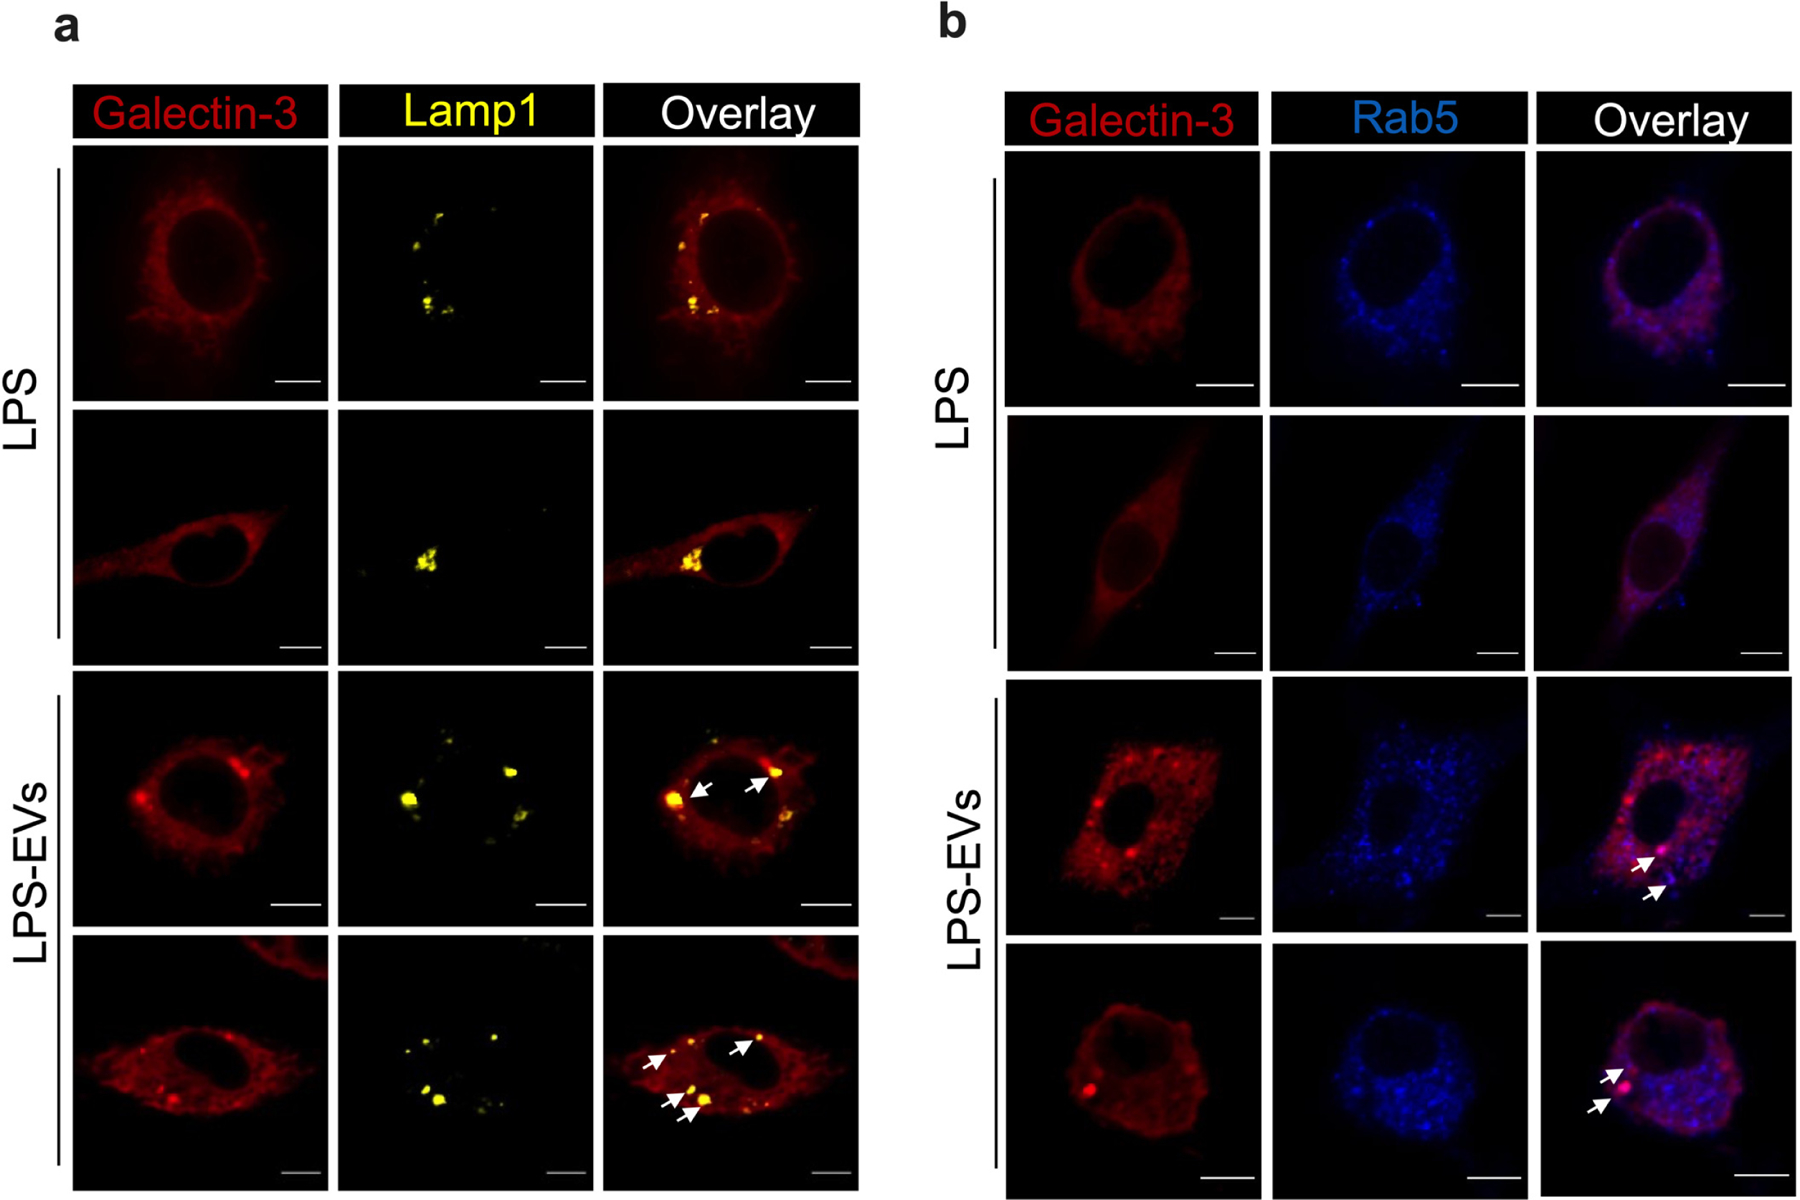
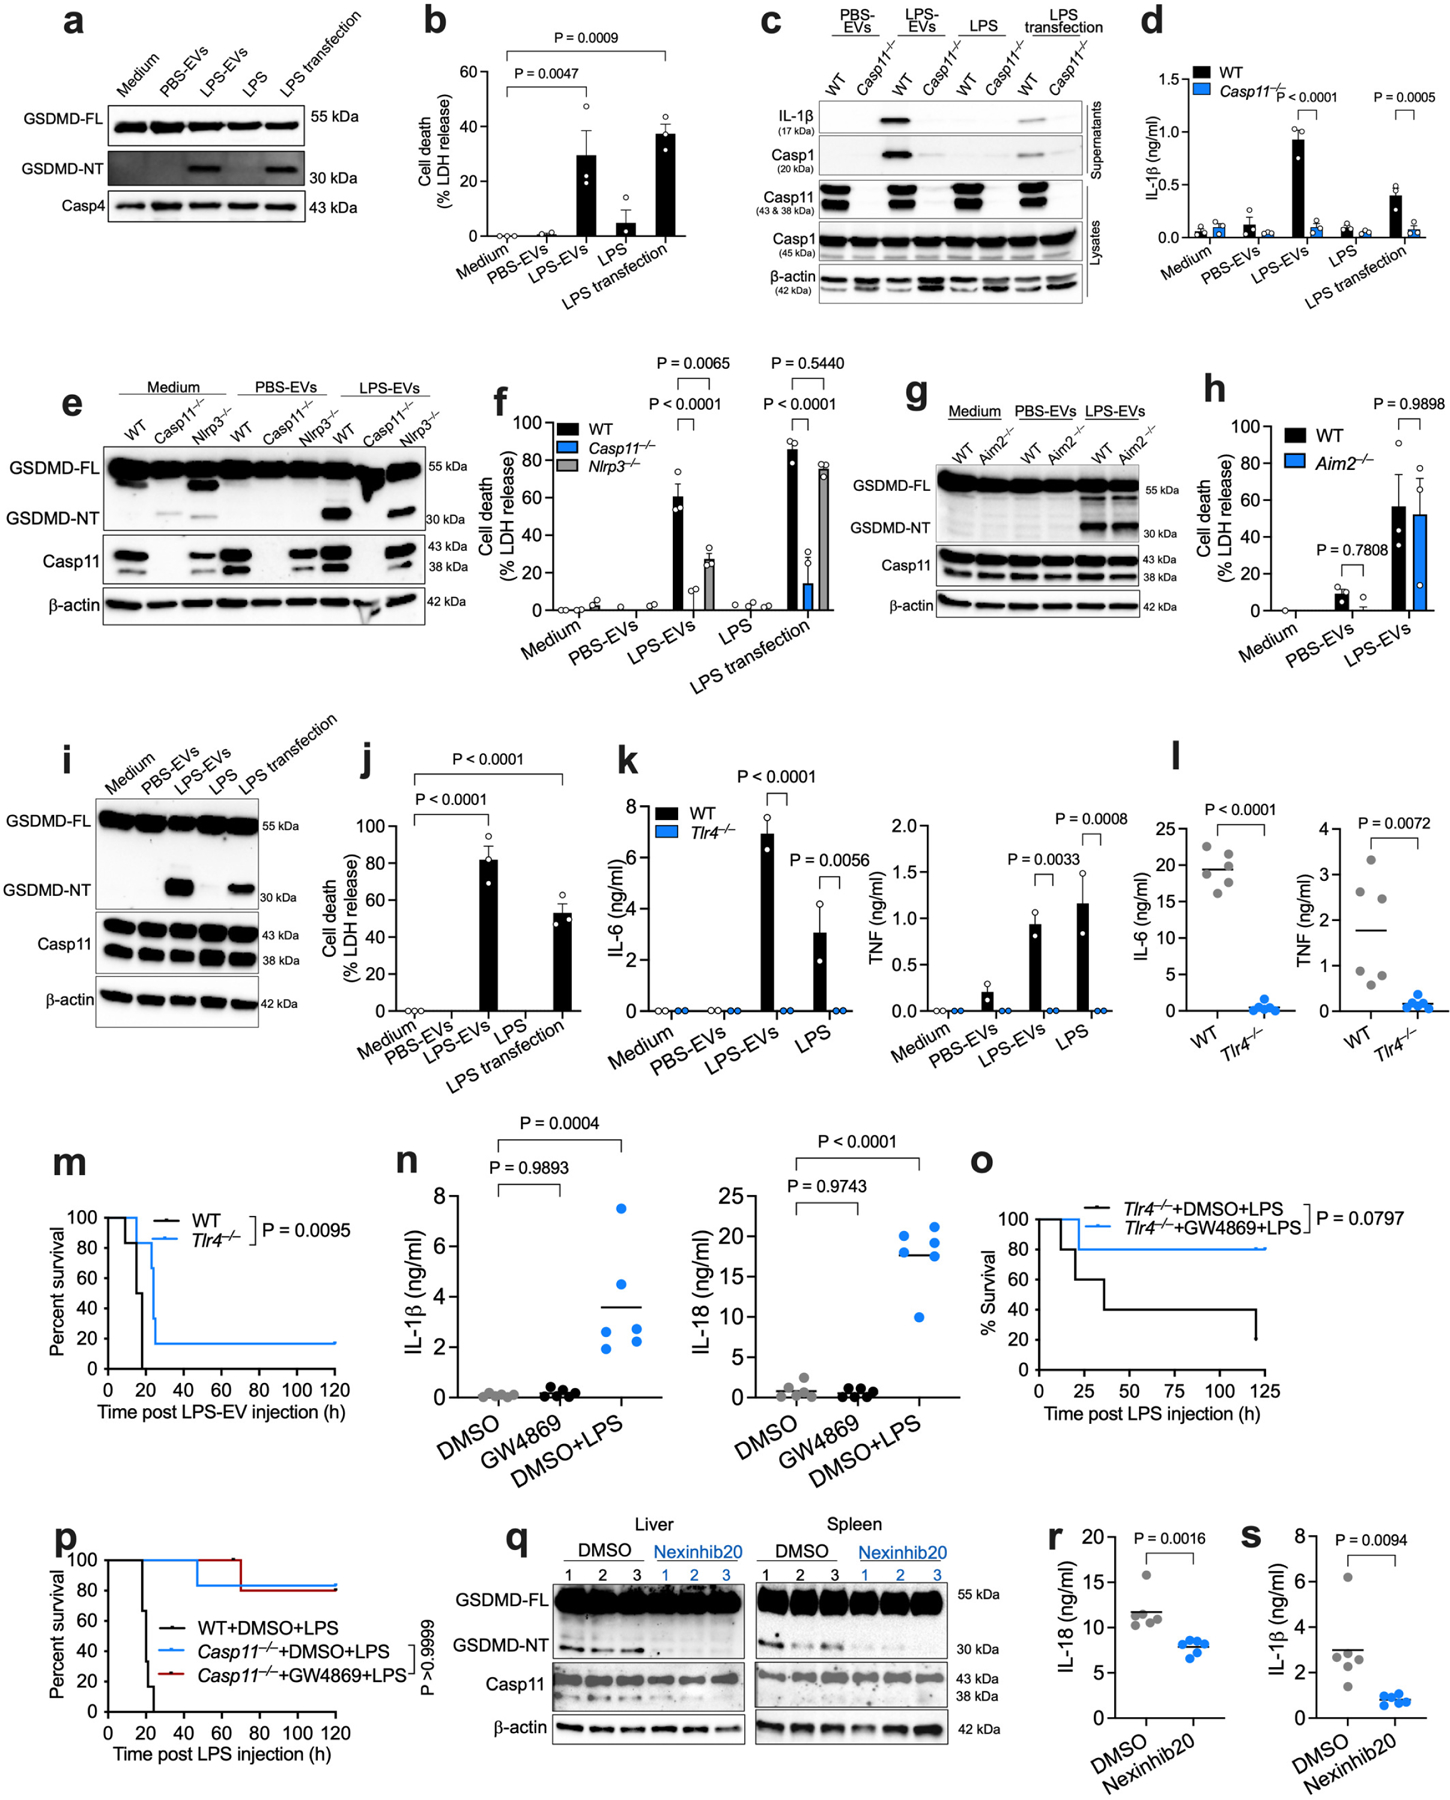
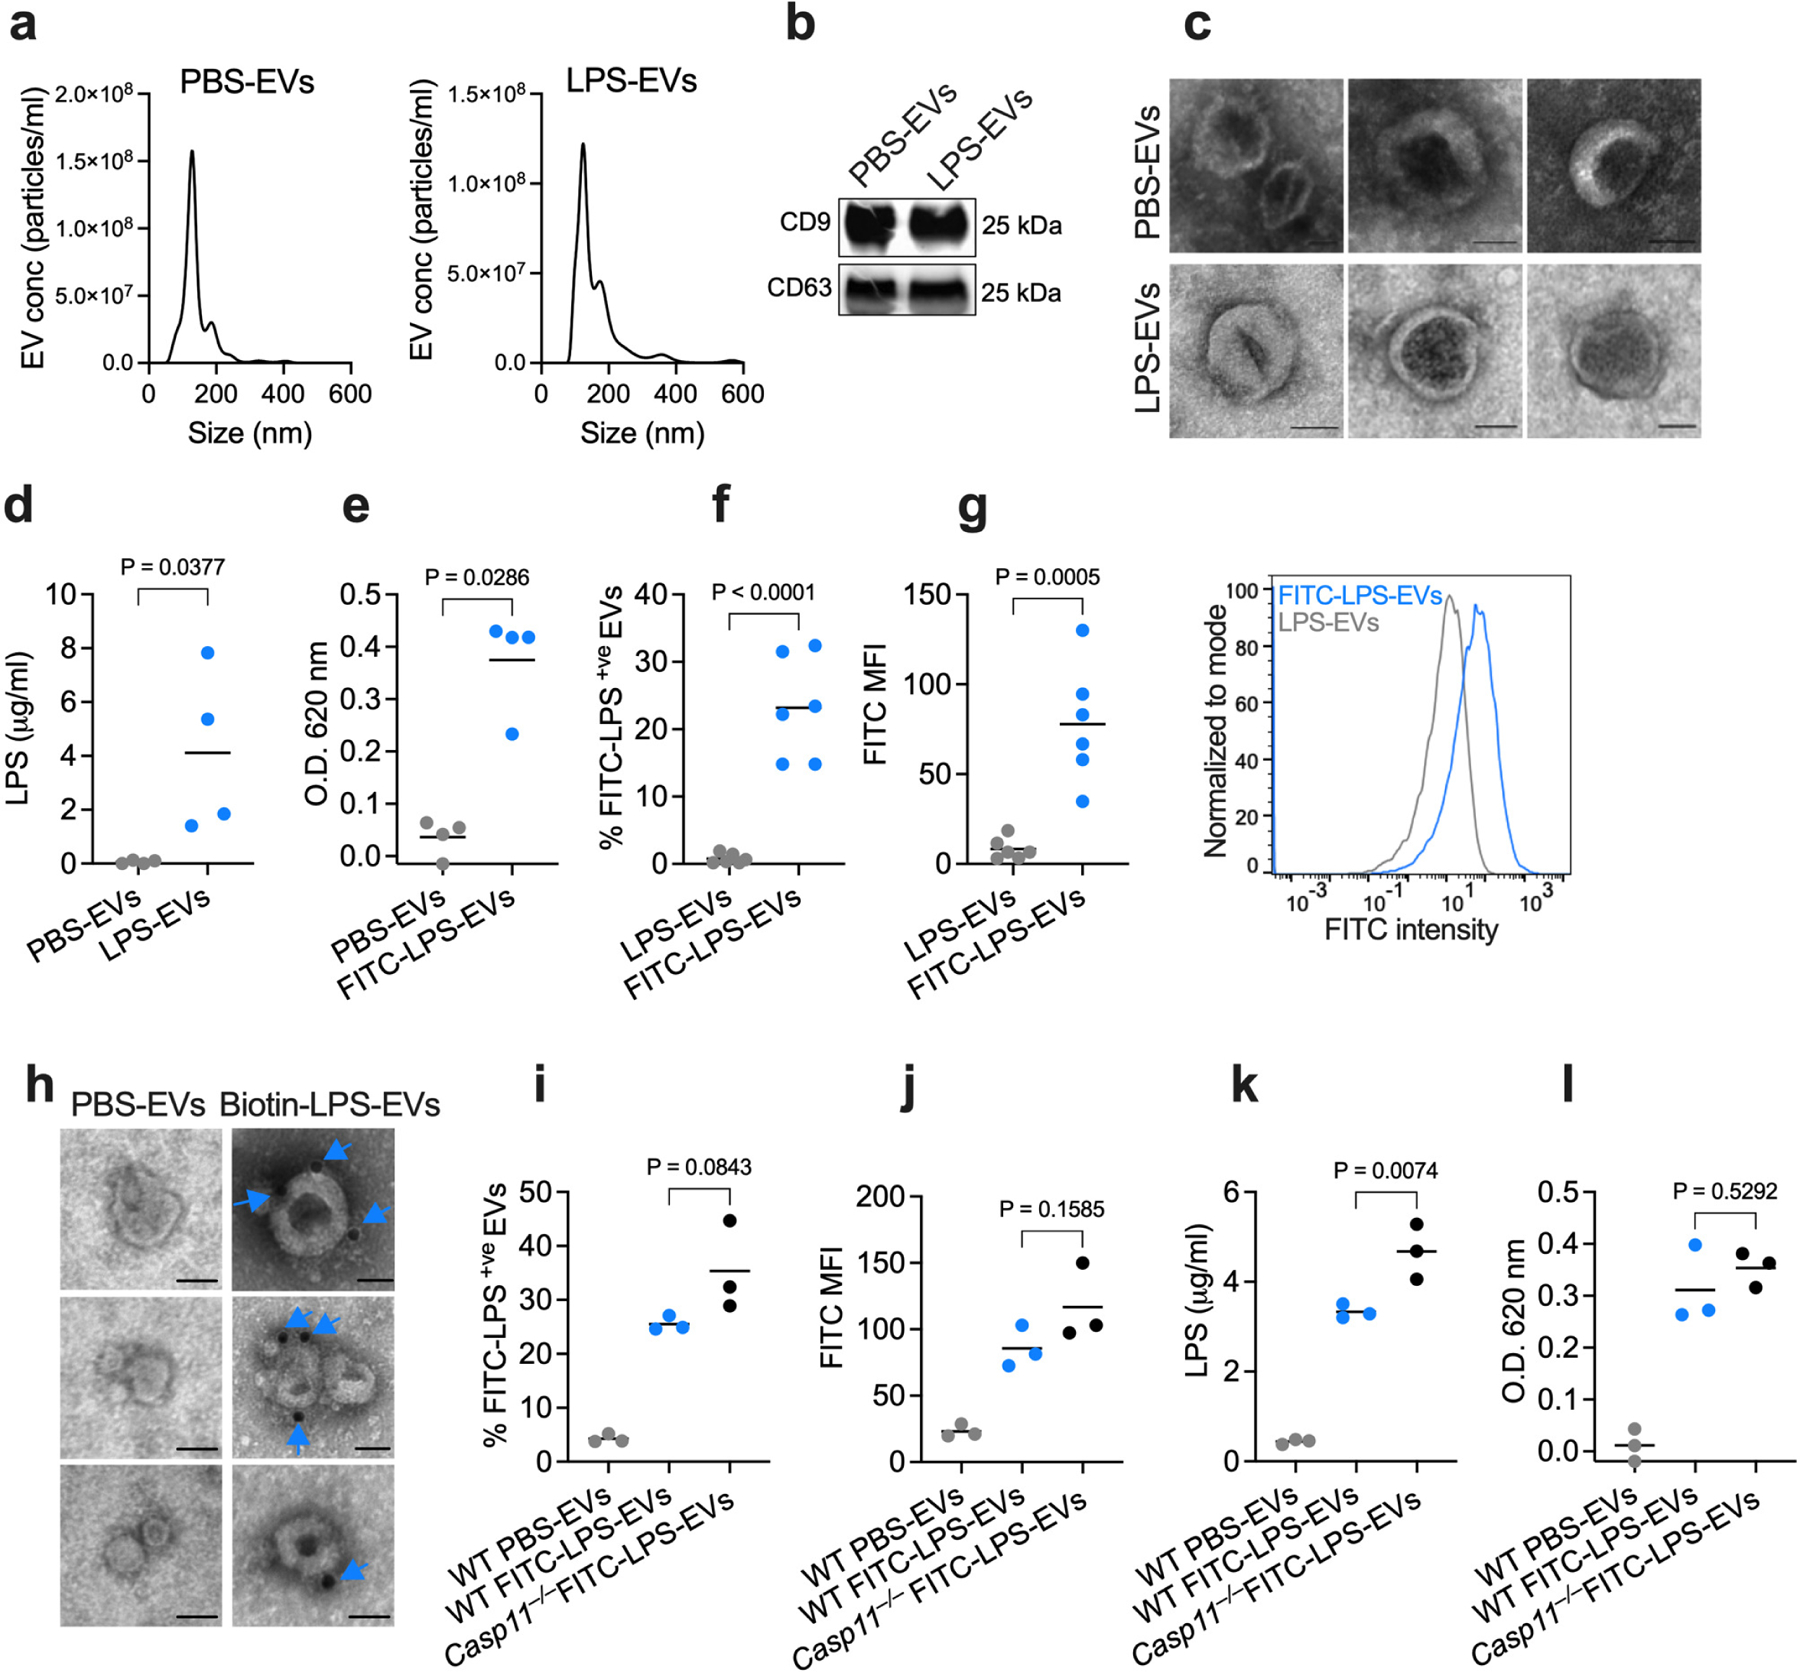
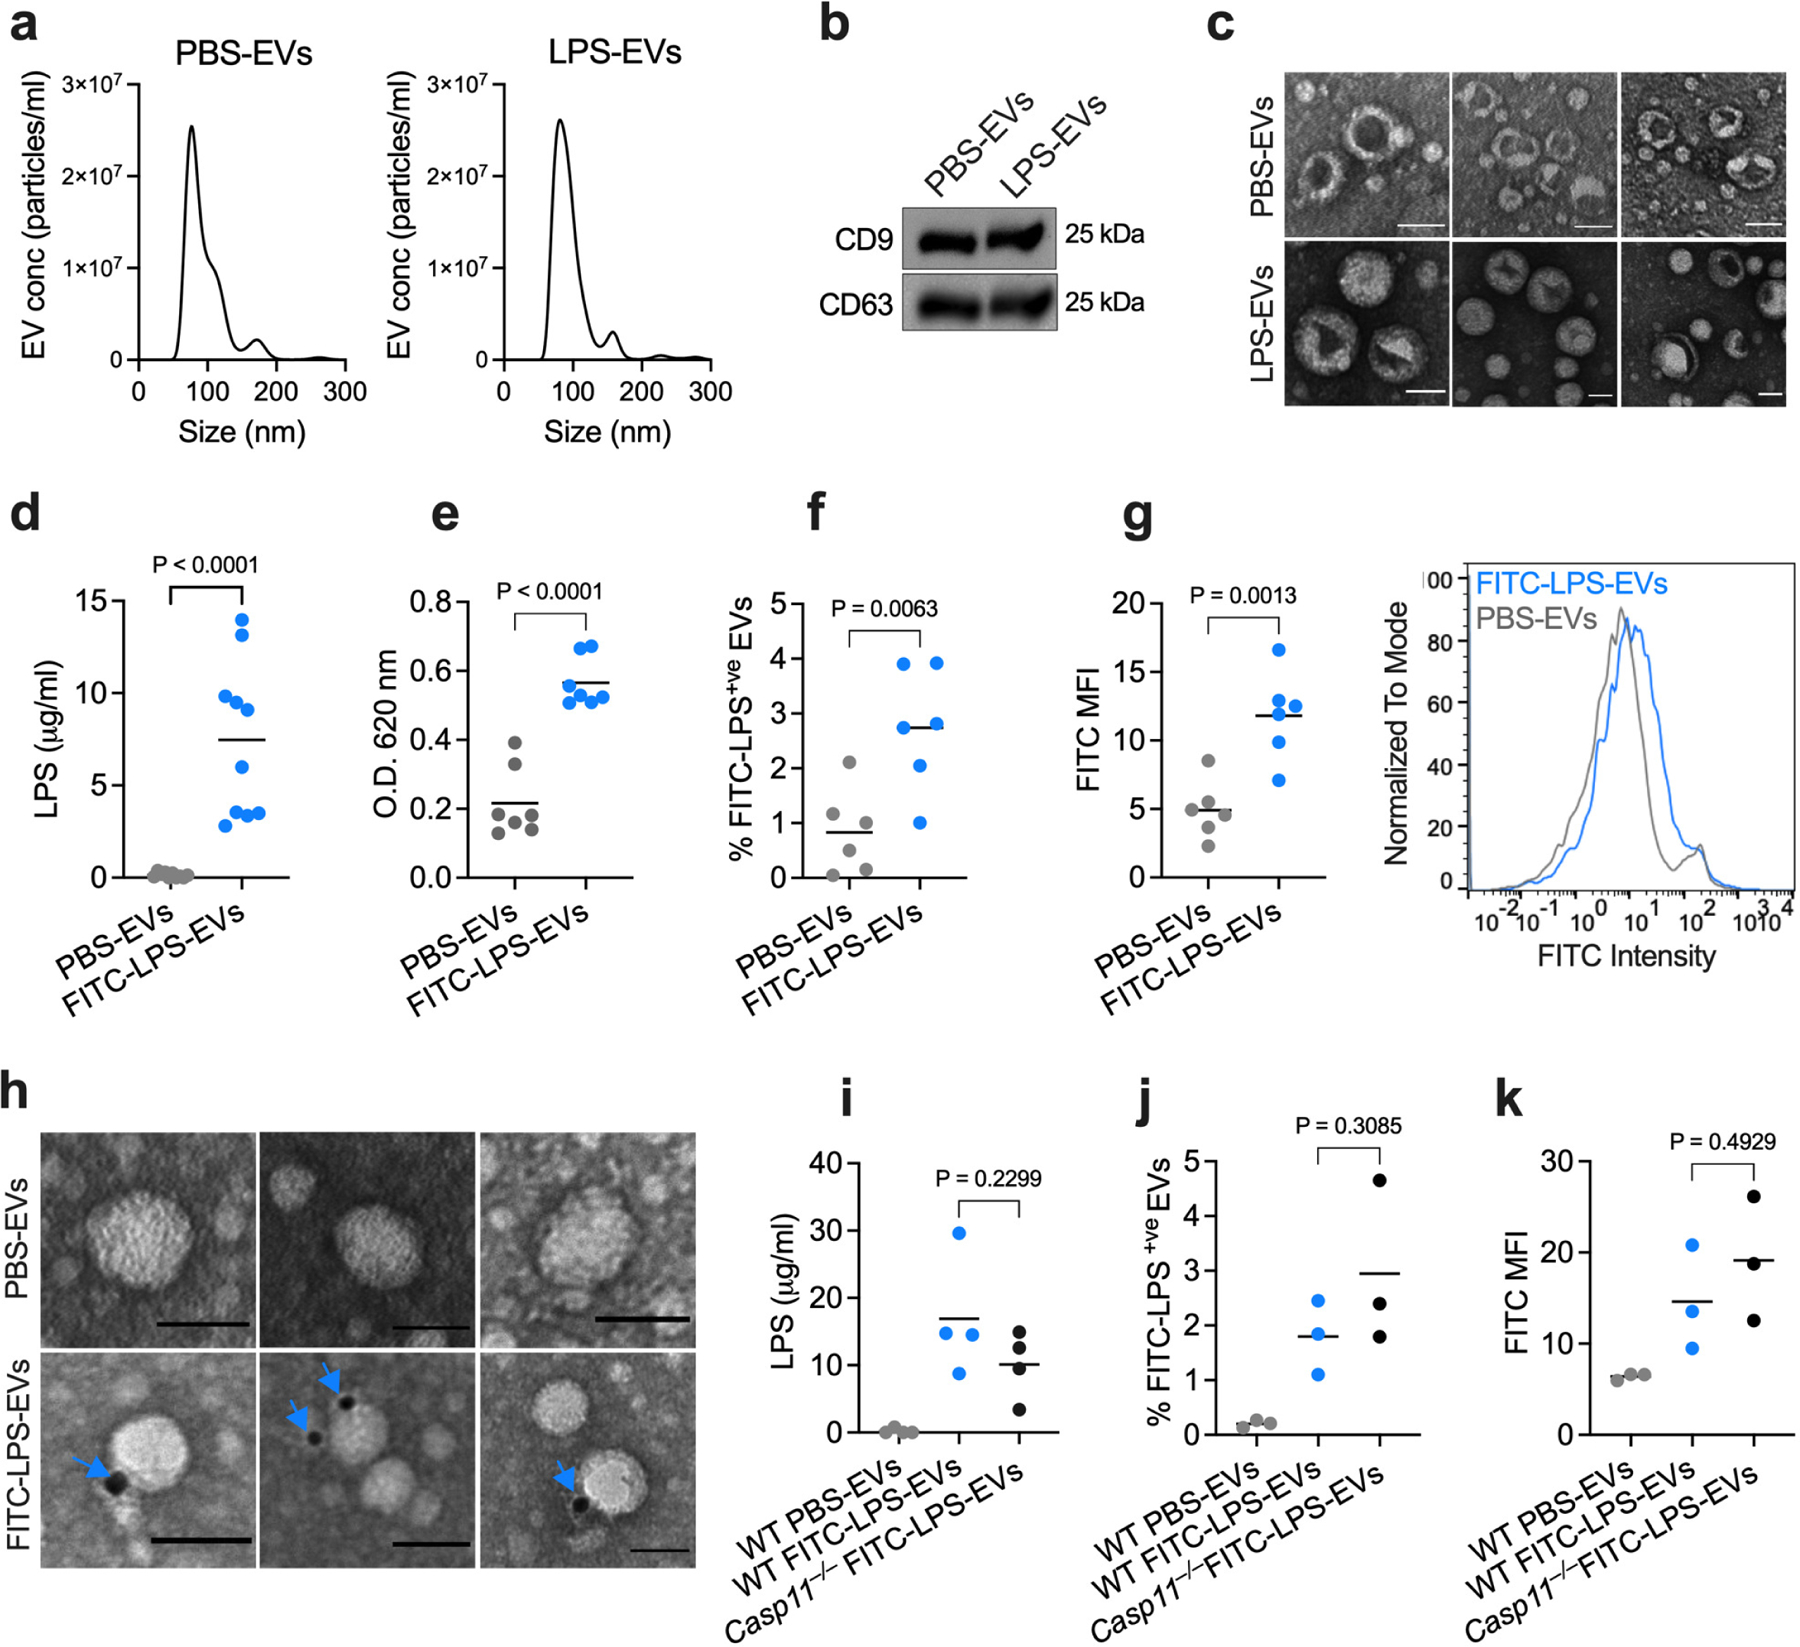
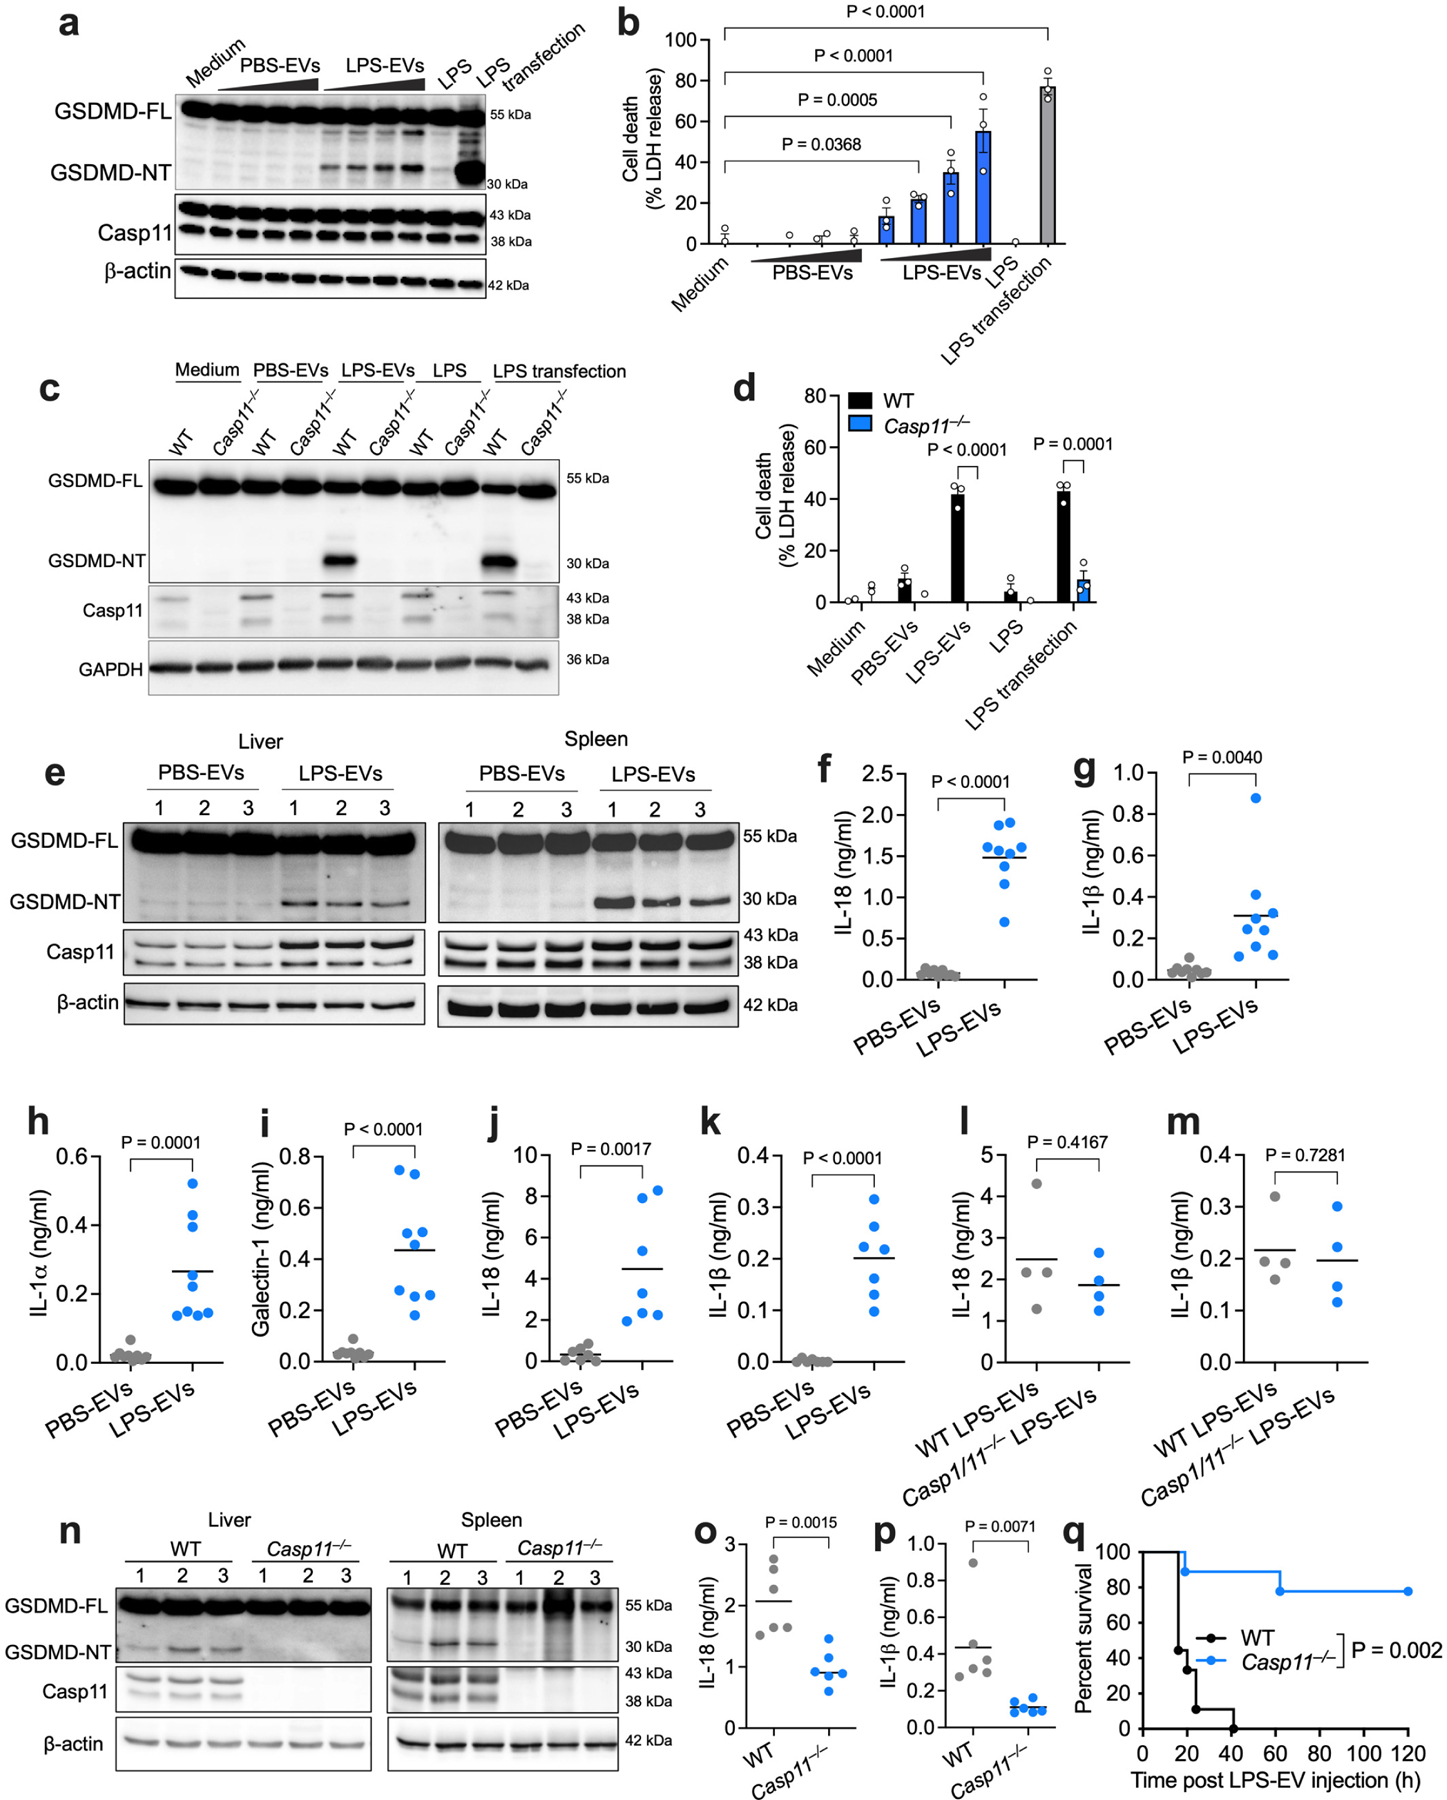
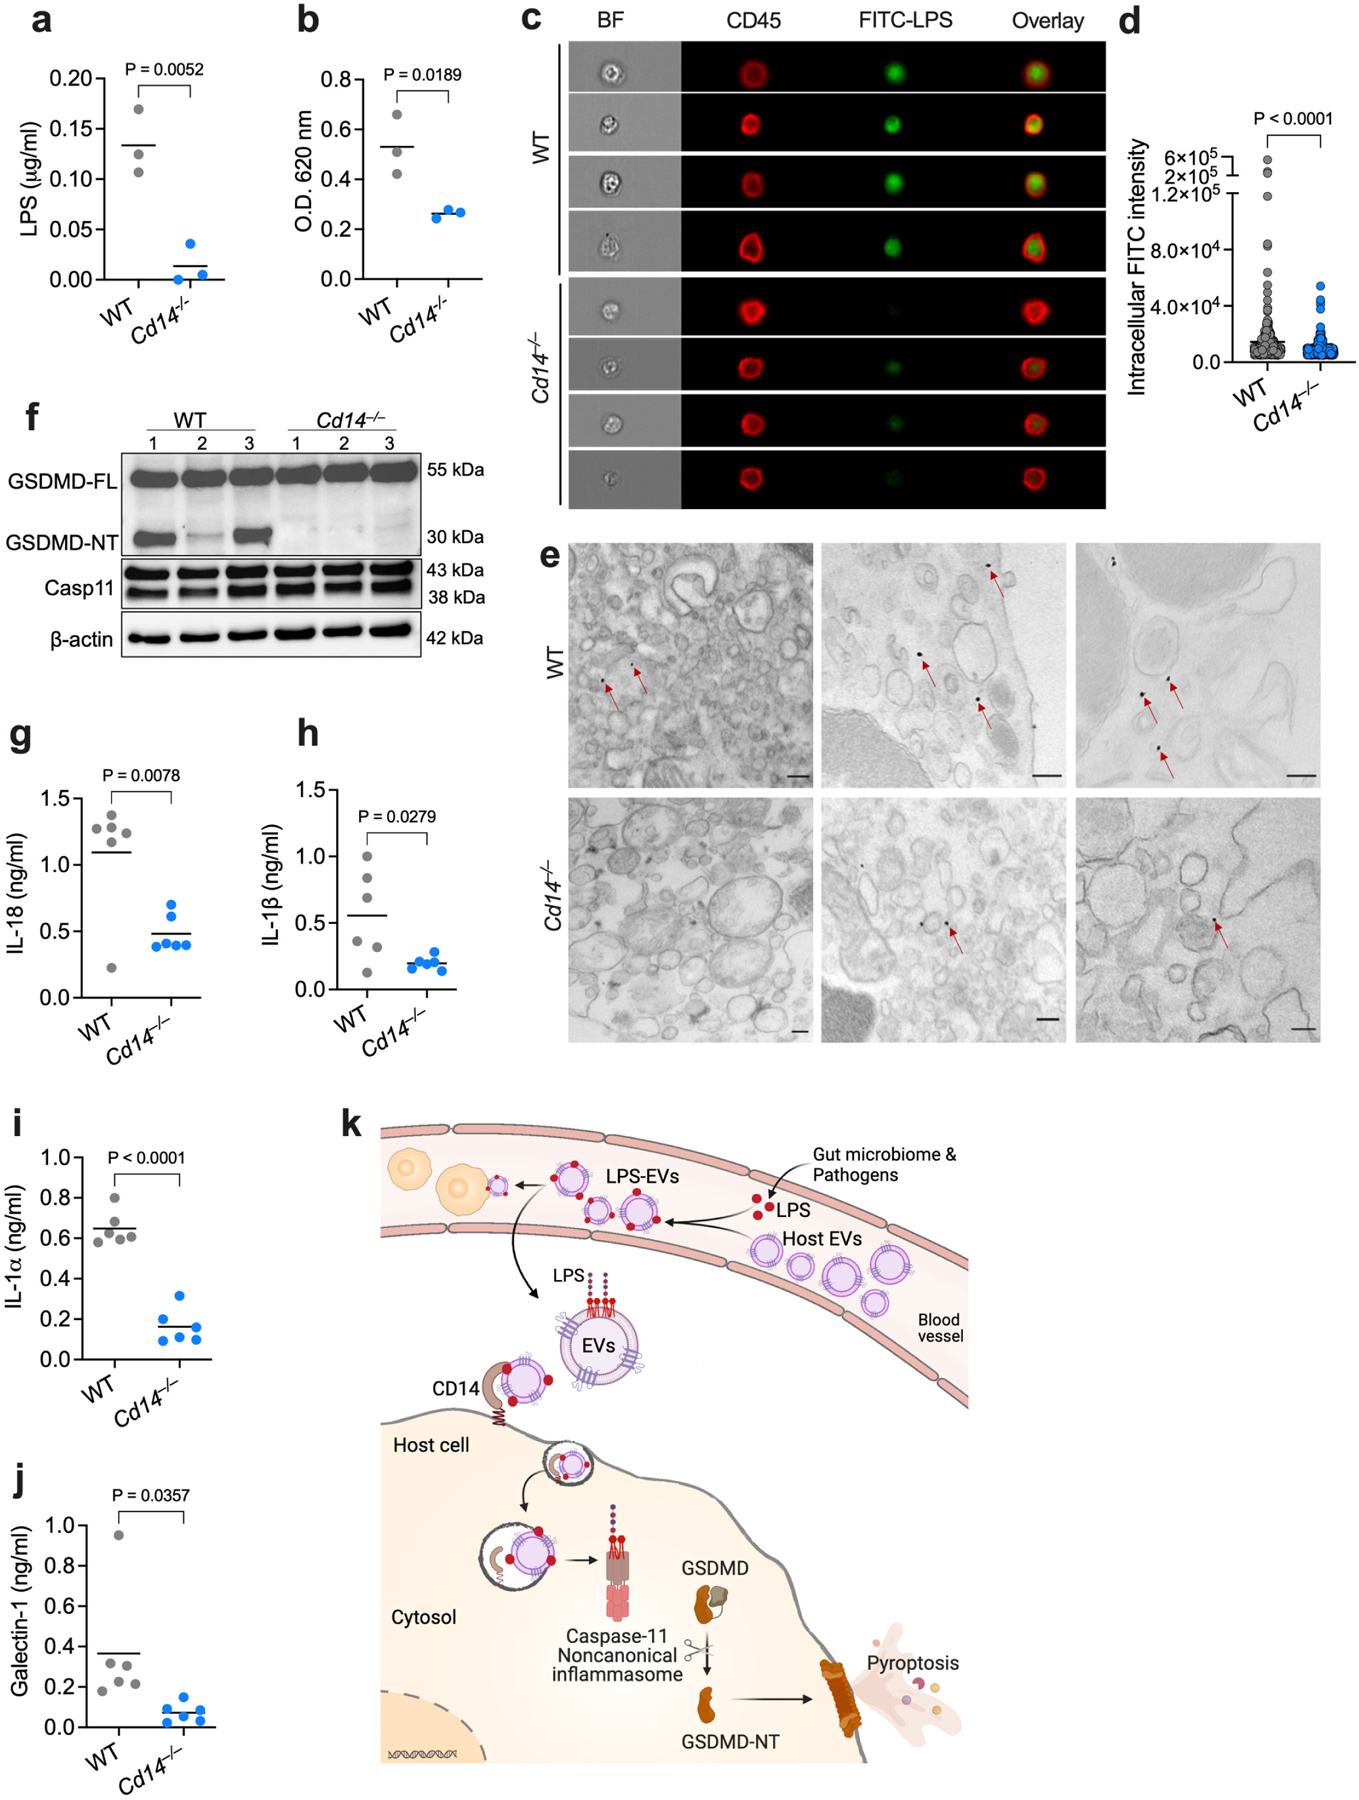
Intracellular surveillance for systemic microbial components during homeostasis and infections governs host physiology and immunity. However, a long-standing question is how circulating microbial ligands become accessible to intracellular receptors. Here we show a role for host-derived extracellular vesicles (EVs) in this process; human and murine plasma-derived and cell culture-derived EVs have an intrinsic capacity to bind bacterial lipopolysaccharide (LPS). Remarkably, circulating host EVs capture blood-borne LPS in vivo, and the LPS-laden EVs confer cytosolic access for LPS, triggering non-canonical inflammasome activation of gasdermin D and pyroptosis. Mechanistically, the interaction between the lipid bilayer of EVs and the lipid A of LPS underlies EV capture of LPS, and the intracellular transfer of LPS by EVs is mediated by CD14. Overall, this study demonstrates that EVs capture and escort systemic LPS to the cytosol licensing inflammasome responses, uncovering EVs as a previously unrecognized link between systemic microbial ligands and intracellular surveillance.


Conflict of interest statement

Competing interests statement: Y.Z.’s company FormuMax is interested in the sales of exosome-mimicking liposomes. The remaining authors declare no competing interests.

Figures

Extended Data Fig. 1:
Extended Data Fig. 1:. Host-derived EVs bind LPS in vivo.
a, Plasma EV levels in wild-type (WT) mice injected with PBS or LPS (10 mg/kg) for indicated times as assessed by nanoparticle tracking analysis (NTA). b, Size distribution of EVs isolated from the plasma of WT mice injected with PBS or LPS (25 mg/kg) 1.5 h post-injection via OptiPrep density gradient method as assessed by NTA. c, Immunoblotting analysis of EVs isolated from the plasma of PBS- or LPS-injected WT mice as in (b). d, Negative staining TEM of EVs isolated from the plasma of PBS or LPS-injected WT mice as in (b). e, LPS content of the EVs isolated from WT mice injected with PBS or LPS as assessed by the LAL assay (n=4). f,g, Percentage of FITC-LPS+ve EVs (f) and FITC histogram and mean fluorescence intensity (MFI) of EVs (g) isolated from mice injected with PBS or FITC-LPS (25 mg/kg) 1.5 h post-injection as assessed by ImageStream flow cytometry (n=3). h, Immunoblotting analysis of EVs isolated by the DIC method using CD9, CD63, and CD81 antibodies-coated magnetic beads from the plasma of PBS- or FITC-LPS (25 mg/kg)-injected WT mice. i,j, LPS content of the DIC-isolated EVs from PBS- or FITC-LPS-injected mice 1.5 h post-injection as assessed by the LAL (n=3) (i) and HEK-Blue TLR4 reporter cell (n=3) (j) assays. k,l, Percentage of FITC-LPS+ve EVs (k) and FITC histogram and mean fluorescence intensity (MFI) of EVs (l) isolated by the DIC method from mice injected with PBS or FITC-LPS as assessed by flow cytometry (n=3). Combined data from two (a) or three (e,f,g,i,j,k,l) or representative data of two (b,c,d,h) independent experiments are shown. Data are shown as mean±s.e.m (a). Each circle represents a mouse, and the horizontal lines represent mean (a, e–g and i–l). P values were determined by one-way ANOVA with Dunnett’s post-test (a) or unpaired two-tailed t-test (e–g and i– l). Scale bar, 50 nm (d).
Extended Data Fig. 2:
Extended Data Fig. 2:. Microvesicles bind LPS in vivo.
(a–b) Percentage of FITC-LPS+ve microvesicles (MVs; annexin A1+ve) and LPS content of MVs isolated from Casp11−/− mice injected with PBS or FITC-LPS via ultracentrifugation as assessed by ImageStream flow cytometry (a) and the LAL assay (b). Each circle represents pooled sample from two mice. Combined data from two independent experiments are shown.
Extended Data Fig. 3:
Extended Data Fig. 3:. Plasma EVs bind LPS independent of blood components.
a, LPS content of the EVs isolated by the SEC method from the plasma incubated with PBS or FITC-LPS (500 μg) at 37 oC for 45 min as assessed by the LAL assay (n=3). b,c, Percentage of FITC-LPS+ve EVs (b) and FITC histogram and mean fluorescence intensity (MFI) of EVs (c) isolated by the SEC method from the plasma incubated with PBS or FITC-LPS in vitro as assessed by ImageStream flow cytometry (n=3). d–f and h–j, EVs isolated from the plasma by the SEC method were incubated with PBS, FITC-LPS, or biotin-LPS as indicated at 37 oC for 45 min in vitro, and the LPS binding was assessed by the LAL assay (n=3 or 6 as indicated) (d,h) and ImageStream flow cytometry (n=3 or 6 as indicated) (e,f,i,j). g, TEM of EVs isolated and treated as described above and stained with anti-FITC-gold particles. Arrows indicate LPS. Combined data from three (a–c and h–j) or six (d–f) experiments or one representative of two experiments (g) are shown. Each circle represents a mouse, and the horizontal lines represent the mean in a–f and h–j. P values were determined by unpaired two-tailed t-test. Scale bar, 50 nm (g).
Extended Data Fig. 4:
Extended Data Fig. 4:. Human plasma EVs and endothelial and epithelial cell EVs bind LPS.
a–h, EVs isolated from the human plasma by the SEC method were incubated with PBS, FITC-LPS or biotin-LPS as indicated at 37 oC for 45 min, and the LPS binding was assessed by the LAL (a,e) and HEK-Blue TLR4 reporter cell (b,f) assays and ImageStream flow cytometry (c,d,g,h) (n=3). i–p, EVs isolated from bEnd.3 endothelial (i–l) and HeLa (m–p) cells cultured in serum-free conditions by the UC method were incubated with PBS or FITC-LPS (500 μg) as indicated at 37 oC for 45 min followed by re-purification via SEC, and the LPS binding was assessed by the LAL (i,m) and HEK-Blue TLR4 reporter cell (j,n) assays and ImageStream flow cytometry (k,l,o,p) (n=3). Combined data from three experiments (a–p) are shown. Each circle represents an independent experiment, and the horizontal lines represent the mean. P values were determined by unpaired two-tailed t-test (a–p).
Extended Data Fig. 5:
Extended Data Fig. 5:. Intracellular localization of LPS is EV-dependent.
(a–d) Confocal microscopy of Casp11−/− iBMDMs stimulated for 4 h with unlabeled EVs (a), FITC-LPS (b), FITC-LPS-EVs (c), or CellBrite Steady Membrane 488-labeled-EVs (d) and stained with anti-CD45, anti-EEA1 and anti-FITC antibodies to visualize plasma membrane, early endosomes and LPS, respectively. Arrows indicate intracellular localization of EV-bound FITC-LPS (c) or CellBrite 488-labeled-EVs (d). Images representative of two experiments are shown. Scale bar: 5 μm.
Extended Data Fig. 6:
Extended Data Fig. 6:. LPS-laden host EVs induce endolysosomal membrane disruption.
Confocal images of WT BMDMs stimulated with LPS or LPS-EVs for 6 h and stained for galectin-3 (red), lamp1 (yellow; a), and Rab5 (blue; b). Scale bar: 5 μM. White arrows indicate the colocalization of galectin-3 and lamp1 or Rab5. Images representative of two experiments are shown.
Extended Data Fig. 7:
Extended Data Fig. 7:. EV-bound LPS activates the noncanonical inflammasome.
a,b, GSDMD and caspase-4 in lysates (a) and cell death (b) of IFN-γ-primed (10 ng/ml) THP1 monocytes stimulated as indicated for 16 h. c,d, Cleaved IL-1β (p17) and caspase-1 (p20) in the supernatants and indicated proteins in lysates of (c) and IL-1β secretion (d) by IFN-γ-primed WT and Casp11−/− BMDMs stimulated as indicated for 16 h. e–h, GSDMD, caspase-11 and β-actin in lysates (e,g) and cell death (f,h) of IFN-γ-primed indicated BMDMs stimulated as indicated for 16 h. i,j, Indicated proteins in lysates (i) and cell death (j) of IFN-γ-primed RAW macrophages stimulated as indicated for 16 h. k, IL-6 and TNF secretion by indicated BMDMs stimulated with PBS-EVs, LPS-EVs (2.5 μg LPS/ml) or LPS (2.5 μg/ml) for 16 h. l, Plasma IL-6 and TNF in indicated mice administered with LPS-EVs for 6 h (n=6). m, Survival of poly(I:C)-primed WT and Tlr4−/− mice injected with LPS-EVs (n=6). n, Baseline IL-1β and IL-18 in the plasma of WT mice injected with DMSO (vehicle) or GW4869 (2.5 μg/g) twice 24 h apart. DMSO-treated LPS-injected mice are shown as controls (n=6). o, Survival of Tlr4−/− mice injected with DMSO or GW4869 (2.5 μg/g) on days 1–3, primed with poly(I:C) on day 3 and injected with LPS (25 μg/g) 6 h later (n=5). p, Survival of indicated mice injected with DMSO or GW4869 (2.5 μg/g) on days 1–3 and injected with LPS (25 μg/g) on day 3 (n=6). q–s, GSDMD, caspase-11 and β-actin in the liver and spleen (q) and IL-18 and IL-1β in the plasma (r,s; n=6) of WT mice pretreated with DMSO (2.5 μg/g) or Nexinhib20 (25 μg/g) on days 1 and 2 and injected with LPS (25 μg/g) on day 3 for 8 h. Each circle represents a mouse, and the horizontal lines represent mean (l,n,r,s). Each lane represents a mouse (q). Data are presented as mean±s.e.m (b,d,f,h,j,k). Combined data from two (k–p,r,s) or three (b,d,f,h,j) experiments or one experiment representative of two (a,c,e,g,i,q) are shown. P values were determined by one-way ANOVA with Dunnett’s post-test (b,j,n), two-way ANOVA with Sidak’s post-test (d,f,h,k), unpaired two-tailed t-test (l,r,s) or Mantel-Cox test (m,o,p).
Extended Data Fig. 8:
Extended Data Fig. 8:. EV binding of LPS is not mediated by common LPS binding proteins.
a–d, LPS binding by EVs preincubated with isotype control, anti-HMGB1 or anti-LBP antibodies (Ab) and incubated with FITC-LPS (500 μg) at 37 oC for 45 min as assessed by ImageStream flow cytometry (a,c) and the HEK-Blue TLR4 reporter cell assay (b,d). Combined data from three experiments are shown, and the horizontal lines represent mean. P values were determined by unpaired two-tailed t-test.
Extended Data Fig. 9:
Extended Data Fig. 9:. EV binding of LPS is not mediated by EV surface proteins.
a,b, Immunoblotting (a) and negative staining TEM (b) of unshaved EVs and EVs subjected to surface protein shaving with trypsin (shaved EVs). c,d, Unshaved and shaved EVs incubated with FITC-LPS at 37 oC for 45 min were subjected to NTA (c), and the HEK-Blue TLR4 reporter cell assay (d). e,f, Percentage of FITC-LPS+ve EVs (e) and FITC MFI (f) of EVs isolated from FITC-LPS-injected mice and subjected or not to surface-protein shaving (n=3). Combined data from three (c,d) or four (e,f) experiments or one experiment representative of two (a,b) are shown, and horizontal lines represent mean (c–f). P values were determined by unpaired two-tailed t-test.
Extended Data Fig. 10:
Extended Data Fig. 10:. LPS-bound EVs colocalize with CD14.
a,b, Casp11−/− iBMDMs were stimulated with FITC-LPS-EVs unlabeled (a) or labeled with CellBrite Steady 550 dye (b). After 4 h, cells were stained with anti-CD14, anti-EEA1, and anti-FITC antibodies and subjected to confocal imaging. In (b), light blue arrows indicate colocalization of FITC-LPS-EVs (CellBrite-labeled) with CD14 (top two rows) and their internalization (bottom two rows). Images are representative of two experiments. Scale bar, 5 µm (a,b).
Fig. 1:
Fig. 1:. Circulating host-derived EVs capture LPS.
a, Nanoparticle tracking analysis (NTA) of the size distribution of EVs isolated from the plasma of wild-type (WT) mice injected with PBS or LPS (25 mg/kg) 1.5 h post-injection via ultracentrifugation. b, Immunoblotting analysis of EVs isolated from the plasma of PBS- or LPS-injected WT mice for CD9 and CD63. c, Negative staining transmission electron microscopy (TEM) of EVs isolated from the plasma of PBS- or LPS-injected WT mice as in (a). d,e, LPS content of the EVs isolated from WT mice injected with PBS, LPS or FITC-LPS (25 mg/kg) 1.5 h post-injection via ultracentrifugation as assessed by the LAL (n=4) (d) and HEK-Blue TLR4 reporter cell (e) assays (n=4). f,g, Percentage of FITC-LPS+ve EVs (f) and FITC histogram and mean fluorescence intensity (MFI) of EVs (g) isolated from mice injected with unlabeled LPS or FITC-LPS 1.5 h post-injection via ultracentrifugation as assessed by ImageStream flow cytometry (n=6). h, TEM of EVs isolated from the plasma of mice injected with PBS- or biotin-LPS 1.5 h post-injection and stained with streptavidin-gold particles. Arrows indicate LPS. i,j, Percentage of FITC-LPS+ve EVs (i) and FITC MFI of EVs (j) isolated from WT and Casp11−/− mice injected with PBS or FITC-LPS 1.5 h post-injection via ultracentrifugation as assessed by ImageStream flow cytometry (n=3). k,l, LPS content of the EVs isolated from WT and Casp11−/− mice injected with PBS or FITC-LPS 1.5 h post-injection via ultracentrifugation as assessed by the LAL (k) and HEK-Blue TLR4 reporter cell (l) assays (n=3). Combined data from three (i–l) four (d,e) or six (f,g) independent experiments or data from one experiment of representative of two (b,c and h) or three (a) are shown. Each circle represents a mouse, and the horizontal lines represent the mean (d–g,i–l). P values were determined by unpaired two-tailed t-test (d–g), one-way ANOVA with Dunnett’s post-test (i–l). Scale bar, 50 nm (c,h).
Fig. 2:
Fig. 2:. Host-derived EVs bind LPS in vivo.
a, Nanoparticle tracking analysis (NTA) of the size distribution of EVs isolated from the plasma of wild-type (WT) mice injected with PBS or LPS (25 mg/kg) 1.5 h post-injection via the IZON qEV column-based size exclusion chromatography (SEC). b, Immunoblotting analysis of EVs isolated as described above for CD9 and CD63. c, Negative staining TEM of EVs isolated from the plasma of PBS- or LPS-injected WT mice as described above. d,e, LPS content of the EVs isolated from PBS- or FITC-LPS-injected mice by the SEC method 1.5 h post-injection as assessed by the LAL (d; n=10) and HEK-Blue TLR4 reporter cell (e; n=7) assays. f,g, Percentage of FITC-LPS+ve EVs (f) and FITC histogram and mean fluorescence intensity (MFI) of EVs (g) isolated from mice injected with PBS or FITC-LPS as assessed by ImageStream analysis (n=6). h, TEM of EVs isolated as described above and stained with gold-conjugated anti-FITC antibody. Arrows indicate LPS. i, LPS content of the EVs isolated from WT and Casp11−/− mice injected with PBS or FITC-LPS (25 mg/kg) 1.5 h post-injection via SEC as assessed by the LAL assay (n=4). j,k, Percentage of FITC-LPS+ve EVs (j) and FITC MFI of EVs (k) isolated from WT and Casp11−/− mice injected with PBS or FITC-LPS 1.5 h post-injection via SEC as assessed by ImageStream flow cytometry (n=3). Combined data from three (j,k) four (i), six (f,g) or seven (d,e) independent experiments or data from one experiment representative of two (a–c,h) are shown. Each circle represents a mouse, and the horizontal lines represent the mean (d–g,i–k). P values were determined by unpaired two-tailed t-test (d–g) or one-way ANOVA with Dunnett’s post-test (i,j,k). Scale bar, 50 nm (c,h).
Fig. 3:
Fig. 3:. Cytosolic delivery of LPS by host-derived EVs.
a,b, LPS levels in the cytosol extracted from Casp11−/− BMDMs stimulated for 15 h with purified LPS, PBS-EVs, or LPS-EVs as assessed by the LAL (a) and HEK-Blue TLR4 reporter cell (b) assays (n=3). c,d, Confocal microscopy of Casp11−/− iBMDMs stimulated for 5–6 h with PBS-EVs or FITC-LPS-EVs and stained with anti-CD45 and anti-FITC antibodies to visualize plasma membrane and LPS, respectively (c) and the quantification of FITC intensity (d). e, TEM of Casp11−/− iBMDMs stimulated for 15 h with PBS-EVs, FITC-LPS, or FITC-LPS-EVs and stained with gold-conjugated anti-FITC antibody. Arrows indicate cytosolic localization of LPS. f, LPS levels in the cytosol of splenic myeloid cells from Casp11−/− mice injected with PBS-EVs or FITC-LPS-EVs 5 h post-injection as assessed by the LAL assay (n=3). g,h, ImageStream flow cytometric analysis of intracellular localization of LPS in peritoneal lavage cells of PBS-EV- or FITC-LPS-EV-injected Casp11−/− mice 5 h post-injection stained with anti-CD45 and anti-FITC antibodies (g) to visualize the plasma membrane and LPS, respectively and the quantification of intracellular FITC intensity (h). i, TEM of peritoneal lavage cells isolated from PBS-EV- or FITC-LPS-EV-injected Casp11−/− mice and stained with gold-conjugated anti-FITC antibody. Arrows indicate cytosolic localization of LPS. j,k, ImageStream flow cytometric analysis of intracellular localization of LPS in splenic endothelial cells isolated from PBS-EV- or FITC-LPS-EV-injected Casp11−/− mice 5 h post-injection and stained with anti-CD31 and anti-FITC antibodies (j) to visualize the plasma membrane and LPS, respectively and the quantification of intracellular FITC intensity (k). l, LPS levels in the cytosol of splenic endothelial cells isolated from PBS-EV- or FITC-LPS-EV-injected Casp11−/− mice 5 h post-injection as assessed by the LAL assay (n=4). Combined data from two (c,d,g,h,i) or three (a,b,e,f,j,k,l) independent experiments are shown. Each circle represents a mouse (f,l), cell (d,h,k), or individual experiments (a,b) and the horizontal lines represent the mean. P values were determined by one-way ANOVA with Dunnett’s post-test (a,b) or unpaired two-tailed t-test (d,f,h,k,l). Scale bar, 5 µm (c) or 200 nm (e,i). BF, brightfield.
Fig. 4:
Fig. 4:. EV-mediated cytosolic LPS delivery activates the noncanonical inflammasome.
a,b, GSDMD (FL, full length; NT, N-terminal domain), caspase-11 and β-actin in the lysates (a) and cell death (LDH release; b) of IFN-γ-primed (10 ng/ml) WT BMDMs stimulated with medium, varying doses of PBS-EVs or LPS-EVs (6.25–50 μg/ml), LPS or LPS transfection for 16 h. c,d, GSDMD, caspase-11, and GAPDH in the lysates (c) and cell death (LDH release; d) of IFN-γ-primed (10 ng/ml) WT and Casp11−/− BMDMs stimulated as indicated for 16 h. e, GSDMD, caspase-11, and β-actin in the lysates of spleen and liver of poly(I:C)-primed (150 μg) WT mice injected i.p with SEC-isolated PBS-EVs or LPS-EVs for 15 h (n=3). f–i, IL-18 (f), IL-1β (g) , IL-1α (h) and galectin-1 (i) in the plasma of poly(I:C)-primed WT mice injected with SEC-isolated PBS-EVs or LPS-EVs for 15 h (n=9). j,k, IL-18 and IL-1β in the plasma of poly(I:C)-primed WT mice injected with UC-isolated PBS-EVs or LPS-EVs for 6 h (n=7). l,m, IL-18 and IL-1β in the plasma of poly(I:C)-primed WT mice administered with UC-isolated EVs from LPS-injected WT and Casp1/11−/− mice (n=4). n, GSDMD, caspase-11, and β-actin in the lysates of liver and spleen of poly(I:C)-primed WT and Casp11−/− mice injected with SEC-isolated LPS-EVs for 15 h (n=3). o,p, IL-18 and IL-1β in the plasma of WT and Casp11−/− mice treated as described in (n) (n=6). q, Survival of poly(I:C)-primed WT and Casp11−/− mice injected with SEC-isolated LPS-EVs (n=9). Combined data from two (j–m,o,p) or three (b,d,f,g,h,i,q) independent experiments or representative data of two (a,c,n) or three (e) experiments are shown. Each circle represents a mouse and the horizontal lines represent the mean (f-m,o,p). Each lane represents a mouse (e,n). Data are presented as mean±s.e.m (b,d). P values were determined by unpaired two-tailed t-test (f-m,o,p), one-way ANOVA with Dunnett’s post-test (b), two-way ANOVA with Sidak’s post-test (d) or Mantel-Cox test (q).
Fig. 5:
Fig. 5:. The effect of EV depletion on intracellular LPS sensing.
a, Mice were injected with DMSO or the EV inhibitor (2.5 μg/g GW4869) on days 1 and 2, and plasma numbers of EVs were measured by NTA on day 3 (n=6). b,c, LPS levels in the cytosol of splenic myeloid cells from Casp11−/− mice pretreated with DMSO or GW4869 as described in (a) and injected i.p. with FITC-LPS on day 3 for 5 h as assessed by the LAL (b) and HEK-Blue TLR4 reporter cell (c) assays (n=7). d,e, ImageStream analysis of intracellular LPS in splenic myeloid cells isolated from Casp11−/− mice pretreated with DMSO or GW4869 as in (a) and injected with FITC-LPS on day 3 and stained with anti-CD45 and anti-FITC antibodies (d) and the quantification of intracellular FITC intensity (e). f, TEM of peritoneal lavage cells isolated from Casp11−/− mice pretreated with DMSO or GW4869 on days 1 and 2 and injected i.p. with FITC-LPS on day 3 and stained with gold-conjugated anti-FITC antibody. Arrows indicate cytosolic localization of LPS. g–i, GSDMD and caspase-11 in the liver and spleen (g; n=3) and IL-18 and IL-1β in the plasma (h,i; n=8) of WT mice pretreated with DMSO or GW4869 as in (a) and injected i.p. with LPS on day 3 for 8 h. (j–l) GSDMD, caspase-11 and β-actin in the liver and spleen (j; n=3) and IL-18 and IL-1β in the plasma (k,l; n=8) of WT mice pretreated with DMSO or GW4869 as in (a) and injected i.p. on day 3 with LPS or LPS followed by LPS-EVs 2 h later. Combined data from two or three independent experiments (a–c,h,i,k,l) or a representative experiment of two (d,e,f) or three (g,j) are shown. Each circle represents a mouse (a,b,c,h,i,k,l) or cell (e) and the horizontal lines represent the mean. Each lane represents a mouse (g,j). P values were determined by unpaired two-tailed t-test (a,b,c,e,h,i) or one-way ANOVA with Dunnett’s post-test (k,l). Scale bar: 200 nm (f). BF, brightfield.
Fig. 6:
Fig. 6:. The EV lipid bilayer-lipid A interaction underlies EV capture of LPS
a–c, LPS binding by EVs isolated from WT and Tlr4−/−Cd14−/− mice and incubated in vitro with FITC-LPS for 45 min followed by SEC re-purification as assessed by the LAL (n=3) (a) and ImageStream (n=3) (b,c) analysis. d,e, Percentage of FITC-LPS+ve EVs (d) and FITC MFI (e) of EVs isolated from FITC-LPS-injected WT and Tlr4−/−Cd14−/− mice (n=3). f–i, LPS binding by EVs preincubated with isotype, anti-HMGB1 (f,g), or anti-LBP (h,i) antibodies (Ab) and incubated with FITC-LPS for 45 min followed by SEC re-purification as assessed by the LAL (n=4) (f,h) and ImageStream (n=3) (g,i) analysis. j,k, LPS binding by unshaved and surface protein-shaved EVs incubated with FITC-LPS followed by SEC re-purification as assessed by the LAL (n=3) (j) and ImageStream (n=3) (k) analysis. l–n, LPS binding by EV mimic liposomes incubated with PBS or biotin-LPS for 45 min as assessed by the LAL (l; n=4) and ImageStream analysis (Percentage of biotin-LPS+ve EV mimic liposomes (m; n=4) and streptavidin-FITC MFI of EV mimic liposomes (n; n=3)). o,p, Percentage of FITC-LPS+ve EV mimic liposomes (o; n=6) and FITC MFI of EV mimics (p; n=5) isolated from mice 1.5 h post-injection with DiD-labeled EV mimics followed by FITC-LPS. q, Cell death in indicated BMDMs stimulated as indicated for 16 h. r–t, The LAL (r) and ImageStream analysis [streptavidin-FITC+ve EVs (s) and streptavidin-FITC-MFI (t)] of EVs incubated with biotin-LPS or biotin-lipid A for 45 min followed by SEC re-purification (n=4). u–x, Lipid A binding by unshaved and surface protein-shaved EVs (u,v) or EV mimic liposomes (w,x) incubated with PBS or lipid A for 45 min followed by SEC re-purification as assessed by the LAL (u,w) and TLR4 reporter (v,x) assays (n=3). Combined data from two (o,p), three (a–e,g,i,j,k,n,q,u–x) or four (f,h,l,m,r,s,t) independent experiments are shown. Horizontal lines represent the mean (a–p,r–x). Data are presented as mean±s.e.m (q). P values were determined by unpaired two-tailed t-test (a-p, r–x) or two-way ANOVA with Sidak’s post-test (q).
Fig. 7:
Fig. 7:. EV-mediated cytosolic delivery of LPS is CD14-dependent.
a,b, LPS levels in the cytosol of splenic myeloid cells from WT and Cd14−/− mice injected with FITC-LPS-EVs for 5 h as assessed by the LAL (a) and HEK-TLR4 reporter cell (b) assays (n=3). c,d, ImageStream flow cytometric analysis of intracellular localization of LPS in splenic myeloid cells of FITC-LPS-EV-injected WT and Cd14−/− mice and stained with anti-CD45 and anti-FITC antibodies (c) and the quantification of intracellular FITC intensity (d). e, TEM of splenic myeloid cells isolated from FITC-LPS-EV-injected WT and Cd14−/− mice and stained with gold-conjugated anti-FITC antibody. Arrows indicate cytosolic localization of LPS. f–j, GSDMD, caspase-11 and β-actin in the spleen (f; n=3) and IL-18, IL-1β, IL-1α and galectin-1 in the plasma (g–j; n=6) of IFN-γ (1 μg)-primed WT and Cd14−/− mice injected with LPS-EVs for 6 h. k, Working model for the host EV capture and cytosolic release of LPS and noncanonical inflammasome activation (created with Adobe Illustrator and BioRender.com). Combined data from two (g–j) or three (a,b) independent experiments or representative data of two (c–f) independent experiments are shown. Each circle represents a mouse (a,b,g–j) or cell (d) and the horizontal lines represent the mean. Each lane represents a mouse (f). P values were determined by unpaired two-tailed t-test. Scale bar, 200 nm (e). BF, brightfield.

References

    1. Gabanyi I et al. Bacterial sensing via neuronal Nod2 regulates appetite and body temperature. Science 376, eabj3986 (2022). - PubMed
    1. Clarke TB et al. Recognition of peptidoglycan from the microbiota by Nod1 enhances systemic innate immunity. Nat Med 16, 228–231 (2010). - PMC - PubMed
    1. Farrokhi V et al. Bacterial lipodipeptide, Lipid 654, is a microbiome-associated biomarker for multiple sclerosis. Clin Transl Immunol 2, e8 (2013). - PMC - PubMed
    1. Huang Z et al. Antibody neutralization of microbiota-derived circulating peptidoglycan dampens inflammation and ameliorates autoimmunity. Nat Microbiol 4, 766–773 (2019). - PubMed
    1. Moltke J von, Ayres, J. S., Kofoed, E. M., Chavarría-Smith, J. & Vance, R. E. Recognition of Bacteria by Inflammasomes. Annu Rev Immunol 31, 73–106 (2013). - PubMed

Publication types