. 2023 Nov;5(11):1911-1930.
doi: 10.1038/s42255-023-00916-6. Epub 2023 Nov 16.

Vitamin B12 is a limiting factor for induced cellular plasticity and tissue repair

Affiliations

Vitamin B12 is a limiting factor for induced cellular plasticity and tissue repair

Marta Kovatcheva et al. Nat Metab. 2023 Nov.

Abstract

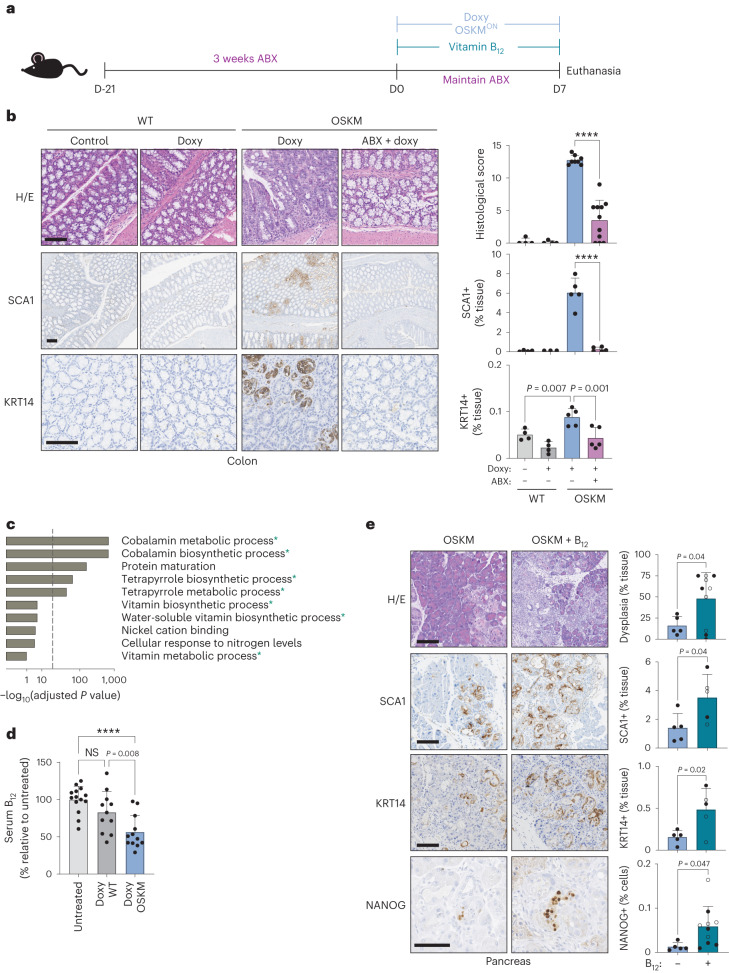
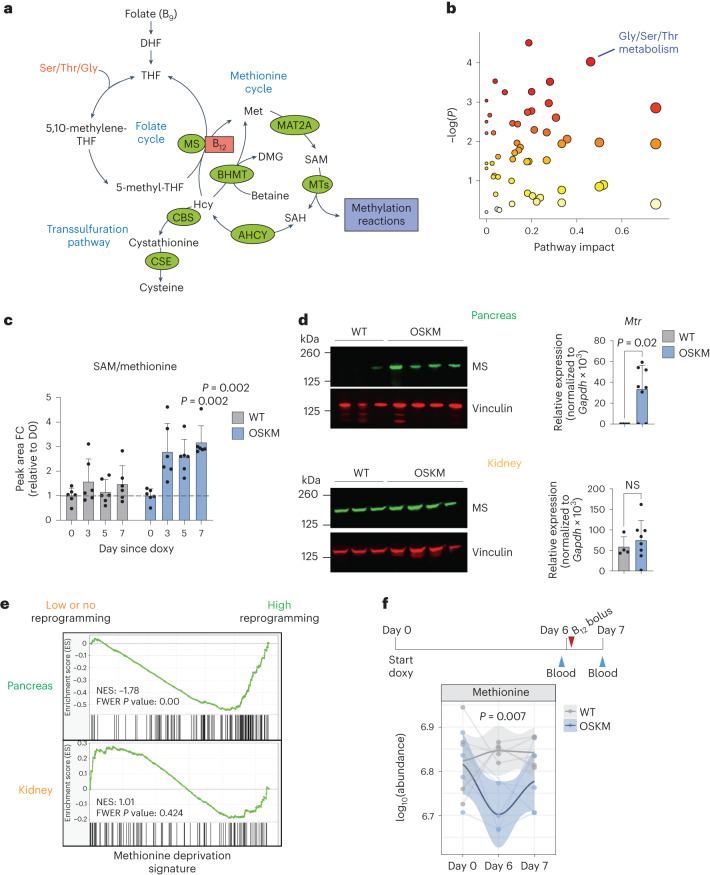
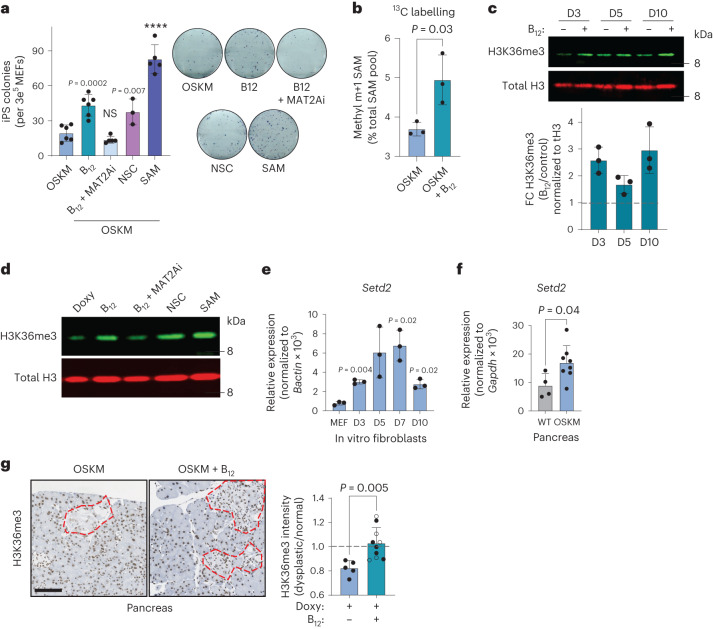
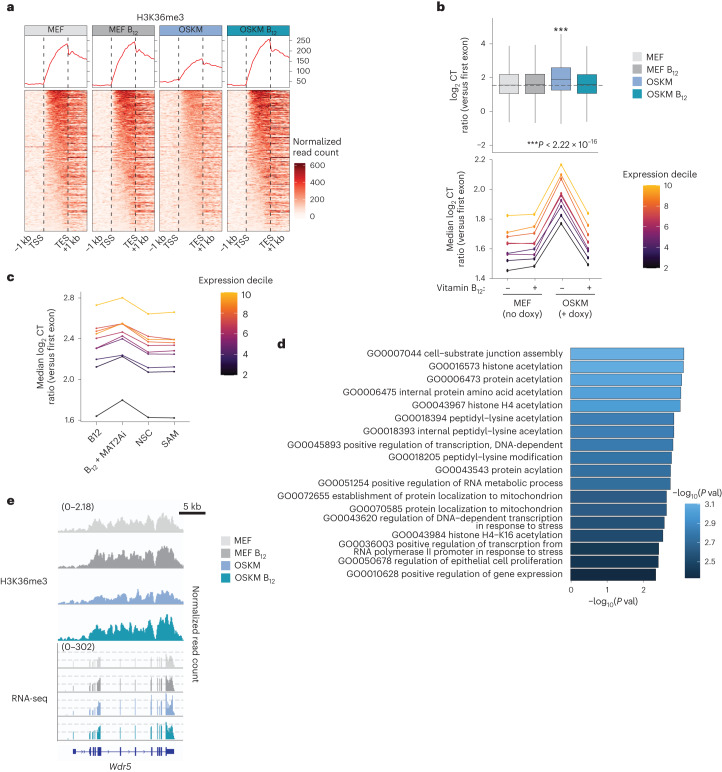
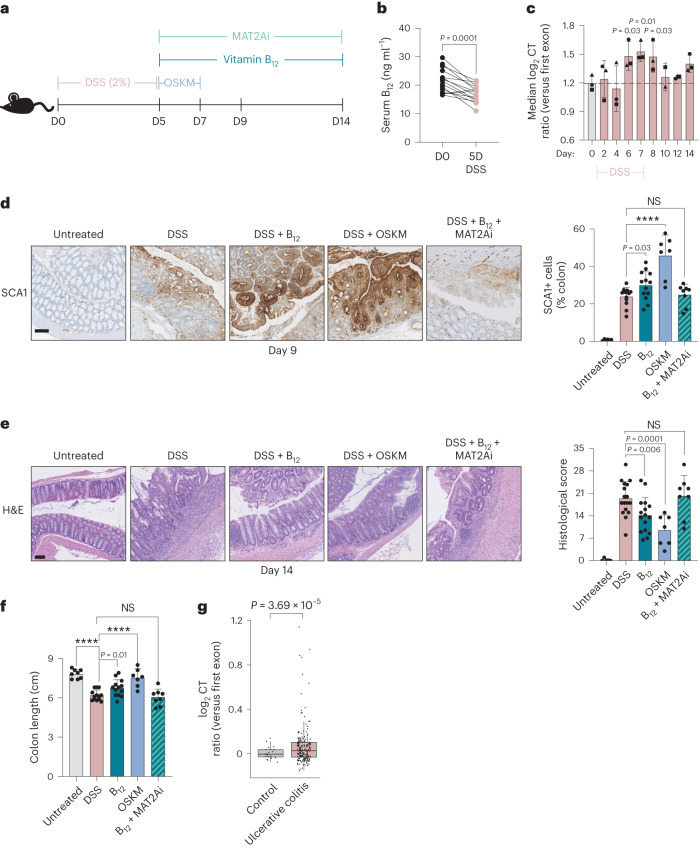
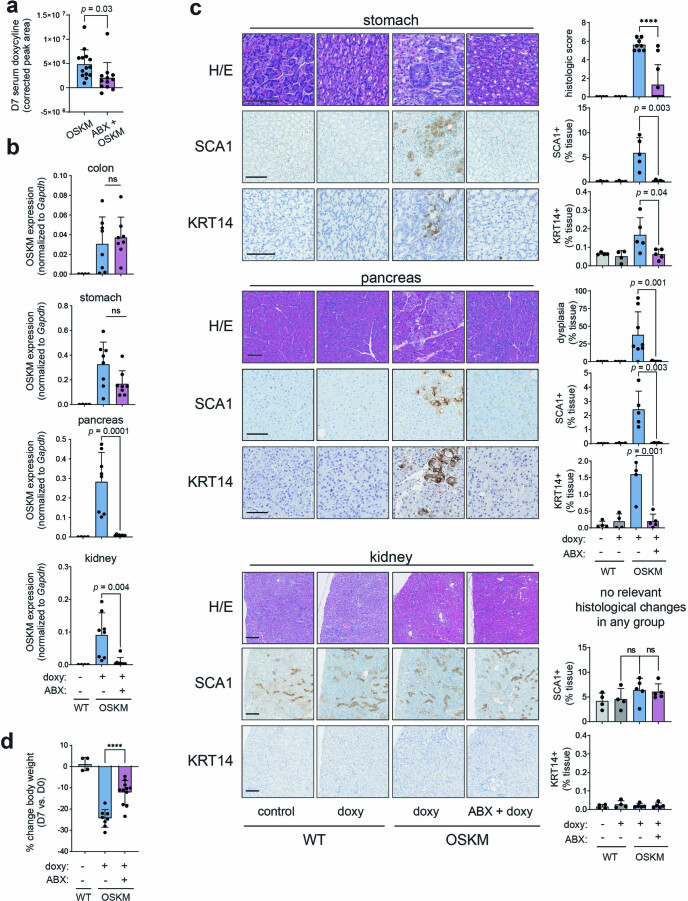
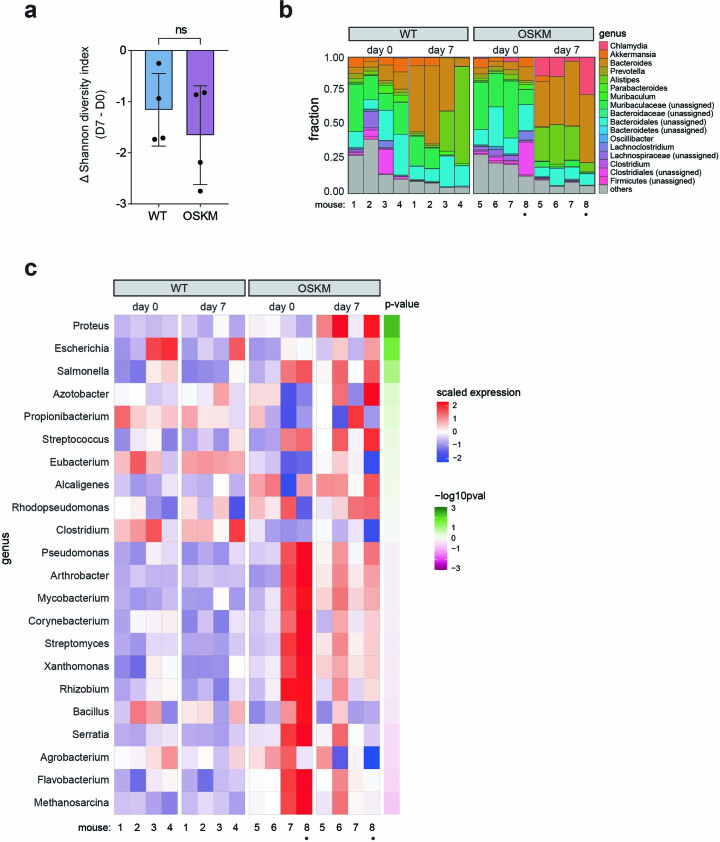
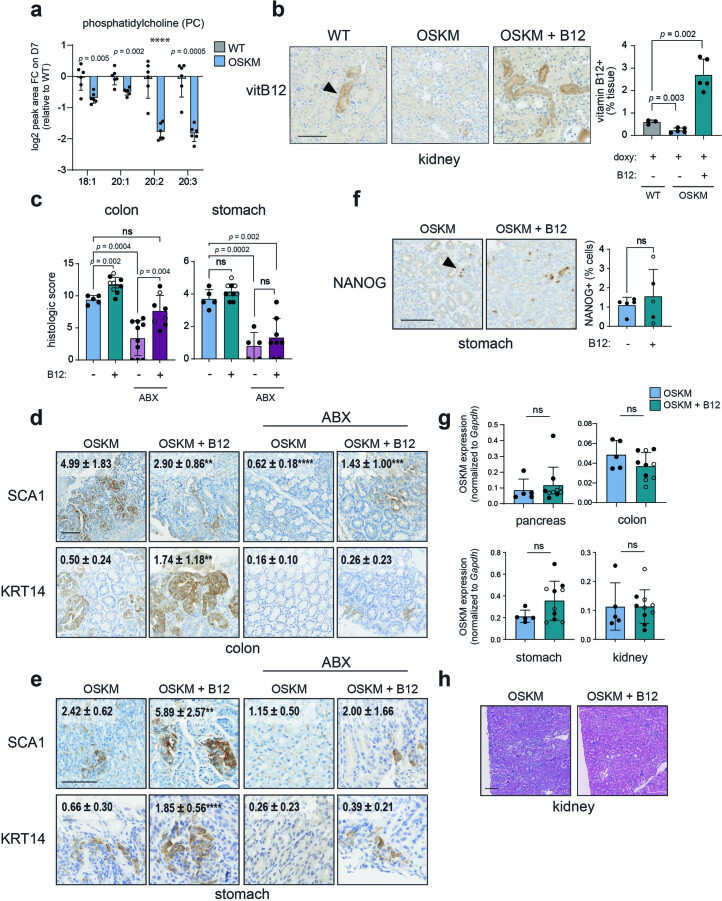
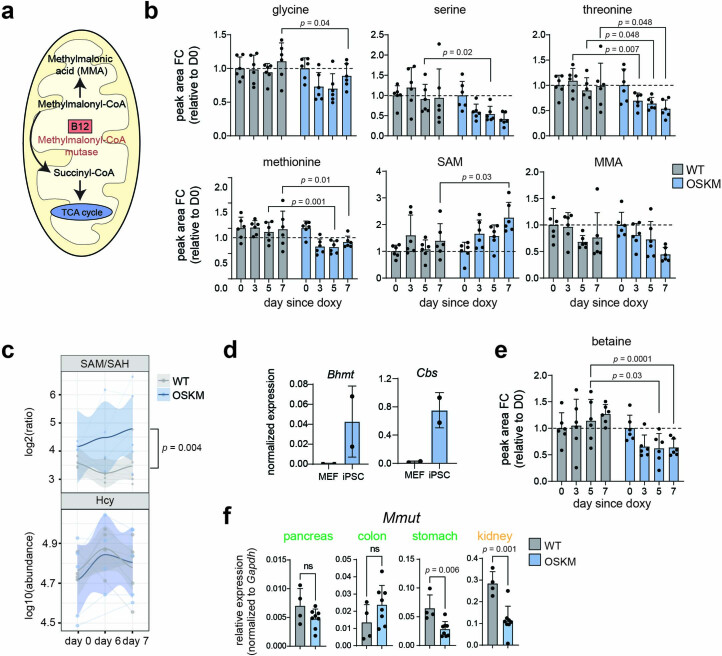
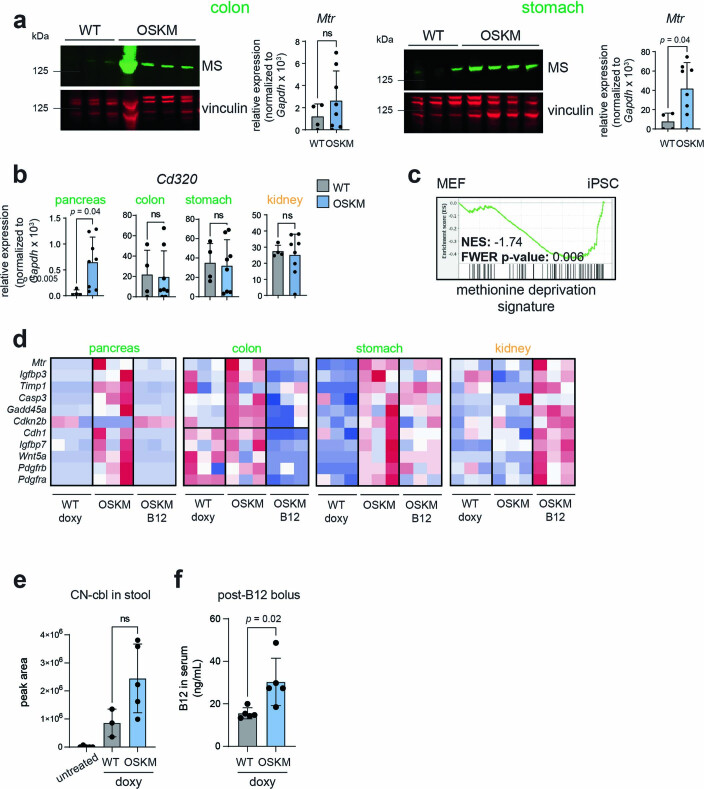
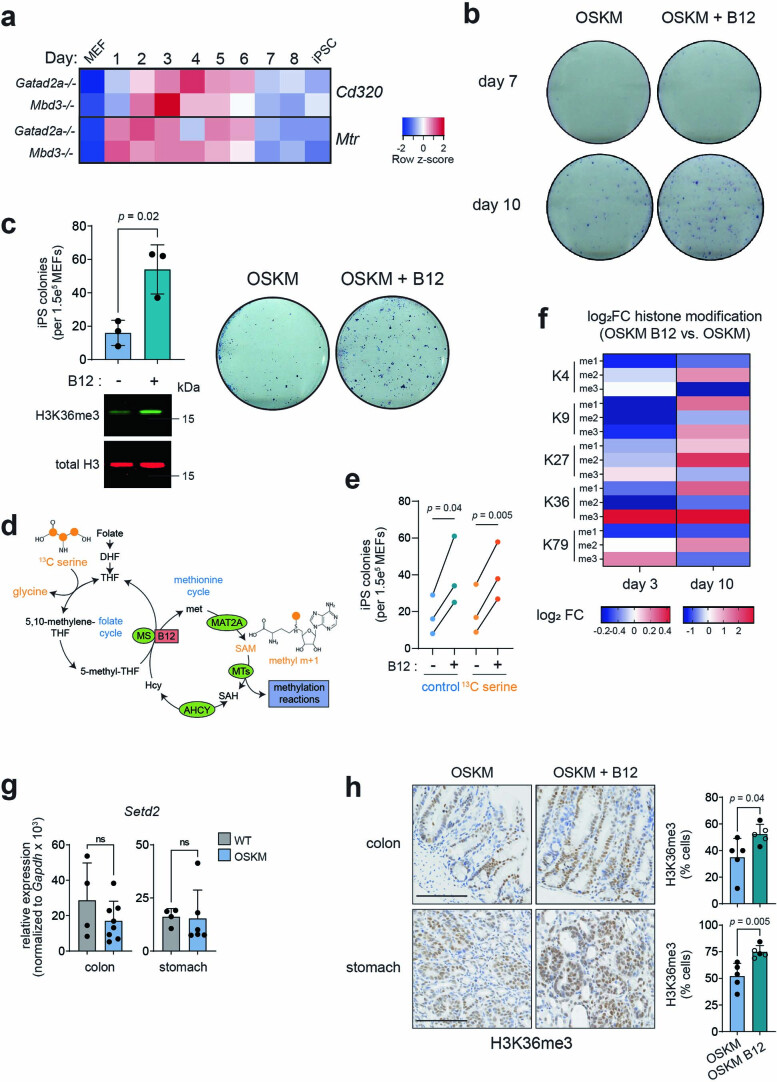
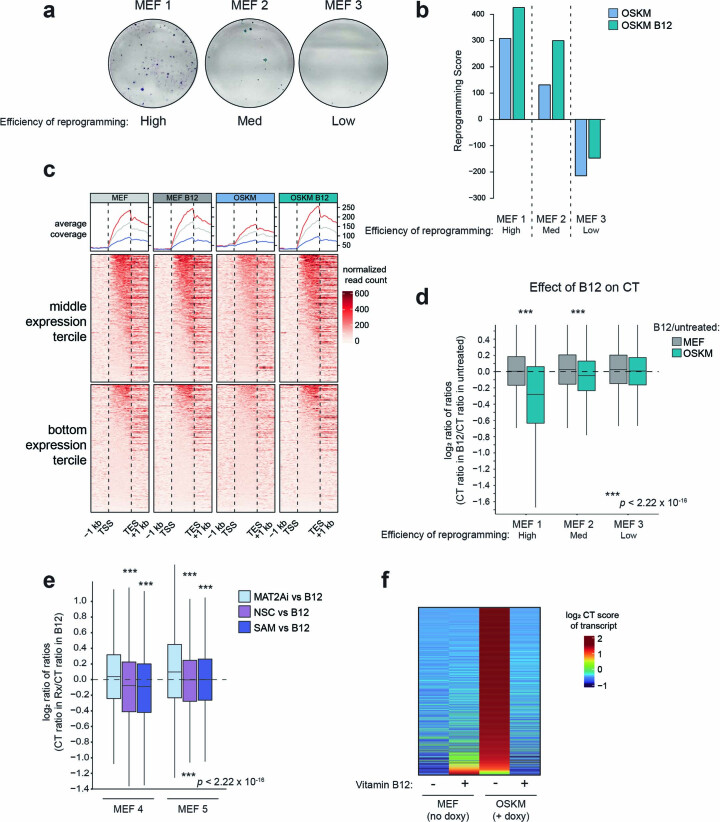
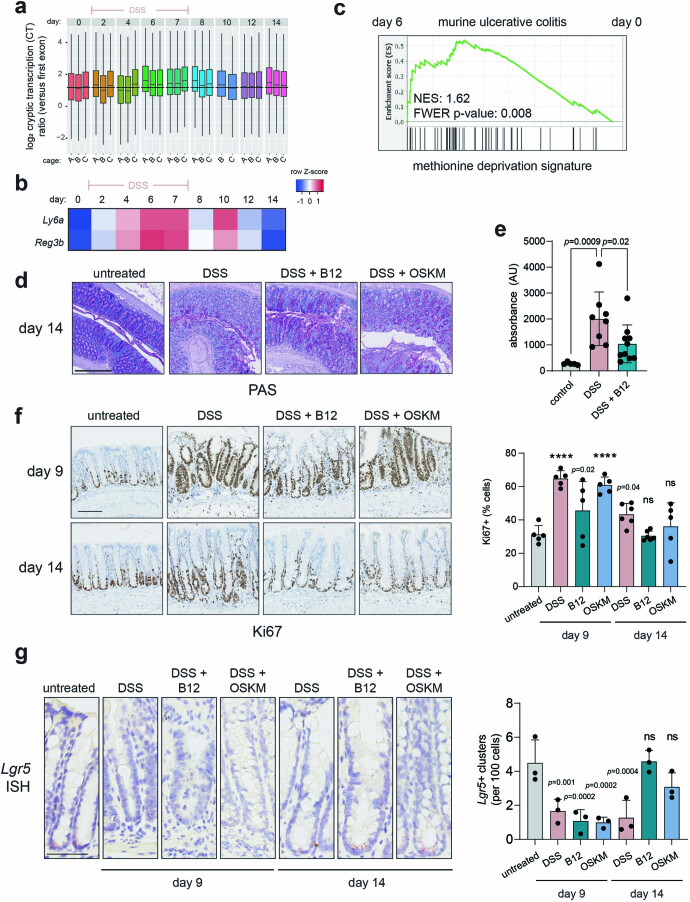
Transient reprogramming by the expression of OCT4, SOX2, KLF4 and MYC (OSKM) is a therapeutic strategy for tissue regeneration and rejuvenation, but little is known about its metabolic requirements. Here we show that OSKM reprogramming in mice causes a global depletion of vitamin B12 and molecular hallmarks of methionine starvation. Supplementation with vitamin B12 increases the efficiency of reprogramming both in mice and in cultured cells, the latter indicating a cell-intrinsic effect. We show that the epigenetic mark H3K36me3, which prevents illegitimate initiation of transcription outside promoters (cryptic transcription), is sensitive to vitamin B12 levels, providing evidence for a link between B12 levels, H3K36 methylation, transcriptional fidelity and efficient reprogramming. Vitamin B12 supplementation also accelerates tissue repair in a model of ulcerative colitis. We conclude that vitamin B12, through its key role in one-carbon metabolism and epigenetic dynamics, improves the efficiency of in vivo reprogramming and tissue repair.


Conflict of interest statement

G.K. holds research contracts with Daiichi Sankyo, Eleor, Kaleido, Lytix Pharma, PharmaMar, Osasuna Therapeutics, Samsara Therapeutics, Sanofi, Tollys and Vascage. G.K. is on the Board of Directors of the Bristol Myers Squibb Foundation France. G.K. is a scientific cofounder of everImmune, Osasuna Therapeutics, Samsara Therapeutics and Therafast Bio. G.K. is on the scientific advisory boards of Hevolution, Institut Servier and Longevity Vision Funds. G.K. is the inventor of patents covering therapeutic targeting of aging, cancer, cystic fibrosis and metabolic disorders. G.K.’s wife, L. Zitvogel, has held research contracts with Glaxo Smyth Kline, Incyte, Lytix, Kaleido, Innovate Pharma, Daiichi Sankyo, Pilege, Merus, Transgene, 9 m, Tusk and Roche, was on the on the Board of Directors of Transgene, is a cofounder of everImmune, and holds patents covering the treatment of cancer and the therapeutic manipulation of the microbiota. G.K.’s brother, R. Kroemer, was an employee of Sanofi and now consults for Boehringer-Ingelheim. M.K. has ongoing or completed research contracts with Galapagos, Rejuveron Senescence Therapeutics and Mesoestetic. D.C. is an employee of Fenix Group International. M.S. is shareholder of Senolytic Therapeutics, Life Biosciences, Rejuveron Senescence Therapeutics, and Altos Labs. M.S. was consultant until the end of 2022 of Rejuveron Senescence Therapeutics and Altos Labs. The funders had no role in study design, data collection and analysis, decision to publish, or preparation of the manuscript. The other authors declare no competing interests.

Figures

Fig. 1
Fig. 1. In vivo OSKM reprogramming requires the gut microbiota and is enhanced by vitamin B12 supplementation.
a, Mice were pretreated with an antibiotic cocktail administered in the drinking water for 3 weeks (ABX) before, and during, 7 d of doxycycline administration (doxy), with or without vitamin B12 supplementation according to the schematic. b, Representative histology images and quantification of a blinded histological score, SCA1 staining and KRT14 staining. n = 4 mice (WT; 3 M 1 F), n = 8 (OSKM + doxy; 4 M 4 F), n = 11 (OSKM + doxy + ABX 4 M 7 F); a representative subset of animals was analysed for SCA1 and KRT14. Scale bar, 100 µm. c, GO pathway analysis of differentially abundant microbial gene signatures in the metagenome sequencing of stool samples. Changes in microbial gene abundance between day 7 and day 0 were compared in a subset of WT (n = 4; 2 M 2 F) and OSKM (n = 4; 2 M 2 F) mice from b. See Supplementary Table 1 for complete gene list. The overlap between GO terms and the 200 most differentially depleted or enriched genes was scored using standard hypergeometric tests and GO terms above a threshold of 30% FDR are shown (for all GO terms, see Supplementary Table 2). Processes marked with an asterisk are directly related to cobalamin metabolism. Dashed line indicates 5% FDR cut-off. d, Serum holoTC (biologically available vitamin B12) levels as measured by ADVIA immunoassay in untreated mice or WT and OSKM mice treated with doxycycline for 7 d. n = 14 mice (untreated; 6 M 8 F), n = 11 (doxy WT doxy; 7 M 4 F), n = 12 (doxy OSKM doxy; 6 M 6 F). e, OSKM mice received vitamin B12 supplementation co-administered with doxycycline as indicated and representative images and quantification are shown for the indicated markers in the pancreas. Mice marked by an open circle received both B12 and folate (B9) supplementation (not significant (NS) difference for B12 versus B12 + folate; see text for details). n = 5 mice (OSKM; 2 M 3 F), n = 10 mice (OSKM + B12; 4 M 6 F); a representative subset of n = 5 animals per group was analysed for SCA1 and KRT14. Scale bars, 100 µm. Bar graphs represent the average ± s.d.; ****P < 0.0001 by two-tailed Student’s t-test. Source data
Fig. 2
Fig. 2. Tissues undergoing in vivo reprogramming exhibit an increased demand of 1C metabolism.
a, Summary of the mammalian folate and methionine cycles (1C metabolism) and the transsulfuration pathway. Enzymes are marked in green. Coenzyme vitamin B12 is marked in red. DHF, dihydrofolate; THF, tetrahydrofolate; MTs, methyltransferases; ACHY, adenosylhomocysteinase; CSE, cystathionine gamma-lyase; DMG, dimethylglycine; Ser, serine; Thr, threonine; Gly, glycine. Figure adapted from ref. , Springer Nature Limited. b, Changes in metabolic pathways during reprogramming. MetaboAnalyst (4.0) was used to assess the annotated metabolites identified in the serum of paired OSKM mice (n = 6; 3 M 3 F) at day 5 versus day 0 of doxycycline treatment (serum was collected repeatedly from the same mice). Colour gradient from white to red indicates the P value; red is most significant. Gly/Ser/Thr metabolism (KEGG map00260) is highlighted. See Supplementary Table 3 for all metabolites, pathways and scores. c, Fold change (FC) of SAM/Met ratio detected by mass spectrometry from b on the indicated days. P values represent significant difference between OSKM and WT mice. d, Levels of MS (encoded by Mtr) by immunoblot and RT–qPCR in the pancreas (upper) and kidney (lower) from WT (n = 4; 3 M 1 F) and OSKM (n = 8; 4 M 4 F) mice treated with doxycycline for 7 d. Representative mice are shown in the immunoblot. e, Previously published RNA-seq data from the pancreas (highly prone to reprogramming; green) and kidney (refractory to reprogramming; orange) of OSKM-Cdk2na/(low or absent reprogramming) and OSKM-Tp53−/− (high reprogramming) mice were used to perform GSEA against a published signature (MsigDB: M13537) of Met deprivation. f, WT and OSKM mice (n = 5 per group; 5 M) were treated with doxycycline and a bolus of vitamin B12 as shown in the schematic. Met levels were measured in the indicated serum samples by mass spectrometry. Only n = 4 WT (day 0) and OSKM (day 6) mice are represented, as the blood volume was insufficient. Welch’s two-sample t-test was used to evaluate differences between groups on day 6. Bar graphs represent the average ± s.d.; P values determined by a two-tailed Student’s t-test. Source data
Fig. 3
Fig. 3. Vitamin B12 supplementation enhances H3K36me3 and has a cell-autonomous role in reprogramming.
a, In vitro reprogramming of MEFs with doxycycline-inducible OSKM for 10 d in the presence of doxycycline (OSKM) and/or vitamin B12, MAT2Ai, KDM4A/KDM4B inhibition (NSC), or SAM as indicated, cultured in KSR. iPS cell colonies were quantified by alkaline phosphatase staining (left) and representative images are shown (right). Each data point represents MEFs generated from an independent embryo (n = 6 OSKM, B12; n = 5 B12 + MAT2Ai, SAM; n = 3 NSC). b, Fraction of total intracellular SAM 13C-labelled at the methyl m + 1 position (Extended Data Fig. 6d), using 13C-serine as a precursor. Labelling was initiated at t = 72 h for 6 h. Data from n = 3 independent MEFs are shown. c, H3K36me3 dynamics during in vitro reprogramming. MEFs were treated with doxycycline with or without vitamin B12 as indicated. A representative immunoblot and quantification from n = 3 independent MEFs are shown. d, H3K36me3 level correlates with reprogramming efficiency in vitro. MEFs were treated as indicated and H3K36me3 levels were probed in histone extracts at day 3 after doxycycline treatment. A representative blot from n = 2 independent MEFs with similar results is shown. e,f, Expression of the H3K36 trimethyl-transferase Setd2 during in vitro (e) and in vivo pancreatic (f) reprogramming. In e, P values represent significant change from the parental MEFs (n = 3 MEFs). In f, samples were collected from WT (n = 4; 3 M 1 F) or OSKM (n = 8; 4 M 4 F) mice after 7 d of doxycycline treatment. g, H3K36me3 during in vivo reprogramming. Pancreatic tissue from OSKM mice treated with doxy (n = 5; 2 M 3 F) or doxy + B12 (n = 10; 4 M 6 F; Fig. 1) was stained for H3K36me3. Representative images are shown with dysplastic foci demarcated by red dashed lines. The mean nuclear optical density of the H3K36me3 stain is expressed as the ratio between the dysplastic region and the adjacent normal tissue for each mouse. Scale bar, 100 µm. Mice that received folate in addition to B12 are represented by open points. Graphs represent the average ± s.d.; ****P < 0.0001 by two-tailed Student’s t-test. Source data
Fig. 4
Fig. 4. Vitamin B12 supplementation reduces cryptic transcription during in vitro reprogramming.
a, H3K36me3 ChIP–seq was performed in MEF 1 (Extended Data Fig. 7) at 72 h after the addition of doxycycline and/or vitamin B12, as indicated. The normalized ChIP reads in gene bodies relative to all aligned reads are shown for the most highly expressed genes (top tercile). The trace of the ChIP signal is shown, where the y axis represents average coverage across genes. TSS, transcription start site; TES, transcription end site. See also Extended Data Fig. 7c. b, The level of CT in MEF 1 for all genes for which a score could be calculated is plotted globally, and as a function of gene expression level at t = 72 h, with or without continuous supplementation of vitamin B12 as indicated. The lower and upper hinges correspond to the first and third quartiles (the 25th and 75th percentiles). The upper and lower whiskers extend from the hinge to the largest and smallest values, respectively, no further than 1.5 times the interquartile range from the hinge. Asterisks represent two-tailed unpaired Wilcoxon test; no multiple-comparisons adjustment was performed. c, OSKM MEFs were cultured with doxycycline and additional compounds for 72 h as indicated and described in Fig. 3a. The median CT ratio for all genes for which a score could be calculated is plotted as a function of gene expression level. Values represent the median from n = 2 independent MEFs; for data from individual MEFs, see Extended Data Fig. 7e. d, Functional enrichment analysis was performed on the top 25% of genes whose CT increased between MEF and OSKM conditions, and decreased between OSKM and OSKM + B12 conditions in MEF 1 from a and b. The top enriched GO biological processes (P < 0.005) are shown. P values were determined by hypergeometric test; no multiple-comparisons adjustment was performed. e, H3K36me3 ChIP–seq and RNA-seq tracks from the Wdr5 gene from MEF 1 in the indicated conditions. For all plots, expression quantiles were determined by reads per kilobase per million mapped reads (RPKM) across all samples. Source data
Fig. 5
Fig. 5. Recovery from DSS colitis is improved by OSKM or vitamin B12.
a, Colitis was induced by DSS, followed by a 48-h pulse of OSKM or continuous administration of vitamin B12 during recovery, as indicated. MAT2Ai is FIDAS-5, a MAT2A inhibitor, given daily over the indicated time. b, Immunoassay of serum holoTC (biologically available vitamin B12) in paired mice before (D0) or following (D5) DSS administration (n = 15; 15 M); serum was collected repeatedly from the same mice. P value was determined by paired two-tailed Student’s t-test. c, CT in mouse colon tissue during DSS injury and recovery was determined from previously published RNA-seq. Data source: GSE131032 (ref. ). The median CT ratio for all genes for which a score could be calculated is shown. Each time point has 2–3 biological replicates, and symbol shapes indicate the same cage, as reported by the authors. P values were compared to the median CT at D0 as computed by two-tailed Student’s t-test; dashed line represents median CT value at D0. See also Extended Data Fig. 8a. d, SCA1 immunohistochemistry in colonic sections on day 9 after DSS with the indicated treatments. Representative images are shown and percentage of SCA1+ tissue area is quantified. Untreated control (n = 6; 3 M 3 F); DSS (n = 12; 8 M 4 F); DSS + vitamin B12 (n = 13; 9 M 4 F); DSS + 48 h OSKM (n = 7; 7 M); DSS + B12 + MAT2Ai (n = 8; 4 M 4 F). Graphs represent four pooled experiments, each of which had at least n = 3 each DSS and DSS + B12 controls. P values represent the difference as compared to DSS control animals by one-way ANOVA. e, Recovery of colonic homeostasis as scored by H&E on day 14 after DSS with the indicated treatments (representative images and quantification). Untreated control (n = 5; 5 M); DSS (n = 17; 11 M 6 F); DSS + vitamin B12 (n = 16; 10 M 6 F); DSS + 48 h OSKM (n = 7; 4 M 3 F); DSS + B12 + MAT2Ai (n = 8; 4 M 4 F). Graphs represent five pooled experiments, each of which had at least n = 3 each DSS and DSS + B12 controls. P values represent difference as compared to DSS control animals by one-way ANOVA. f, Colon length (caecum to rectum) on day 14 after DSS from mice with the indicated treatments. Untreated control (n = 8; 3 M 5 F); DSS (n = 13; 9 M 4 F); DSS + vitamin B12 (n = 13; 10 M 3 F); DSS + 48 h OSKM (n = 7; 4 M 3 F); DSS + B12 + MAT2Ai (n = 8; 4 M 4 F). P values as compared to DSS control animals by one-way ANOVA. g, CT in previously published RNA-seq of paediatric human rectal mucosal biopsy samples classified as ulcerative colitis (n = 206; 112 M 94 F) or control (n = 20; 9 M 11 F). Data source: GSE109142 (ref. ). Median CT value for all genes for which a score could be calculated is shown, where each dot represents one patient. The lower and upper hinges correspond to the first and third quartiles (the 25th and 75th percentiles), respectively. The upper (lower) whisker extends from the hinge to the largest (smallest) value no further than 1.5 times the interquartile range from the hinge. Data beyond the end of the whiskers are called ‘outlying’ points and are plotted individually. P value calculated by linear model with sex and quantiles as covariables; no multiple-comparisons adjustment was performed. Scale bars, 100 µm. Bar graphs represent the average ± s.d. ****P < 0.0001. Source data
Extended Data Fig. 1
Extended Data Fig. 1. Broad-spectrum antibiotic treatment inhibits in vivo reprogramming.
(a-d) Mice were treated with doxycycline (doxy) and antibiotics (ABX) as described in Fig. 1a. (a) Serum was harvested from OSKM mice after 7 days of doxycycline treatment (OSKM n = 14; 5 M 9 F), or after ABX + doxycycline treatment (ABX + OSKM n = 12; 3 M 9 F) and doxycycline levels were analyzed by mass spectrometry. The total area of the doxycycline peak corrected for background levels for each mouse is shown. (b-d) Representative subsets of mice from Fig. 1b n = 4 mice (WT; 3 M 1 F), n = 8 (OSKM + doxy; 4 M 4 F), n = 11 (OSKM + doxy + ABX 4 M 7 F) were used for all analyses (b) Tissues were harvested on day 7 post doxycycline initiation and the expression of the OSKM transgene was assessed by RT-qPCR. (c) Representative histology images of the indicated treatments and markers are shown (left) and quantified (right). Histologic score for stomach dysplasia and inflammation was assigned by a blinded pathologist. No relevant morphologic changes were observed in the kidney cortex and medulla in any of the mice. (d) Body weights of mice from the indicated treatment groups, expressed as a percent change on day 7 post-doxycycline as compared to pre-doxycycline (day 0). Scale bars are 100 µm. Graphs represent average ± SD; ****p < 0.0001 by two-tailed Student’s t-test.
Extended Data Fig. 2
Extended Data Fig. 2. Metagenomic analysis of fecal bacteria during in vivo reprogramming.
(a-c) Mice were treated with doxycycline for 7 days as described in Fig. 1a. Stool from subset of WT (n = 4; 2 M 2 F) and OSKM (n = 4 2 M 2 F) mice was analyzed before (pre; day 0) and after seven days (post; day 7) of doxycycline (stool was collected repeatedly from the same mice). (a) The change in the Shannon diversity index on day 7 as compared to day 0 in the indicated treatment groups. Negative values indicate reduced diversity post-doxycyline. Graph represents average ± SD; ns p˃0.05 by two-tailed Student’s t-test. (b) Microbial stool diversity at the genus level, as categorized by 16 S rRNA sequencing. The 17 genera with the highest abundance are shown. “Unassigned” refers to bacterial species that could not be assigned a specific genus. “Others” includes assigned bacteria with low counts, as well as archaea. See Supplementary Table 1 for complete list. Mouse 8, marked with a dot (●), had a large proportion of host (murine) DNA contamination in the stool sample. (c) Normalized abundance of genera capable of de novo synthesis of vitamin B12 in the indicated conditions. Genera are ordered by significance in the day7/day0 (OSKM) vs day7/day0 (WT) interaction, and raw p-values (by two-tailed Wald test (DESeq2)) for this score are shown. Source data
Extended Data Fig. 3
Extended Data Fig. 3. Vitamin B12 deficiency limits in vivo reprogramming.
(a) Abundance of phosphatidylcholine (PC) species in the serum during reprogramming. WT and OSKM mice (n = 6 per group; 3 M 3 F) were treated with doxycycline for 7 days and paired serum samples were taken pre- (D0) and post (D7) doxycyline for metabolic analysis by mass spectrometry. The relative abundance of the indicated PC moieties are given as a log2 fold change (FC) as compared to WT on D7. P-values represent the comparison between WT and OSKM groups by two-tailed Student’s t-test for each PC moiety. (b) Vitamin B12 immunohistochemistry in the kidney. WT and OSKM mice were treated with doxycycline with or without vitamin B12 as indicated for 7 days. Representative images of kidneys stained for vitamin B12 are shown (left) and total staining is quantified (right). WT doxy (n = 3; 2 M 1 F); OSKM doxy (n = 5; 5 M) and OSKM doxy + B12 (n = 5; 1 M 4 F). (c-h) Analysis of reprogramming in mice treated as described in Fig. 1a, with treatments as indicated. (c) Histologic score of reprogramming was assigned by a blinded histopathologist in the colon (left) and stomach (right). n = 5 mice (OSKM 2 M 3 F and OSKM + ABX, stomach 5 F), n = 10 (OSKM + B12 4 M 6 F and OSKM + ABX, colon 10 F), n = 8 (OSKM + ABX + B12 3 M 5 F). (d-e) Immunohistochemistry of SCA1 and KRT14 in the colon (d) and stomach (e). Representative images and quantification (average ± SD; inset) from a subset of n = 5 mice per condition are shown. Asterisks represent comparison to the OSKM condition by one-way ANOVA; **p < 0.01, ***p < 0.001, ****p < 0.0001. (f-h) Analysis of mice from Fig. 1e treated with doxycycline, with or without vitamin B12 supplementation as indicated. (f) NANOG immunohistochemistry in the stomach of n = 5 representative mice per group. (g) Expression of the OSKM transgene assessed by RT-qPCR in the indicated tissues on D7 post doxy. n = 5 mice (OSKM; 2 M 3 F), n = 10 mice (OSKM + B12; 4 M 6 F). (h) Representative images of H/E staining of the kidney. No relevant histologic changes were observed in the kidney of any of the mice. Scale bars are 100 µm. Mice marked by an open circle received both B12 and folate supplementation (n.s. difference for B12 vs B12 + folate; see text for details). Graphs represent average ± SD; p-values are by two-tailed Student’s t-test unless otherwise indicated. Source data
Extended Data Fig. 4
Extended Data Fig. 4. Vitamin B12 and 1-carbon (1 C) metabolism markers during in vivo reprogramming.
(a) Schematic of methylmalonyl-coA mutase (MUT) enzymatic activity in the mitochondria, Figure adapted from ref. , Springer Nature Limited. TCA: tricarboxylic acid. (b) Metabolites of the Gly/Ser/Thr metabolism pathway (KEGG map00260) identified in the serum of WT and OSKM mice (n = 6 mice per genotype; 3 M 3 F) during a time course of doxycycline administration. Fold change (FC) of the peak area of the indicated metabolites as detected by mass spectrometry is shown relative to (D0) for the respective groups (that is WT and OSKM). P-values represent significant difference between OSKM and WT mice on the indicated day. Serum was collected repeatedly from the same mice. (c) WT and OSKM mice (n = 5 per group; 5 M) were treated with doxycycline and given a bolus of vitamin B12 on day 6, as schematized in Fig. 2f. Serum (repeated measurements) was analyzed by mass spectrometry prior to doxycycline (day 0), prior to the B12 bolus (day 6), and 24 hours after the bolus (day 7). The ratio of SAM/SAH abundance (upper) and total abundance of homocysteine (Hcy, lower) are shown. P-value represents comparison of WT vs. OSKM by two-way ANOVA. (d) Expression of Bhmt and Cbs in previously published RNA sequencing data from n = 2 paired parental MEFs and induced pluripotent stem cells (iPSC), generated by doxycycline-induced OSKM expression. Data source: 40. (e) Serum analysis of betaine in the mice described in panel (b). (f) Expression of methylmalonyl-coA mutase (Mmut) in WT (n = 4) and OSKM (n = 8) mice from Fig. 1b. Mice were treated with doxycycline for 7 days and RT-qPCR was performed in tissues that do (pancreas, stomach, colon; green) and do not (kidney; orange) exhibit histologic signs of reprogramming. Bar graphs represent average ± SD; p-values by two-tailed Student’s t-test unless otherwise indicated. Source data
Extended Data Fig. 5
Extended Data Fig. 5. Reprogramming induces a methionine deprivation signature that is relieved by vitamin B12.
(a) Immunoblot (left) and RT-qPCR (right) to measure levels of methionine synthase (encoded by Mtr) in the colon and stomach of WT (n = 4, 3 M 1 F) and OSKM (n = 8, 4 M 4 F) mice from Fig. 1b treated with doxycycline for 7 days. Representative mice are shown in the immunoblot. (b) Expression of Cd320 measured by RT-qPCR in the indicated tissues from WT and OSKM mice described in panel (a). (c) Previously published RNAseq data of iPS cells and their parental MEFs (data source: 40) was used to perform gene set enrichment analysis against a published signature of methionine deprivation (msigdb: M13537; ref. ). (d) RT-qPCR analysis in the indicated tissues from a subset of mice from Fig. 1. The genes were derived from the methionine deprivation signature shown in (c); see Methods for details. (e-f) Analysis of vitamin B12 levels in the WT and OSKM mice receiving doxycycline and the vitamin B12 bolus, as schematized in Fig. 2f. (e) Cyanocobalamin (CN-cbl) levels in the stool measured by mass spectrometry. Mice were individualized immediately after the bolus and all the fecal matter was collected from the cage 24 hours later. Untreated mice received neither the B12 bolus nor doxycycline. n = 5 mice (untreated), n = 3 (WT doxy), n = 5 (OSKM doxy), all males. (f) Vitamin B12 levels in the serum (holotranscobalamin, holoTC) measured by ADVIA Immunoassay on day 7, 24 hours after the B12 bolus, n = 5 mice (all males) per group. Color of labels indicate tissues that are prone (pancreas, colon, stomach; green) and refractory (kidney; orange) to reprogramming. Bar graphs represent average ± SD; p-values by two-tailed Student’s t-test. Source data
Extended Data Fig. 6
Extended Data Fig. 6. The impact of vitamin B12 administration on in vitro reprogramming.
(a) Changes in gene expression of the vitamin B12 uptake receptor Cd320 and Mtr (encoding MS) during a previously published time course of iPSC generation by OSKM expression. iPSCs were derived from MEFs of two different genetic backgrounds (Gatad2a-/- and Mbd3-/) that both yield high-efficiency reprogramming. Each row is an independent embryo of the indicated genotype. Data source: 40 (b) Vitamin B12 supplementation does not accelerate iPSC formation. OSKM MEFs were treated with doxycycline with or without vitamin B12 supplementation as indicated, and iPSC colony formation was assessed by alkaline phosphatase staining after 7 and 10 days of treatment. Representative images are shown of MEFs derived from a single embryo; n = 3 independent embryos were tested. (c) Vitamin B12 enhances doxycycline-free retroviral reprogramming. Wild type MEFs were transduced with retroviral vectors encoding Oct4, Sox2, Klf4, and cMyc. Samples were collected on day 5 post-transduction for histone extraction and immunoblot (lower). iPSC colony formation was evaluated by alkaline phosphatase (AP) staining on day 14 (upper). Immunoblot and AP images are representative from n = 3 independent MEFs. (d-e) Stable isotope labeling (SIL) with fully labeled 13C-serine during in vitro reprogramming. (d) Schematic of 1 C metabolism indicating how fully labeled 13C-serine contributes to methyl m + 1 labeling of SAM. Orange points indicate 13 C atoms. Figure adapted from ref. , Springer Nature Limited. (e) SIL does not affect reprogramming efficiency. Doxycycline-inducible OSKM MEFs were cultured in normal iPS media with doxycycline without or without vitamin B12 supplementation as indicated. 13C-serine labeled media was administered as descried in Methods and reprogramming was quantified by iPS colonies evaluated by AP staining on day 10. Quantification of colonies is shown for the indicated treatments. Each point represents an individual MEF clone. P-values represent comparison of the OSKM vs OSKM + B12 condition for each media type. (f) Changes in histone methylation during in vitro reprogramming with vitamin B12 supplementation. Histone extracts were prepared from OSKM MEFs treated with doxycycline for 3 and 10 days, with or without vitamin B12 supplementation. Levels of the indicated histone methylation modifications were measured by colorimetric multiplex assay and the relative abundance (fold change, FC) in cells reprogrammed in the presence as compared to absence of vitamin B12 is shown. Note that MEFs derived from independent embryos were used for day 3 and day 10 analyses. (g) Expression of Setd2, which encodes the H3K36 trimethyl-transferase in the colon (left) and stomach (right) from WT and OSKM mice after 7 days of doxycycline treatment. Mice are from Fig. 1b n = 4 mice (WT), n = 8 (OSKM colon), n = 6 (OSKM stomach). (h) H3K36me3 during in vivo reprogramming in the colon and stomach of OSKM mice with and without B12 supplementation. Representative images are shown (left) and quantified (right) in a subset (n = 5 for each group) of mice from Fig. 1e. Scale bar is 100 µm. Mice that received folate in addition to B12 are represented by open points. Graphs represent average ± SD. P-values by two-tailed Student’s t-test. used for day 3 and day 10 analyses. (g) Expression of Setd2, which encodes the H3K36 trimethyl-transferase in the colon (left) and stomach (right) from WT and OSKM mice after 7 days of doxycycline treatment. Mice are from Fig. 1b n = 4 mice (WT), n = 8 (OSKM colon), n = 6 (OSKM stomach). (h) H3K36me3 during in vivo reprogramming in the colon and stomach of OSKM mice with and without B12 supplementation. Representative images are shown (left) and quantified (right) in a subset (n = 5 for each group) of mice from Fig. 1e. Scale bar is 100 µm. Mice that received folate in addition to B12 are represented by open points. Graphs represent average ± SD. P-values by two-tailed Student’s t-test. Source data
Extended Data Fig. 7
Extended Data Fig. 7. Reprogramming and transcriptional dynamics across MEF clones.
(a) The reprogramming efficiency of three independent MEFs was measured by the formation of iPS colonies as stained with alkaline phosphatase 10 days after continuous addition of doxycycline to the media. (b) The Reprogramming Score was calculated using transcriptional data from MEFs expressing doxycycline-inducible OSKM for 72 h, whose cell surface markers indicated they were poised for high-efficiency reprogramming. See Methods for details. (c) H3K36me3 chromatin immunoprecipitation (ChIP) sequencing was performed in Clone 1, 72 h after the addition of doxycycline and/or vitamin B12, as indicated. The normalized ChIP reads in gene bodies relative to all aligned reads are shown for the middle and bottom tercile in terms of gene expression (as determined by RNA-seq RPKM levels across all condition) are shown (lower). The trace of the ChIP signal is shown, where the y-axis represents average coverage across genes (upper; blue = bottom tercile; grey = middle tercile; red = top tercile, shown for reference; see Fig. 4a for top tercile). TSS – transcription start site; TES – transcription end site. (d-e) The ratio of cryptic transcription (CT). (d) CT in B12-treated cells as compared to non-B12 is shown for the median CT ratio for all genes for which a score could be calculated is plotted. Individual MEFs (n = 3 total) are shown, separated into MEF (no doxycycline) and OSKM (72 h of doxycycline treatment to induce OSKM expression) conditions. Asterisks represent the comparison between the MEF and OSKM bars. (e) OSKM cells were treated with doxycycline and the indicated compounds for 72 h, as described in Fig. 4c. The ratio of CT is plotted as a ratio of the CT in the B12 condition for each treatment, in n = 2 independent MEFs. Asterisks represent the comparison between the indicated treatment and the MAT2Ai treatment. The lower and upper hinges correspond to the first and third quartiles (the 25th and 75th percentiles). The upper (lower) whisker extends from the hinge to the largest (smallest) value no further than 1.5 * IQR from the hinge. P-values were determined by two-tailed unpaired Wilcoxon test no multiple comparisons adjustment (f) Genes whose CT increases upon reprogramming (top 25% comparing OSKM vs. MEF) and decrease with vitamin B12 supplementation (top 25% comparing OSKM B12 vs. OSKM) in Clone 1, used for the hypergeometric analysis in Fig. 4d. The CT ratio of individual genes is shown for each condition. Source data
Extended Data Fig. 8
Extended Data Fig. 8. Recovery from DSS colitis is improved by OSKM or vitamin B12.
(a-c) Previously published time course of bulk colonic RNAseq during DSS injury and recovery Data source: GSE131032. Mice were treated with 2.5% DSS for 7 days as indicated. (a) CT analysis for all genes for which a score could be calculated are shown. Each boxplot represents one biologic replicate (that is, mouse), with the cages indicated as described by the authors of the original study. Dashed line represents median CT value at D0. (b) RNA-sequencing expression of the indicated genes. Values represent the scaled log2FC as compared to D0 across all samples as computed by the authors of the original study. (c) Gene set enrichment analysis of a published signature of methionine deprivation (msigdb: M13537 ref. ) in samples from day 6 vs day 0 of DSS treatment as computed by the authors of the original study. (d-g) Recovery from DSS injury of mice in Fig. 5, with treatment as schematized in Fig. 5a; a representative subset of mice was used for analyses. (d) Periodic acid–Schiff (PAS) staining, which marks mucous produced by differentiated goblet cells, in colonic sections of mice on day 14. n = 5 mice from each group were analyzed with similar results; representative images are shown. (e) Intestinal barrier permeability as measured by FITC-dextran leak assay. Fluorescence intensity was measured in the serum of mice with the indicated treatments on day 9. n = 5 mice (control), n = 8 (DSS), n = 10 (DSS + B12). (f) Ki67 was quantified within the colonic epithelium (right) and representative immunohistochemistry images are shown (left). P-values indicate comparison to the untreated control. Scale bar is 100 µm. n = 6 mice (DSS D14), n = 5 all other groups. (g) Analysis of Lgr5 by single molecule in situ hybridization (ISH). The number of Lgr5+ clusters per 100 cells in the colonic crypts was quantified from at least 20 crypts per mouse (right) from n = 3 mice and representative images are shown (left). Asterisks indicate comparison to the untreated control. Scale bar is 50 µm. Bar graphs represent average ± SD; ****p < 0.0001 by one-way ANOVA. Source data

References

    1. Takahashi K, Yamanaka S. Induction of pluripotent stem cells from mouse embryonic and adult fibroblast cultures by defined factors. Cell. 2006;126:663–676. doi: 10.1016/j.cell.2006.07.024. - DOI - PubMed
    1. Taguchi J, Yamada Y. In vivo reprogramming for tissue regeneration and organismal rejuvenation. Curr. Opin. Genet. Dev. 2017;46:132–140. doi: 10.1016/j.gde.2017.07.008. - DOI - PubMed
    1. Abad M, et al. Reprogramming in vivo produces teratomas and iPS cells with totipotency features. Nature. 2013;502:340–345. doi: 10.1038/nature12586. - DOI - PubMed
    1. Ocampo A, et al. In vivo amelioration of age-associated hallmarks by partial reprogramming. Cell. 2016;167:1719–1733. doi: 10.1016/j.cell.2016.11.052. - DOI - PMC - PubMed
    1. Doeser MC, Schöler HR, Wu G. Reduction of fibrosis and scar formation by partial reprogramming in vivo. Stem Cells. 2018;36:1216–1225. doi: 10.1002/stem.2842. - DOI - PubMed