. 2023 Nov 16;14(1):7421.
doi: 10.1038/s41467-023-42997-7.

Gut microbial structural variation associates with immune checkpoint inhibitor response

Affiliations

Gut microbial structural variation associates with immune checkpoint inhibitor response

Rong Liu et al. Nat Commun. .

Abstract

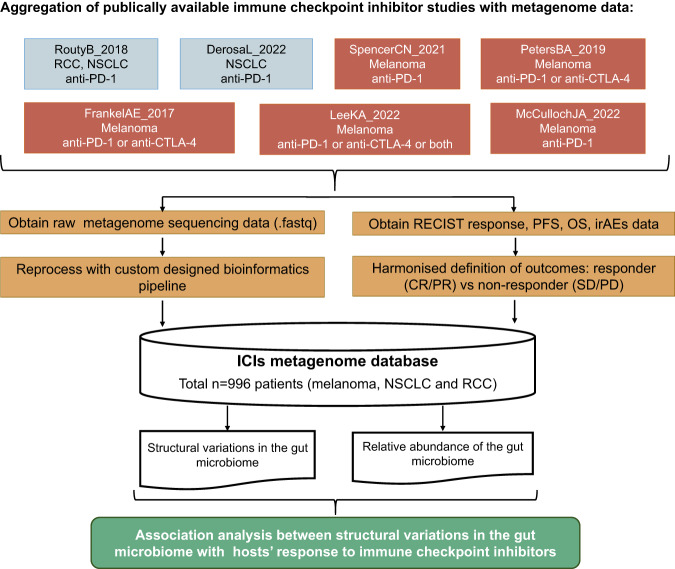
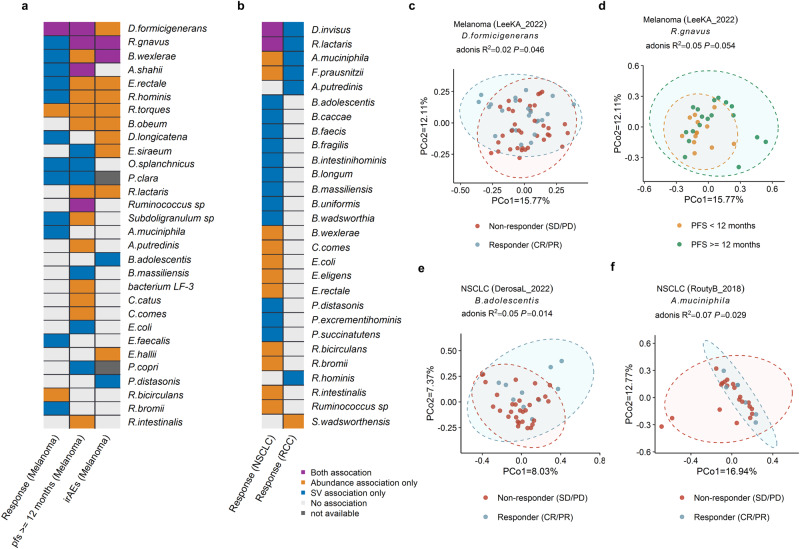
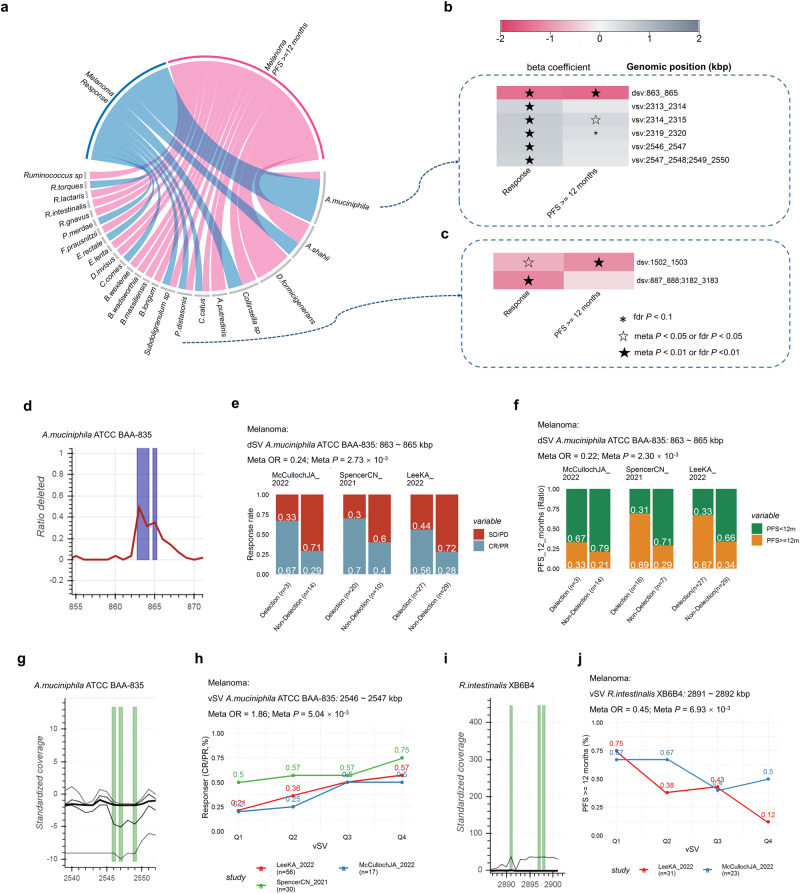
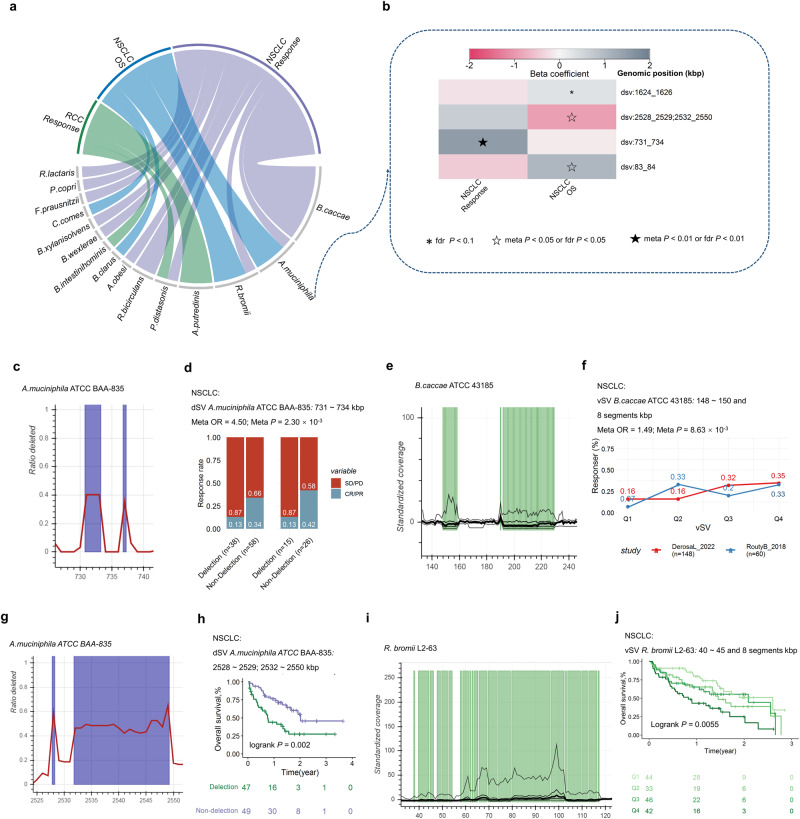
The gut microbiota may have an effect on the therapeutic resistance and toxicity of immune checkpoint inhibitors (ICIs). However, the associations between the highly variable genomes of gut bacteria and the effectiveness of ICIs remain unclear, despite the fact that merely a few gene mutations between similar bacterial strains may cause significant phenotypic variations. Here, using datasets from the gut microbiome of 996 patients from seven clinical trials, we systematically identify microbial genomic structural variants (SVs) using SGV-Finder. The associations between SVs and response, progression-free survival, overall survival, and immune-related adverse events are systematically explored by metagenome-wide association analysis and replicated in different cohorts. Associated SVs are located in multiple species, including Akkermansia muciniphila, Dorea formicigenerans, and Bacteroides caccae. We find genes that encode enzymes that participate in glucose metabolism be harbored in these associated regions. This work uncovers a nascent layer of gut microbiome heterogeneity that is correlated with hosts' prognosis following ICI treatment and represents an advance in our knowledge of the intricate relationships between microbiota and tumor immunotherapy.


Conflict of interest statement

The authors declare no competing interests.

Figures

Fig. 1
Fig. 1. The layout of this study.
Design of this study. NSCLC non-small cell lung cancer, RCC renal cell carcinoma, OS overall survival, PFS progression-free survival, irAEs immune-related adverse events. RECIST response evaluation criteria in solid tumors.
Fig. 2
Fig. 2. Clinical characteristics of ICI related datasets.
a Age distribution in these seven studies. b Gender proportions of these seven studies. c Body mass index distribution in four studies with this information available. d Spine plots for response “CR/PR” versus no response “SD/PD”. e Survival curves for OS by cancer types. f Sankey plot for irAEs, response, and whether progression-free survival longer than 12 months. g Survival curves for OS of response “CR/PR” and no response “SD/PD” groups. P values from log-rank tests are shown in survival plots. irAEs immune-related adverse events, PFS progression-free survival, OS overall survival.
Fig. 3
Fig. 3. Overview of structural variation profiles in the seven cohorts.
a The number of structural variations (SVs) present in each species within the UK cohorts from studies on melanoma. b The proportion of dSV and vSVs and total SV number of the UK cohort from studies on melanoma. c Principal component 1 and principal component 2 of SV makeup within five cohorts from USA or UK. d The number of SVs present in each species within the France cohorts from studies on NSCLC or RCC. e The proportion of dSV and vSVs and total SV number of the France cohorts from studies on NSCLC or RCC. f Principal component 1 and principal component 2 of SV makeup within two cohorts from France.
Fig. 4
Fig. 4. Associations of gut microbiome with hosts’ response to ICIs at the level of species.
Heatmap of associations between species and hosts’ response to ICIs of melanoma (a), NSCLC and RCC (b). Yellow denotes purely relative abundance associations, blue indicates purely SV-based associations, and purple denotes associations based on both SV and relative abundance. Gray denotes relative abundance-based relationships, in which SV associations for the relevant species were not examined due to the small sample size (n < 10). White denotes a lack of association. c SV association of D.formicigenerans with response of melanoma patients treated with ICIs. d SV association of R.gnavus with PFS12 of melanoma patients. e SV associations of B.adolescentis with response to ICIs of NSCLC. f SV association of A.muciniphila with response of RCC patients treated with ICIs. Two-sided statistical tests were utilized. Please also refer to Supplementary Data 3.
Fig. 5
Fig. 5. Associations between structural variants and prognosis after ICIs treatment of melanoma patients.
a Candidate associations between prognosis after ICIs treatment and SVs of melanoma patients. Heatmap of correlations between prognosis after ICIs treatment and SVs of A.muciniphila (b) and P.distasonis (c). d Deletion rate across the cohort (y axis) along a genomic region of A.muciniphila (x axis). Spine plots depict the association between response (e), PFS12 (f), and dSVs within each cohort. g Standardized variability (y axis, plotted lines, percentiles 1, 25, 50, 75 and 99) along a genomic region of A.muciniphila (x axis). h Line plots depict the association between PFS12, and vSV within each cohort (h). i Standardized variability (y axis, plotted lines, percentiles 1, 25, 50, 75 and 99) along a genomic region of R.intestinalis (x axis). j Line plots depict the association between response and vSV within each cohort, Q1 to Q4 are defined based on the quantiles of vSV (25%, 50% and 75%). Logistic regression models were performed to calculate beta value (b), ORs and 95% CIs (e, f, h, j) for response and PFS12. Meta-analysis with a random-effect model was performed to integrate the results of different cohorts. Two-sided statistical tests were utilized. No adjustments were made for multiple comparisons. Please also refer to Supplementary Data 4.
Fig. 6
Fig. 6. Associations between structural variants and prognosis after ICIs treatment of NSCLC or RCC.
a Candidate associations between prognosis after ICIs treatment of NSCLC or RCC and SVs. b Heatmap of correlations between prognosis after ICIs treatment and SVs of A.muciniphila. c Deletion rate across the cohort (y axis) along a genomic region of A.muciniphila (x axis). d Spine plots depict the association between response, and dSVs. e Standardized variability (y axis, plotted lines, percentiles 1, 25, 50, 75 and 99) along a genomic region of B.caccae. f Line plots depict the association between response, and vSV within each cohort, Q1 to Q4 are defined based on the quantiles of vSV (25%, 50% and 75%). g Deletion rate across the cohort (y axis) along a genomic region of A.muciniphila (x axis). h Survival curves of dSV and quartiles of vSV. i Standardized variability (y axis, plotted lines, percentiles 1, 25, 50, 75 and 99) along a genomic region of R.bromii. j Survival curves of vSV, Q1 to Q4 are defined based on the quantiles of vSV (25%, 50% and 75%). Illustrated p values are from log-rank tests. Logistic regression models were performed to calculate beta value (b), ORs and 95% CIs (d, f) for response. Cox regression models were performed to calculate beta value (b), ORs and 95% CIs (h, j) for response. Meta-analysis with a random-effect model was performed to integrate the results of different cohorts. Two-sided statistical tests were utilized. No adjustments were made for multiple comparisons. HR hazard ratio. Please also refer to Supplementary Data 4.

References

    1. Brahmer JR, et al. Safety and activity of anti-PD-L1 antibody in patients with advanced cancer. N. Engl. J. Med. 2012;366:2455–2465. doi: 10.1056/NEJMoa1200694. - DOI - PMC - PubMed
    1. Kang YK, et al. Nivolumab in patients with advanced gastric or gastro-oesophageal junction cancer refractory to, or intolerant of, at least two previous chemotherapy regimens (ONO-4538-12, ATTRACTION-2): a randomised, double-blind, placebo-controlled, phase 3 trial. Lancet (Lond., Engl.) 2017;390:2461–2471. doi: 10.1016/S0140-6736(17)31827-5. - DOI - PubMed
    1. Chen EY, Raghunathan V, Prasad V. An overview of cancer drugs approved by the us food and drug administration based on the surrogate end point of response rate. JAMA Intern. Med. 2019;179:915–921. doi: 10.1001/jamainternmed.2019.0583. - DOI - PMC - PubMed
    1. Ott PA, et al. T-cell-inflamed gene-expression profile, programmed death ligand 1 expression, and tumor mutational burden predict efficacy in patients treated with pembrolizumab across 20 cancers: KEYNOTE-028. J. Clin. Oncol. 2019;37:318–327. doi: 10.1200/JCO.2018.78.2276. - DOI - PubMed
    1. Cristescu, R. et al. Pan-tumor genomic biomarkers for PD-1 checkpoint blockade-based immunotherapy. Science (New York, N.Y.)362, 10.1126/science.aar3593 (2018). - PMC - PubMed

Publication types

MeSH terms

Substances