. 2023 Nov 16;14(1):7403.
doi: 10.1038/s41467-023-43261-8.

Maternal vitamin B1 is a determinant for the fate of primordial follicle formation in offspring

Affiliations

Maternal vitamin B1 is a determinant for the fate of primordial follicle formation in offspring

Wen-Xiang Liu et al. Nat Commun. .

Abstract

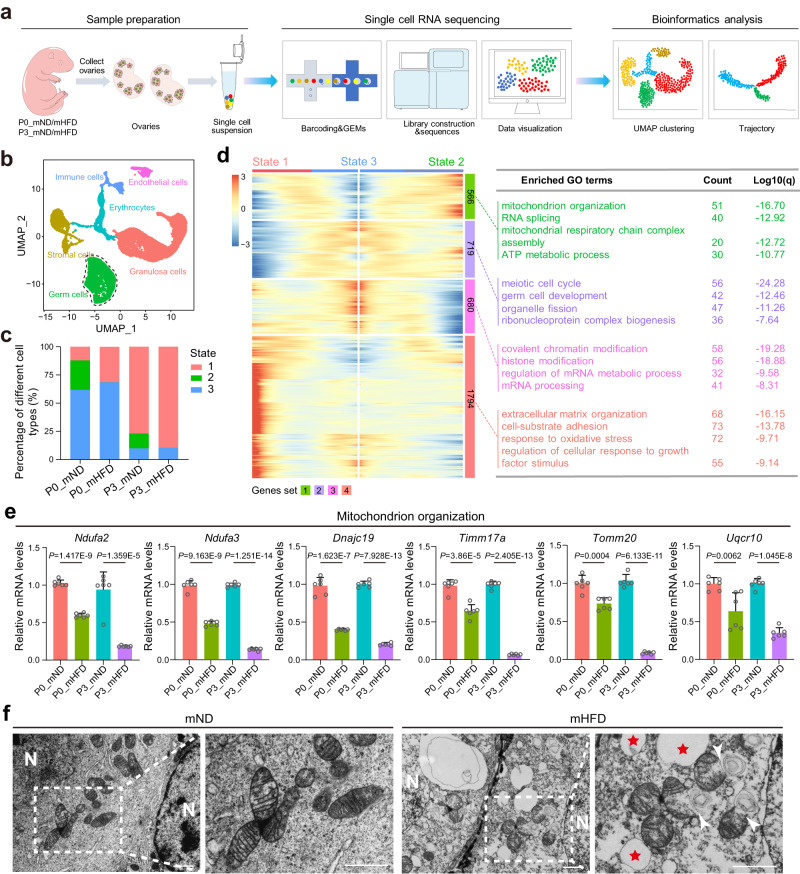
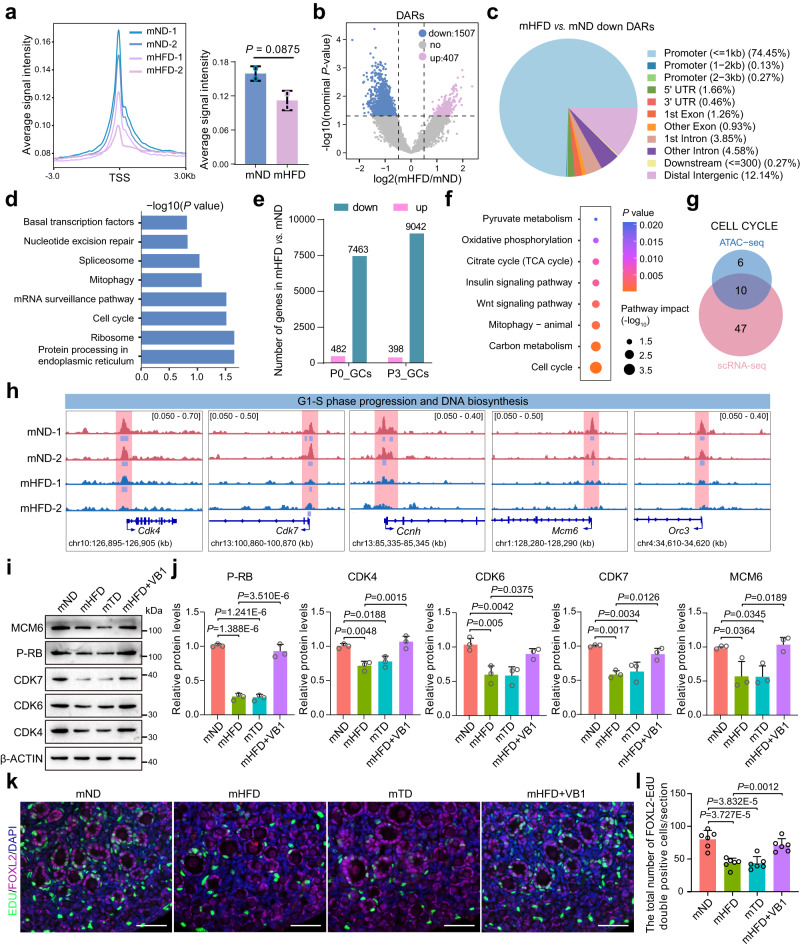
The mediation of maternal-embryonic cross-talk via nutrition and metabolism impacts greatly on offspring health. However, the underlying key interfaces remain elusive. Here, we determined that maternal high-fat diet during pregnancy in mice impaired preservation of the ovarian primordial follicle pool in female offspring, which was concomitant with mitochondrial dysfunction of germ cells. Furthermore, this occurred through a reduction in maternal gut microbiota-related vitamin B1 while the defects were restored via vitamin B1 supplementation. Intriguingly, vitamin B1 promoted acetyl-CoA metabolism in offspring ovaries, contributing to histone acetylation and chromatin accessibility at the promoters of cell cycle-related genes, enhancement of mitochondrial function, and improvement of granulosa cell proliferation. In humans, vitamin B1 is downregulated in the serum of women with gestational diabetes mellitus. In this work, these findings uncover the role of the non-gamete transmission of maternal high-fat diet in influencing offspring oogenic fate. Vitamin B1 could be a promising therapeutic approach for protecting offspring health.


Conflict of interest statement

The authors declare no competing interests.

Figures

Fig. 1
Fig. 1. Maternal HFD during pregnancy led to impairment of primordial follicle formation in offspring.
a Schematic illustration of the maternal diet regimen and timeline of primordial follicle formation. The detection time point is indicated by a red arrow. b IF staining of DDX4 in offspring ovaries from mND and mHFD groups, and images were captured at two specific locations: 50 μm and 150 μm from the beginning of the tissue edge. DDX4 and DNA are stained in magenta and dark indigo, respectively. DDX4 indicate oocytes. Scale bar, 100 μm. c Violin plot showing the percentages of oocytes within follicles (n = 10 biologically independent repeats from 10 litters for each group). The upper and lower boundary in the plot indicates the upper and lower quantiles, the line inside the plot the median. d Violin plot showing the total number of oocytes per section in ovary in each group (n = 10 biologically independent repeats from 10 litters for each group). The upper and lower boundary in the plot indicates the upper and lower quantiles, the line inside the plot the median. e RT-qPCR analyzing the expression of Nobox, Lhx8, Sohlh2, Figla and Elavl2 in each group. The number of biologically independent repeats is indicated (n). f, g Representative images and relative protein levels of DDX4, NOBOX and LHX8 in offspring ovaries from mND and mHFD groups. DDX4 and GAPDH were loading controls (n = 3 biologically independent repeats). Uncropped blots in Source Data. h Number of primordial follicles at 3 weeks (n = 14 biologically independent repeats) and 7 months (n = 8 biologically independent repeats) in offspring ovaries from mND and mHFD groups. Data were all presented as mean ± SD. A Student’s t test (two-tailed) was used for statistical analysis (ce, g, h); n.s., not significant. Source data are provided as a Source Data file.
Fig. 2
Fig. 2. Depletion of the maternal vitamin B1 impairs primordial follicle assembly in offspring.
a Principal component analysis score plot for discriminating the maternal serum metabolome from the mND and mHFD groups (n = 9 mice for each group). b Disturbed metabolic pathways in the mND vs. mHFD groups. The P-value is obtained through hypergeometric distribution (two-tailed) and subsequently adjusted using False Discovery Rate (FDR) correction. c Heatmaps of the differential metabolites in vitamin digestion and absorption pathways. d The vitamin B1 concentration in maternal serum (n = 5 biologically independent repeats) or in offspring ovary (n = 7 biologically independent repeats) in each group on P3. e Study design of sample treatment experiment. f The vitamin B1 concentration in maternal serum in the mND (n = 8 biologically independent repeats), mHFD (n = 5 biologically independent repeats), mTA (n = 6 biologically independent repeats), mTD (n = 6 biologically independent repeats), and mHFD+VB1 (n = 8 biologically independent repeats) on P3. g IF staining of DDX4 in offspring ovaries in the indicated groups on P3. DDX4 and DNA are stained in magenta and dark indigo, respectively. DDX4 indicate oocytes. Scale bar, 50 μm. h The percentages of germ cells within nests and follicles in mND, mHFD, mTA, mTD and mHFD+VB1 groups, respectively (n = 10 biologically independent repeats from 10 litters for each group). Data were all presented as mean ± SD. In d, the two-tailed student’s t test was used for statistical analysis; In (f, h) statistical analyses were performed by one-way analysis of variance (ANOVA) with Tukey’s test for multiple comparisons. Source data are provided as a Source Data file.
Fig. 3
Fig. 3. Maternal HFD during pregnancy induced mitochondrial dysfunction of germ cells.
a Schematic diagram of the scRNA-sequencing analysis procedure. b UMAP plot of six main ovarian cell types. c Percentages of three cell states. d Heatmap representing the expression of four gene sets with three cell states (left); GO terms of differentially expressed genes in each gene set (right). e, RT-qPCR analyzing the expression of mitochondrial organization related-genes in offspring ovaries from mND and mHFD groups (n = 6 biologically independent repeats). f Transmission electron microscopic imaging of mitochondria in germ cell at P3. Red asterisks indicate lipid droplet, white arrows indicate abnormal mitochondria and white N indicate germ cell nuclei. Scale bar, 1 μm. Data were all presented as mean ± SD. A Student’s t test (two-tailed) was used for statistical analysis (e). Source data are provided as a Source Data file.
Fig. 4
Fig. 4. Maternal vitamin B1 is crucial for mitochondrial function and primordial follicle in neonatal ovary.
a Schematic illustration of vitamin B1 participation in acetyl-CoA metabolism. b Relative pyruvate dehydrogenase (PDH) activity and relative Acetyl-CoA levels in offspring ovaries from mND, mHFD, mTD or mHFD+VB1 mice, respectively (n = 8 biologically independent repeats). c IF staining of DDX4 in ovaries treated with PDH inhibitor CPI-613, Scr-siRNA or Pdha1-siRNA, respectively. DDX4 and DNA are stained in magenta and dark indigo, respectively. DDX4 indicate oocytes. Scale bar, 50 μm. d The percentages of oocytes within follicles in the indicated groups (n = 8 biologically independent repeats). e The total number of oocytes per section in the indicated groups (n = 8 biologically independent repeats). f, g Relative ATP levels and fluorescence intensity of ROS in offspring ovaries from mND, mHFD, mTD or mHFD+VB1 mice, respectively (n = 8 biologically independent repeats). h Transmission electron microscopy imaging of mitochondria in germ cells and granulosa cells in the indicated groups (n = 3 biologically independent repeats). White arrows indicate abnormal mitochondria and white N indicate germ cell nuclei. Scale bar, 1 μm. i Relative Acetyl-CoA levels of Scr.siRNA-treated or Slc19a2-siRNA+Slc19a3-siRNA-treated ovaries (n = 12 biologically independent repeats). j Relative Acetyl-CoA levels of Control-treated, 500 μM or 1 mM amprolium (APL)-treated ovaries (n = 10 biologically independent repeats). k IF staining of DDX4 in ovaries treated with 1 mM APL, Scr-siRNA or Slc19a2-siRNA+Slc19a3-siRNA, respectively. DDX4 and DNA are stained in magenta and dark indigo. Scale bar, 50 μm. l The percentages of oocytes within follicles in ovaries treated with 1 mM APL, Scr-siRNA or Slc19a2-siRNA+Slc19a3-siRNA, respectively (n = 6 biologically independent repeats). m The total number of oocytes per section in ovaries treated with 1 mM APL, Scr-siRNA or Slc19a2-siRNA+Slc19a3-siRNA, respectively (n = 6 biologically independent repeats). Data were all presented as mean ± SD. Statistical analyses were performed by one-way analysis of variance (ANOVA) with Tukey’s test for multiple comparisons (b, f, g, j) or two-tailed student’s t test (d, e, i, l, m); n.s. not significant. Source data are provided as a Source Data file.
Fig. 5
Fig. 5. Maternal vitamin B1 is crucial for the modification of histones acetylation in neonatal ovary.
a IF staining of PDC-E1 and DDX4 in ovary. PDC-E1, DDX4 and DAPI are stained in magenta, green and blue, respectively (n = 4 biologically independent repeats). Scale bar, 50 μm. b Quantify the fluorescence intensity of PDC-E1, DDX4, and DAPI in granulose and germ cells along the white dashed lines (a). The horizontal dashed gray lines (b) indicate the baseline fluorescence intensity, while the vertical dashed gray lines represent the demarcation between germ cells and granulosa cells. c The relative protein levels of PDC-E1 in ovarian cells and nuclei (n = 3 biologically independent repeats). H3 and α-TUBULIN were loading controls. Uncropped blots in Source Data. d Schematic illustration of the conversion of pyruvate to acetyl-CoA via PDH in nucleus and mitochondria. e, f Representative image and relative protein levels of Ac-H3, Ac-H3K9, Ac-H3K18 and Ac-H4 in offspring ovaries from mND, mHFD, mTD or mHFD+VB1 mice, respectively. H3 and H4 were loading controls (n = 3 biologically independent repeats). Uncropped blots in Source Data. g, h Representative image and relative protein levels of Ac-H3 and Ac-H4 in ovaries treated with 1 mM APL, Scr-siRNA or Slc19a2-siRNA+Slc19a3-siRNA, respectively. H3 and H4 were loading controls (n = 3 biologically independent repeats). Uncropped blots in Source Data. Data were all presented as mean ± SD. Statistical analyses were performed by one-way analysis of variance (ANOVA) with Tukey’s test for multiple comparisons (f) or two-tailed student’s t test (h). Source data are provided as a Source Data file.
Fig. 6
Fig. 6. Maternal vitamin B1 insufficiency suppressed granulosa cells proliferation in offspring.
a ATAC-sequencing signals spanning the entire genome visualized in a TSS-centric manner (n = 2 biologically independent repeats). b Volcano plot of the differentially accessible regions (DARs) between mND and mHFD groups. c Genomic distribution of downregulated DARs in the mHFD vs. mND groups. d KEGG enrichment analysis of genes along with reduced accessibility in the promoter regions. The P-value is obtained through hypergeometric distribution (two-tailed) and subsequently adjusted using FDR correction. e The number of differentially expressed genes in the granulosa cells of offspring ovaries from mND and mHFD groups. f KEGG enrichment analysis of downregulated genes in the granulosa cells of offspring ovaries from mND and mHFD groups. The P-value is obtained through hypergeometric distribution (two-tailed) and subsequently adjusted using FDR correction. g Venn diagram illustrating the relationship of the cell cycle-related genes between ATAC-sequencing and scRNA-sequencing. h ATAC-sequencing normalized reads shown for G1-S phase progression and DNA biosynthesis genes. i, j Representative images and relative protein levels of MCM6, P-RB, CDK7, CDK4 and CDK6 in offspring ovaries from mND, mHFD, mTD or mHFD+VB1 mice, respectively (n = 3 biologically independent repeats). β-ACTIN were loading controls. Uncropped blots in Source Data. k, l IF staining of EdU (Proliferation labeling) and FOXL2 (Granular cell marker), and quantification of FOXL2-EdU double-positive cells per section in offspring ovaries from mND, mHFD, mTD or mHFD+VB1 mice, respectively (n = 6 biologically independent repeats). EdU, FOXL2, and DNA are stained in green, magenta, and blue, respectively. Scale bar, 50 μm. Data were all presented as mean ± SD. Statistical analyses were performed by one-way analysis of variance (ANOVA) with Tukey’s test for multiple comparisons (j, l) or two-tailed student’s t test (a, b). Source data are provided as a Source Data file.
Fig. 7
Fig. 7. Reduction of vitamin B1 levels in human with gestational diabetes mellitus (GDM).
a Oral glucose-tolerance test (oGTT) for pregnant women with healthy controls (HC) and GDM (n = 31 human participants for each group). b Violin plot showing area under the curve (AUC) of oGTT for pregnant women with HC and GDM (n = 31 human participants for each group). The upper and lower boundary in the plot indicates the upper and lower quantiles, the line inside the plot the median. c Box plot showing the levels of glucose (GLU) and triglycerides (TG) in maternal serum of HC and GDM (n = 31 human participants for each group). d Representative H&E images of liver in mND and mHFD mice. Black arrows indicate lipid droplets. Scale bars, 50 μm. e Box plot showing the levels of GLU and TG levels in maternal serum of mND and mHFD groups (n = 10 mice for each group). f, g Glucose tolerance test (GTT) with AUC in mND and mHFD mice (n = 10 mice for each group). h, i Insulin tolerance tests (ITT) with AUC in mND and mHFD mice (n = 10 mice for each group). j Box plot showing the serum levels of vitamin B1 in maternal serum of HC and GDM (n = 31 human participants for each group). k Spearman’s correlation analysis (two-tailed) between vitamin B1 and oGTT (AUC), and GLU, and TG in HC and GDM, respectively. Blue indicates a negative correlation (*0.01 < P < 0.05, **0.001 < P < 0.01, ***P < 0.001). l Spearman’s correlation analysis (two-tailed) between vitamin B1 and oGTT (AUC) in HC and GDM. R-value less than 0 indicates a negative correlation between two variables and P-value less than 0.01 was highly significant difference. Data were all presented as mean ± SD. The box in the box plot (c, e, j) indicates the upper and lower quartiles, with the line inside the box indicating the median. The whiskers extending from the box represent the range of data, where the lower whisker reaches the minimum, and the upper whisker extends to the maximum. Student’s t test (two-tailed) was used for statistical analysis (b, c, ej). Source data are provided as a Source Data file.

Similar articles

Cited by

References

    1. Zheng Y, Ley SH, Hu FB. Global aetiology and epidemiology of type 2 diabetes mellitus and its complications. Nat. Rev. Endocrinol. 2018;14:88–98. doi: 10.1038/nrendo.2017.151. - DOI - PubMed
    1. Ng M, et al. Global, regional, and national prevalence of overweight and obesity in children and adults during 1980-2013: a systematic analysis for the Global Burden of Disease Study 2013. Lancet. 2014;384:766–781. doi: 10.1016/S0140-6736(14)60460-8. - DOI - PMC - PubMed
    1. Klein S, Gastaldelli A, Yki-Jarvinen H, Scherer PE. Why does obesity cause diabetes? Cell Metab. 2022;34:11–20. doi: 10.1016/j.cmet.2021.12.012. - DOI - PMC - PubMed
    1. LifeCycle Project-Maternal, O. Association of gestational weight gain with adverse maternal and infant outcomes. JAMA. 2019;321:1702–1715. doi: 10.1001/jama.2019.3820. - DOI - PMC - PubMed
    1. Catalano PM, Shankar K. Obesity and pregnancy: mechanisms of short term and long term adverse consequences for mother and child. BMJ. 2017;356:j1. doi: 10.1136/bmj.j1. - DOI - PMC - PubMed

Publication types