. 2023 Dec;29(12):3175-3183.
doi: 10.1038/s41591-023-02636-6. Epub 2023 Nov 16.

Clonal selection of hematopoietic stem cells after gene therapy for sickle cell disease

Affiliations

Clonal selection of hematopoietic stem cells after gene therapy for sickle cell disease

Michael Spencer Chapman et al. Nat Med. 2023 Dec.

Abstract

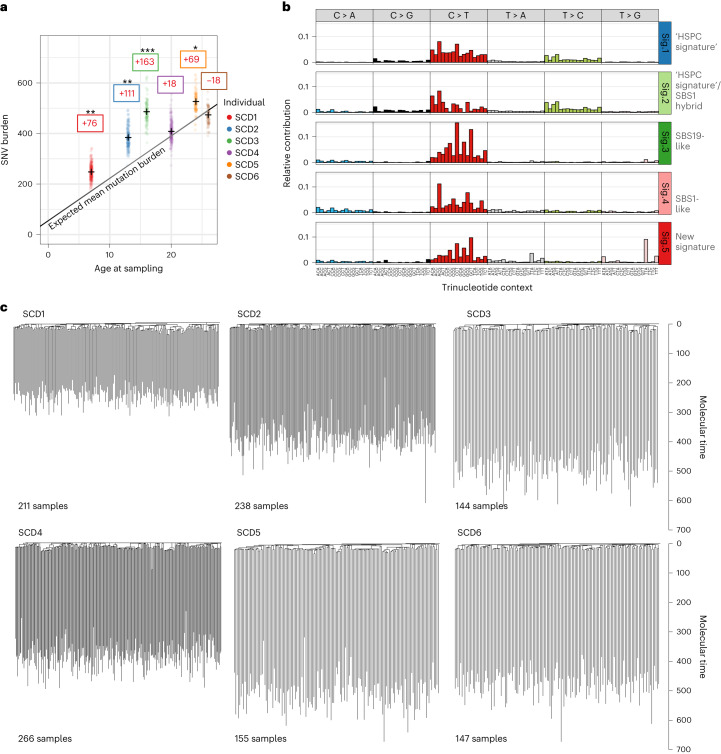
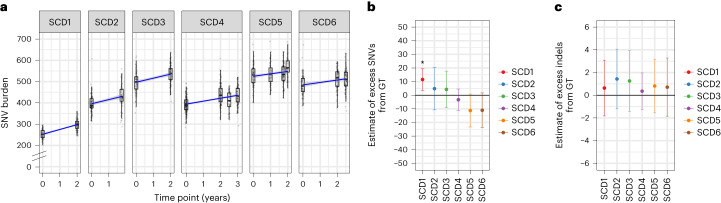
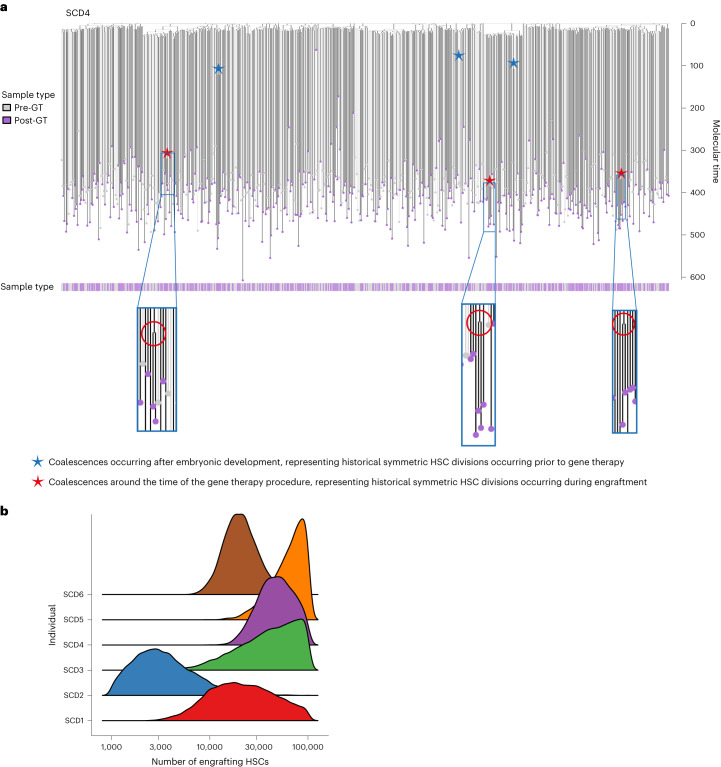
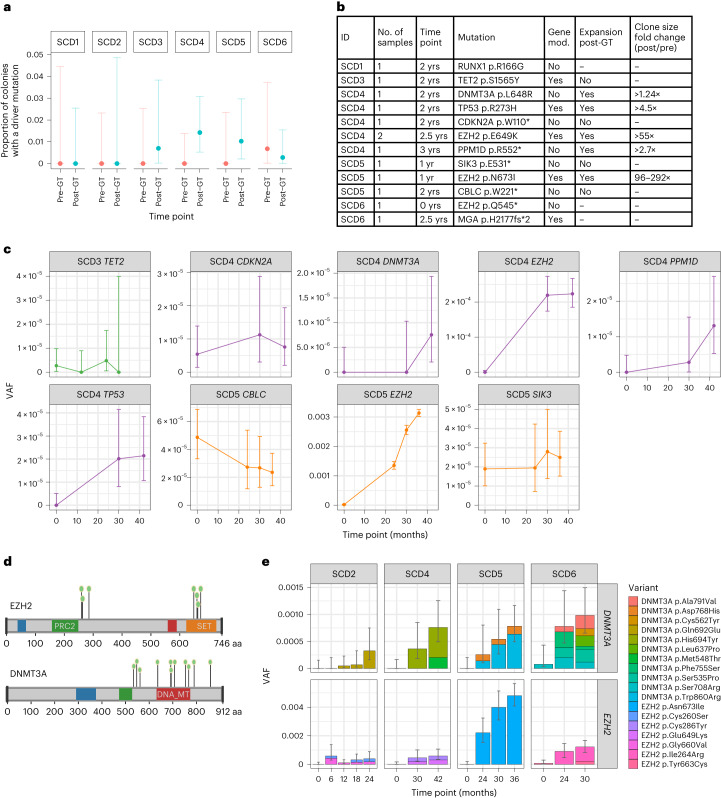
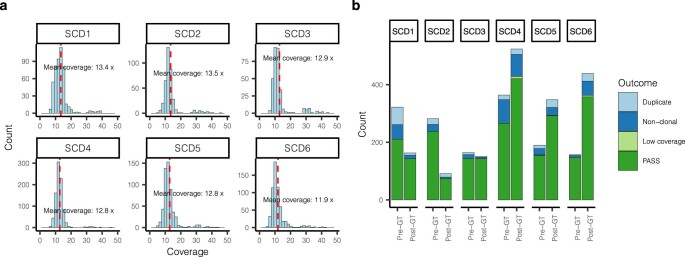
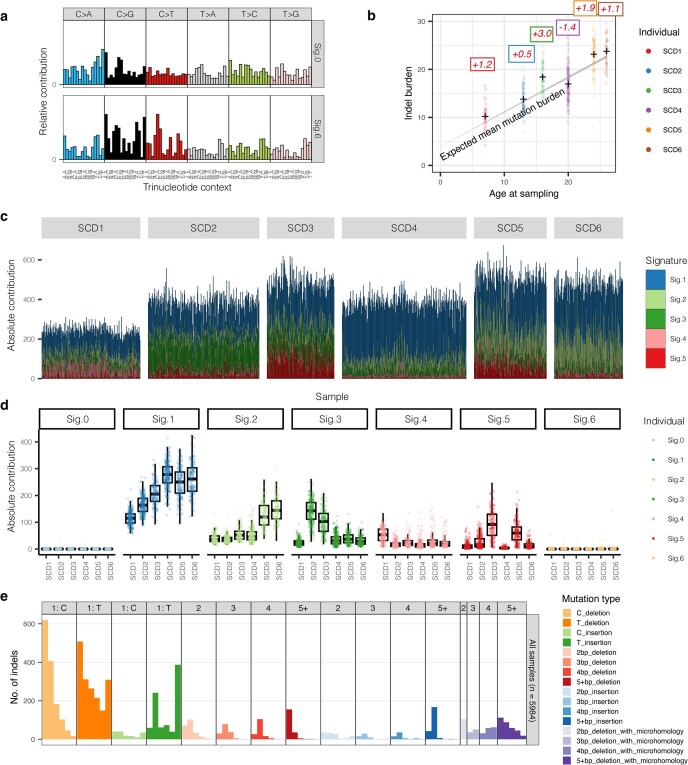
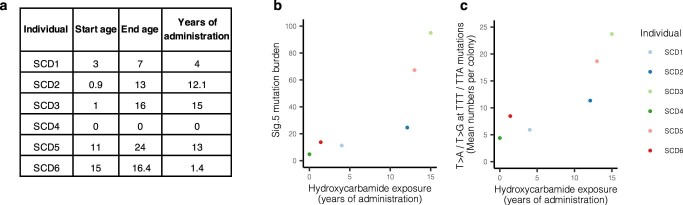
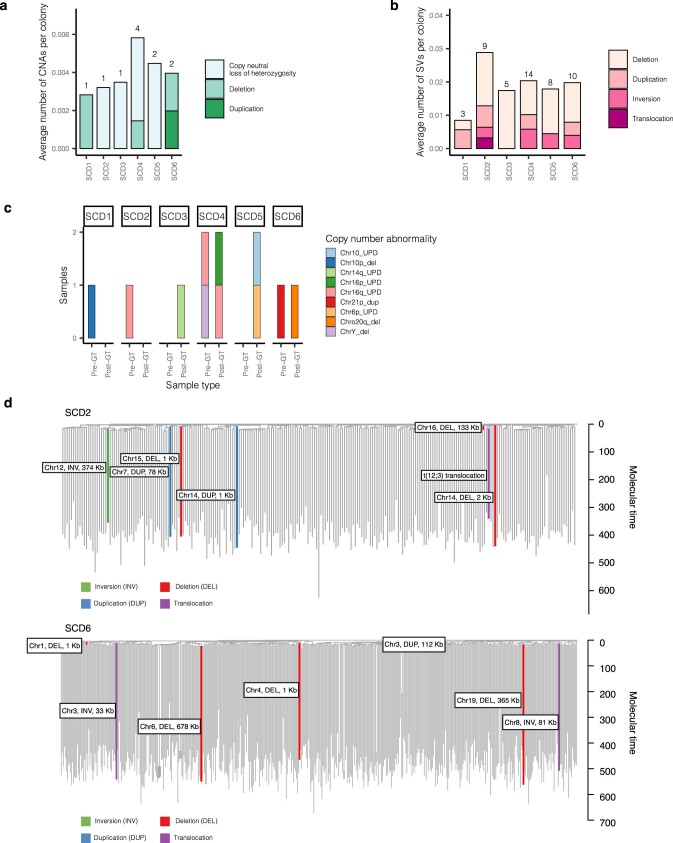
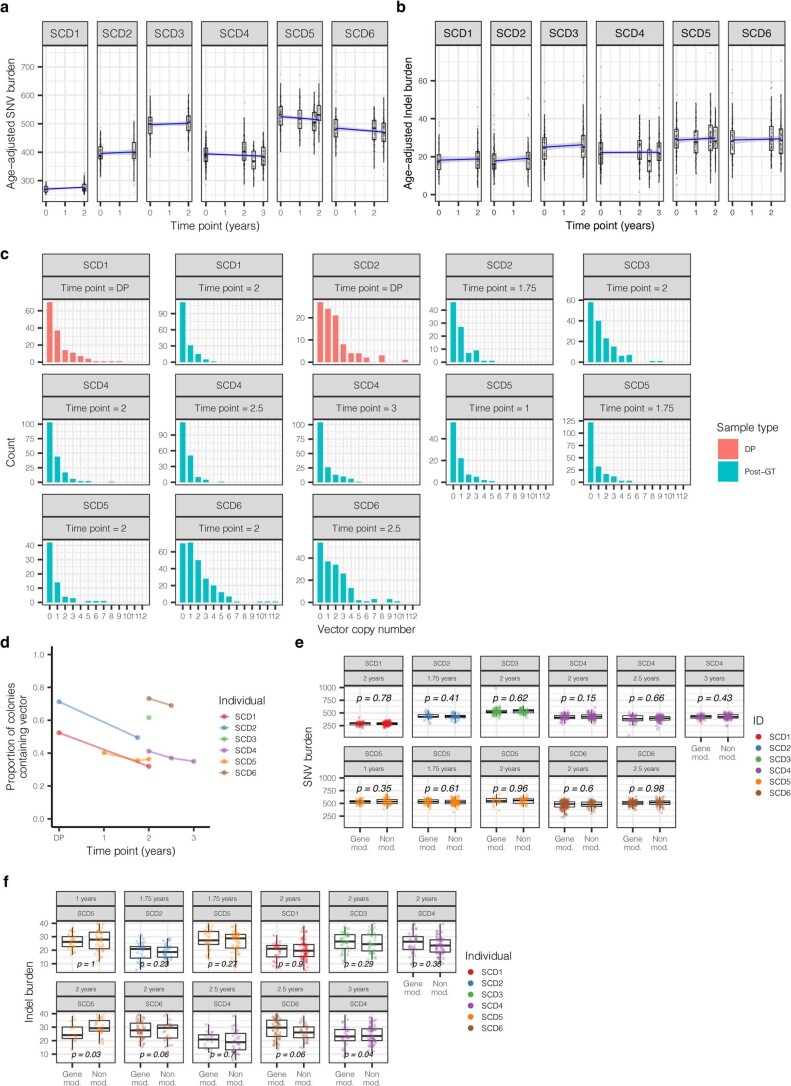
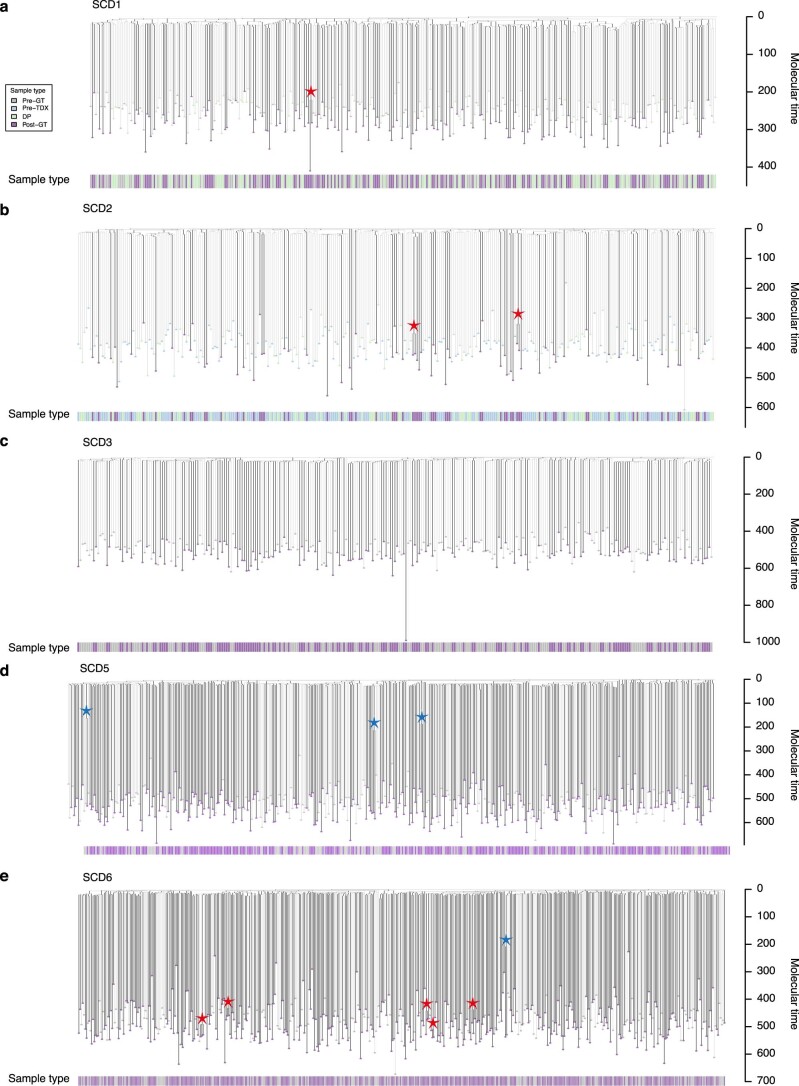
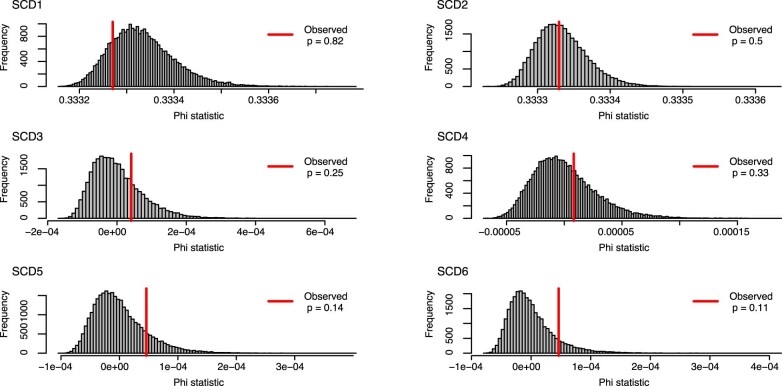
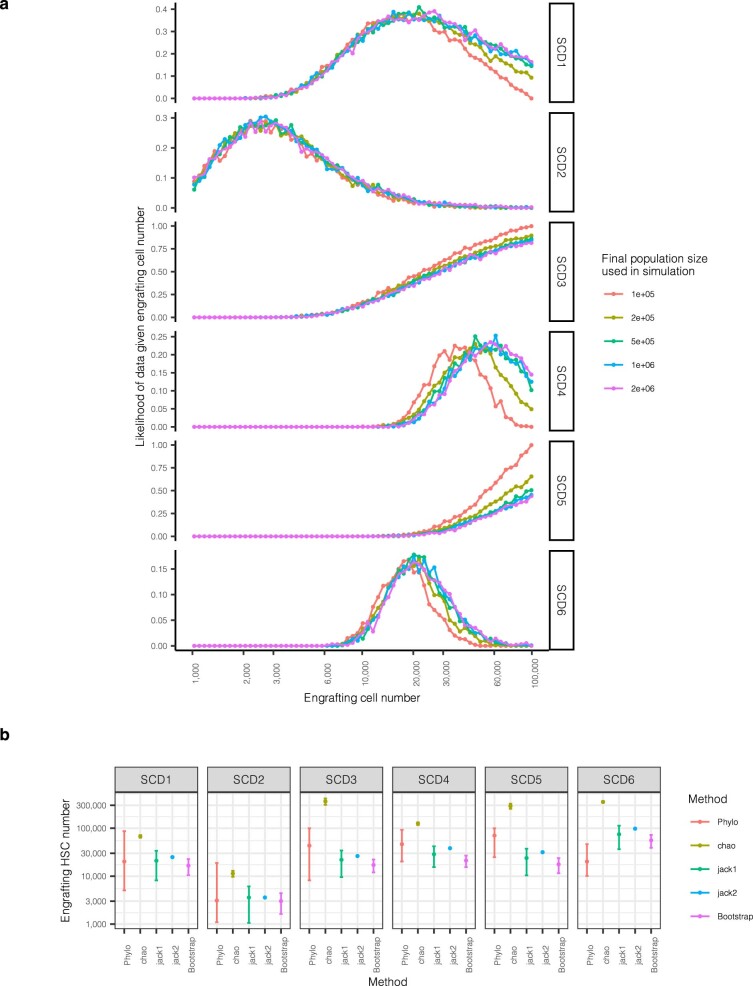
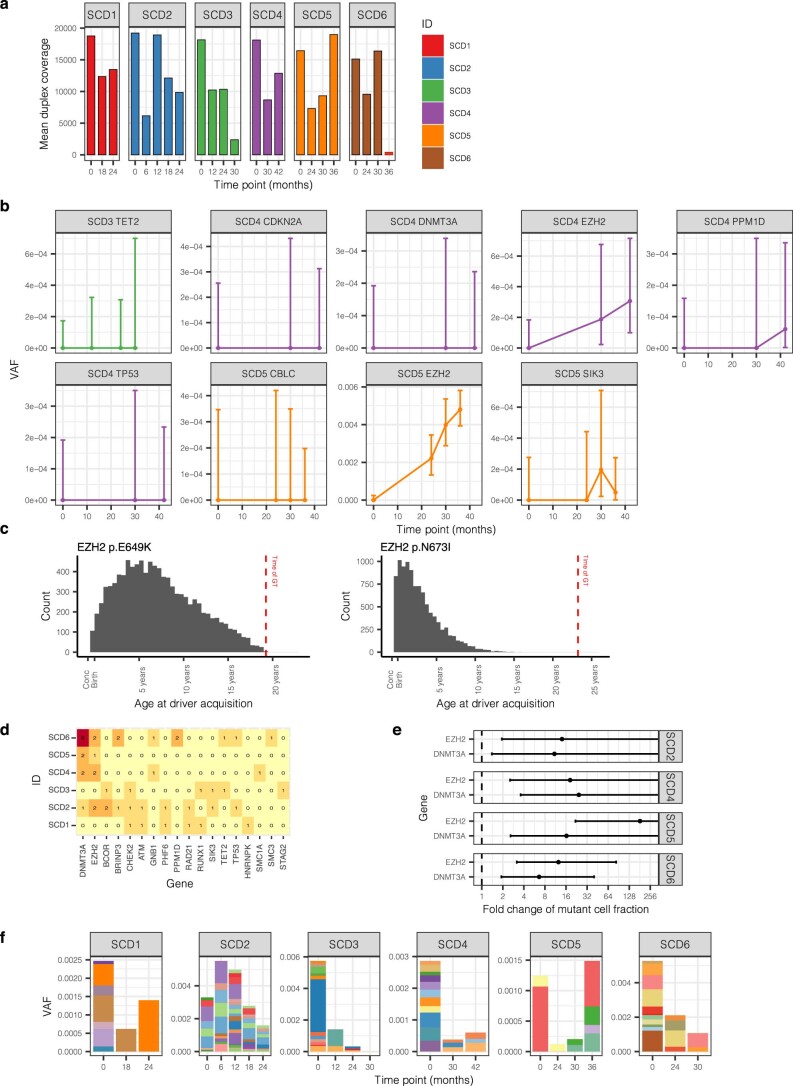
Gene therapy (GT) provides a potentially curative treatment option for patients with sickle cell disease (SCD); however, the occurrence of myeloid malignancies in GT clinical trials has prompted concern, with several postulated mechanisms. Here, we used whole-genome sequencing to track hematopoietic stem cells (HSCs) from six patients with SCD at pre- and post-GT time points to map the somatic mutation and clonal landscape of gene-modified and unmodified HSCs. Pre-GT, phylogenetic trees were highly polyclonal and mutation burdens per cell were elevated in some, but not all, patients. Post-GT, no clonal expansions were identified among gene-modified or unmodified cells; however, an increased frequency of potential driver mutations associated with myeloid neoplasms or clonal hematopoiesis (DNMT3A- and EZH2-mutated clones in particular) was observed in both genetically modified and unmodified cells, suggesting positive selection of mutant clones during GT. This work sheds light on HSC clonal dynamics and the mutational landscape after GT in SCD, highlighting the enhanced fitness of some HSCs harboring pre-existing driver mutations. Future studies should define the long-term fate of mutant clones, including any contribution to expansions associated with myeloid neoplasms.


Conflict of interest statement

P.J.C. is a co-founder, stockholder and consultant for FL86. M.A.F. is an employee and stockholder of AstraZeneca. D.G.K. receives laboratory funding from STRM.bio. D.A.W. serves on the following committees: Novartis steering committee, Beam Therapeutics scientific advisory board, Skyline Therapeutics (formerly Geneception) scientific advisory board and Biomarin insertion site advisor board. D.A.W. also acts as a consultant for Verve Therapeutics and Monte Rosa Therapeutics. He also has research funding from ExCellThera. E.B.E. served as a consultant for a bluebird bio steering committee. The remaining authors declare no competing interests.

Figures

Fig. 1
Fig. 1. Landscape of somatic mutations in SCD.
a, Dot-plot showing the number of mutations per HSPC for each patient plotted against the patient age at the time of sampling. SNV mutation burdens of individual HSPC colonies from before GT, with correction for coverage, are displayed per patient. Mean mutation burdens per individual are indicated by a cross. The black line indicates the expected mean mutation burden by age from a previous study looking at hematopoietically healthy individuals. The average total number of mutations per HSPC above (+)/below (−) the expected value is indicated in the colored boxes. The mutation burdens for each patient were individually tested against the reference mutation set using a linear mixed-effects model with ‘age’ and ‘patient/reference status’ as fixed effects, and ‘individual’ as a random effect, to see if the ‘patient/reference status’ term was significant (*P < 0.05, **P < 0.01, ***P < 0.001). Exact P values for SCD1 to SCD6 were 9.5 × 10−3, 1.1 × 10−3, 9.7 × 10−5, 0.41, 1.0 × 10−2 and 0.54, respectively. b, Mutational signature analysis reflecting the underlying mutational processes that have been active within sequenced HSPCs. Signatures incorporate the base substitution types in the context of the bases immediately 5′ and 3′ to the mutated bases. Interpretation of each signature, by comparison with known signatures, is shown to the right of each profile. The contributions of each signature to each sample are shown in Extended Data Fig. 2c. Sig., signature. c, Phylogenies showing relatedness of the pre-GT colonies from each individual. Branches are scaled by the number of mutations allocated to that branch and corrected for sequencing depth such that branch lengths reflect the number of mutations acquired in that ancestral lineage. Given the fairly constant rate of mutation acquisition, this is a surrogate for time passed in that lineage and is termed ‘molecular time’.
Fig. 2
Fig. 2. Gene therapy induces few additional somatic mutations.
a, SNV mutation burdens of HSPC colonies (n = 1,564) from six individual patients plotted against the time point of colony sampling (relative to the GT procedure). The box-and-whisker plots show the distribution of mutational burden per colony per time point within each individual, with the boxes indicating median and interquartile range (IQR). The upper whisker extends from the hinge to the largest value no further than 1.5 × IQR from the hinge and the lower whisker extends from the hinge to the smallest value at most 1.5 × IQR of the hinge. The overlaid points are the jittered observed mutational burden of individual colonies. The solid blue line represents the inferred correlation between the mutation burden and the time point (simple univariate linear model), with the gray-shaded area showing the 95% confidence interval of this correlation. Time 0 represents data from samples taken at baseline for all patients. b, Estimate of the number of excess SNV mutations acquired from the GT procedure for individual patients. c, Excess indel mutations acquired from the GT procedure. For b and c, dots represent the difference in mean age-adjusted values between pre- and post-GT samples (n = 1,564 total colonies) and the bars show the 95% confidence interval of the estimated true difference between mean values (two-sided t-test). P values for SNV comparisons were 0.0051, 0.54, 0.52, 0.41, 0.067 and 0.090 for SCD1 to SCD6, respectively. P values for indel comparisons were 0.18, 0.19, 0.41, 0.61, 0.72 and 0.71 for SCD1 to SCD6, respectively. *P < 0.05.
Fig. 3
Fig. 3. Combined phylogenies of pre- and post-gene therapy colonies and estimates of the number of engrafting long-term repopulating cells.
a, Phylogeny of HSPC colonies sampled pre- and post-GT from the individual SCD4. Tips of pre-GT samples are shown in light gray, whereas those of post-GT samples are shown in purple. Branches from pre-GT samples only are shown in light gray and branches from post-GT samples (or both) are shown in dark gray. Branches are scaled according to the number of mutations allocated to that branch. Blue stars highlight post-embryonic late-branching events occurring before GT; red stars highlight post-embryonic branching events occurring after GT. b, Density plot showing estimates of the number of engrafting HSCs for each individual.
Fig. 4
Fig. 4. The proportion of colonies harboring driver mutations increases post-gene therapy.
a, Dot-plot showing the proportion of HSPC colonies sampled pre- and post-GT with a potentially pathogenic driver mutation in each individual (n = 2,592 total colonies sampled). Pre-GT samples were taken at baseline for all patients; post-GT data include all post-GT time points analyzed for each patient. Dots show the exact proportion and error bars indicate the 95% confidence interval (exact binomial test). b, Table of potential driver mutations detected in the single-cell colony sequencing data. Where sequencing of pre- and post-GT samples was performed, we show whether the clone was substantially larger after GT and the fold change. The ‘time point’ column indicates when the samples were taken from each patient (years post-GT). The ‘gene mod.’ column indicates whether the mutation was found in a gene-modified or unmodified HSPC colony. c, Dot-plots showing the clonal trajectories of nine driver clones from pre-GT (time, 0, baseline only), through to the last available time of follow-up. The patient ID numbers and mutated gene are indicated for each plot. Dots show the exact VAF (number of variant reads divided by total coverage at that site) and error bars show the 95% confidence interval (binomial test). d, Lollipop plot showing the locations of altered amino acids in EZH2 (n = 7) and DNMT3A (n = 11) caused by missense mutations called in high-depth duplex targeted sequencing for individuals SCD2, SCD4, SCD5 and SCD6. e, Bar plots showing the total burden of DNMT3A (top) and EZH2 (bottom) mutations from pre-GT (time point, 0) through to the last follow-up sample available. The center of the error bars is the sum of the VAFs of each individual mutation. Error bars show the 95% confidence interval of this value (Bayesian inference approach).
Extended Data Fig. 1
Extended Data Fig. 1. Sequencing coverage and colony outcomes.
a, Histograms of sequencing coverage of all colonies that had >4× coverage, divided by individual. Mean coverage values per individual are indicated. b, Final outcomes of all colonies submitted for whole-genome sequencing, separated by individual and time point. Colonies with <4× sequencing coverage were excluded as insufficient coverage. Non-clonal and duplicate samples were identified as described in Methods.
Extended Data Fig. 2
Extended Data Fig. 2. Mutation burdens and signatures prior to gene therapy.
a, Extracted mutational signatures that were deemed likely to be due to artefactual / in vitro-acquired mutations, generally accounting for small numbers of mutations in each sample. b, As per Fig. 1a, but for indels. c, Barplot showing contributions of each mutational signature to the mutation burden of individual samples. Each vertical line represents the mutations in a sample, with the color indicating the absolute contribution of each signature to those mutations. d, Absolute mutation contributions of each signature per sample by individual (n=2,593 colonies total). The box-and-whisker plots show the distribution of absolute mutation signature contributions per colony within each individual, with the boxes indicating median and interquartile range. The upper whisker extends from the hinge to the largest value no further than 1.5 * IQR from the hinge and the lower whisker extends from the hinge to the smallest value at most 1.5 * IQR of the hinge. The overlaid points are the jittered observed signature contributions to individual colonies. e, Indel mutational signature profile across all samples. Sig. = signature.
Extended Data Fig. 3
Extended Data Fig. 3. Hydroxycarbamide exposure.
a, Approximate total length of hydroxycarbamide exposure in years for each SCD patient. b, Dot-plot showing the relationship between the mean mutation burden attributed to mutational signature ‘Sig.5’ per cell, and the years of hydroxycarbamide exposure in each individual. Of note, the extracted ‘Sig.5’ signature does not appear to be a ‘clean’ signature, demonstrating probable contamination by signature SBS19. The unique components of the ‘Sig.5’ signature are the T>A and T>G base pair changes seen at a TTT or TTA trinucleotide context. c, Here we consider only the T>A/ T>G mutations at a TTT or TTA trinucleotide context, the unique component of the extracted ‘Sig.5’ mutational signature. Dot-plot showing the relationship between the average number of such mutations per cell, and the years of hydroxycarbamide exposure in each individual. A regression analysis including age as a covariate suggests an additional 1.1 additional mutations per year of hydroxycarbamide exposure per HSC (95% CI, 0.3–1.9).
Extended Data Fig. 4
Extended Data Fig. 4. Copy number alterations and structural variants.
Larger chromosomal changes were assessed, resulting in the identification of 42 structural variants (SVs) and 11 copy number abnormalities (CNAs) across all 2,592 pre- and post-GT colonies. a, Stacked bar plot showing the average number of CNAs per colony in each individual, divided by CNA type. Total numbers of CNAs in each individual is shown above the bar. Pre- and post-therapy samples are considered together. All alterations were acquired independently, as confirmed by the phylogeny. b, As per a, but for SVs. Here, two of the SVs in SCD2 were a single acquisition present in two colonies. c, Stacked bar plot showing specific CNAs and the samples they were found in, divided by individual and pre- / post-therapy. The bar fill represents the specific abnormality. A particular excess of SVs were seen in SCD2 who had 9/312 colonies (2.9%, 95% CI 1.3–5.4%) harboring an SV. d, The SNV-based phylogenies of SCD2 and SCD6, with the SVs overlaid on the branches during which they were acquired. Branches are colored by the type of SV. The 133Kb deletion in chromosome 16 in SCD2, and the 112Kb duplication in chromosome 3 in SCD6 can be timed to before 20 mutations of molecular time, equating to the first trimester of in utero development. del = deletion, dup = duplication, inv = inversion.
Extended Data Fig. 5
Extended Data Fig. 5. Mutation burdens and vector copy number of post-transduction samples.
a, SNV mutation burdens of colonies from all patients (n=1,564 colonies total) plotted against the time point of colony sampling (relative to the gene therapy procedure), with post-therapy burdens corrected for the additional mutations expected from increased age, assuming 16.8 mutations per year per HSC. The box-and-whisker plots show the distribution of mutational burden per colony per time point within each individual, with the boxes indicating median and interquartile range. The upper whisker extends from the hinge to the largest value no further than 1.5 * IQR from the hinge and the lower whisker extends from the hinge to the smallest value at most 1.5 * IQR of the hinge. The overlaid points are the jittered observed mutational burden of individual colonies. The solid blue line represents the inferred correlation between the mutation burden and the time point (simple univariate linear model), with the gray shaded area showing the 95% confidence interval of this correlation. Time 0 represents data from samples taken at baseline for all patients. b, As per a, but of indel mutations. c, Barplot showing the number of post-therapy or donor product samples with different vector copy number values, split by individual and time point. d, Dot-plot showing the proportion of colonies that are transduced with at least one copy of the vector. This includes data from post-therapy and drug product colonies only. Where individuals have values from multiple time points, these are joined by a line to aid visualization. e-f, Box-and-whisker plots showing the corrected SNV and indel burdens for individual colonies from post-gene therapy time points (n=1,564 colonies total) separated by colonies with no evidence of vector integration (‘unmodified’), and those with at least one vector integration site (‘gene modified’). The boxes indicate median values and interquartile range. The upper whisker extends from the hinge to the largest value no further than 1.5 * IQR from the hinge and the lower whisker extends from the hinge to the smallest value at most 1.5 * IQR of the hinge. The overlaid points are the jittered observed mutational burden of individual colonies. The printed p-values relate to the significance of differences between the gene modified and non-modified colonies (two-sided t-test). DP = drug product.
Extended Data Fig. 6
Extended Data Fig. 6. Post-gene therapy phylogenetic trees.
a-d, Phylogeny of pre- and post- gene therapy colonies from SCD1 (a), SCD2 (b), SCD3 (c), SCD5 (d) and SCD6 (e). Tips of pre-therapy samples are light gray, while those of post-therapy samples are purple. Branches from pre-therapy samples only are colored light gray. Branches from post-therapy samples (or both) are in dark gray. Branches are scaled according to the number of SNVs allocated to that branch, termed ‘molecular time’. Blue stars highlight post-embryonic coalescences occurring prior to gene therapy. Red stars highlight post-embryonic coalescences occurring around the time of gene therapy. GT = Gene therapy. TDX = transduction. DP = Drug product.
Extended Data Fig. 7
Extended Data Fig. 7. Analysis of molecular variance.
Analysis of molecular variance (AMOVA) was used to test for clustering of post-therapy samples on the phylogenetic tree. Red lines show the observed phylogenetic clustering of pre- and post-therapy samples on the phylogenetic tree, as measured by the ‘Phi’ statistic. The significance of this statistic is obtained by comparing the value to the values obtained from random shuffles of sample labels (n = 1000) shown here as histograms. The one-sided p-values are the proportion of random shuffles with greater clustering than that observed in the data.
Extended Data Fig. 8
Extended Data Fig. 8. Approximate Bayesian Computation for inference of engrafting cell numbers.
Schematic of the approximate Bayesian computation approach used for inferring the engrafting cell number for SCD3 and SCD4. This complements the text in Supplementary Methods.
Extended Data Fig. 9
Extended Data Fig. 9. Analysis of molecular variance.
a, Dot-plot showing the proportion of simulations where the number of post-therapy coalescences matches that observed in the data (as per Fig. 3c), split by the final HSPC population size used in the simulation. The values in Fig. 3c represent values averaged over the different population sizes. b, Estimates of engrafting HSC numbers using our method and 4 other methods using vector integration site diversity analysis. For our method (‘Phylo’), dots represent the median posterior value, and error bars the 95% posterior interval. For the vector integration site diversity methods, dots represent the point estimate, and error bars the approximate 95% confidence interval calculated as 1.96x the standard error on either side.
Extended Data Fig. 10
Extended Data Fig. 10. High depth targeted duplex sequencing.
a, Mean duplex coverage across targeted sites by individual and time point. The 36 month sample from SCD6 failed. b, The driver mutation itself was directly detected for four mutations (PPM1D p.R552*, SIK3 p.E531*, EZH2 p.E649K and EZH2 p.N673I), and in all cases, this was in a post-GT sample. Here, we show the VAF of putative driver mutations through time, as in Fig. 4c, but for the driver mutation only, rather than the average across all mutations within the clone. Dots show the exact VAF (number of variant reads divided by total coverage at that site) and error bars show the 95% confidence interval (binomial test). c, The inferred time of acquisition of the two driver mutations with the highest clone VAFs (EZH2 p.N673I and EZH2 p.649K mutations), compared to the time of gene therapy, showing their likely acquisition prior to therapy. d, Heatmap of numbers of driver mutations per gene by individual. e, Dot-plot showing the estimated fold change of the fraction of cells harboring mutations in DNMT3A or EZH2. The dots show the median posterior values and the error bars the 95% posterior interval as estimated by Bayesian inference. Where error bars extend all the way to the right of the plot, there is no upper bound of the posterior interval. f, Burden of synonymous/ intronic mutations called in the duplex sequencing data, displaying very different trajectories to those of the putative DNMT3A and EZH2 driver mutations shown in Fig. 4. GT = Gene therapy. VAF = Variant allele fraction.

Similar articles

Cited by

References

    1. High KA. Turning genes into medicines-what have we learned from gene therapy drug development in the past decade? Nat. Commun. 2020;11:5821. doi: 10.1038/s41467-020-19507-0. - DOI - PMC - PubMed
    1. Hacein-Bey-Abina S, et al. Sustained correction of X-linked severe combined immunodeficiency by ex vivo gene therapy. N. Engl. J. Med. 2002;346:1185–1193. doi: 10.1056/NEJMoa012616. - DOI - PubMed
    1. Boztug K, et al. Stem-cell gene therapy for the Wiskott–Aldrich syndrome. N. Engl. J. Med. 2010;363:1918–1927. doi: 10.1056/NEJMoa1003548. - DOI - PMC - PubMed
    1. Kang EM, et al. Retrovirus gene therapy for X-linked chronic granulomatous disease can achieve stable long-term correction of oxidase activity in peripheral blood neutrophils. Blood. 2010;115:783–791. doi: 10.1182/blood-2009-05-222760. - DOI - PMC - PubMed
    1. Hacein-Bey-Abina S, et al. A modified γ-retrovirus vector for X-linked severe combined immunodeficiency. N. Engl. J. Med. 2014;371:1407–1417. doi: 10.1056/NEJMoa1404588. - DOI - PMC - PubMed