. 2023 Nov 16;14(1):7427.
doi: 10.1038/s41467-023-43304-0.

Glutamine metabolism inhibition has dual immunomodulatory and antibacterial activities against Mycobacterium tuberculosis

Affiliations

Glutamine metabolism inhibition has dual immunomodulatory and antibacterial activities against Mycobacterium tuberculosis

Sadiya Parveen et al. Nat Commun. .

Abstract

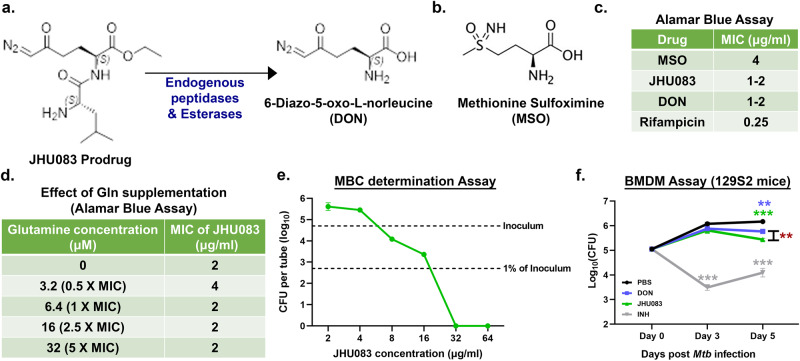
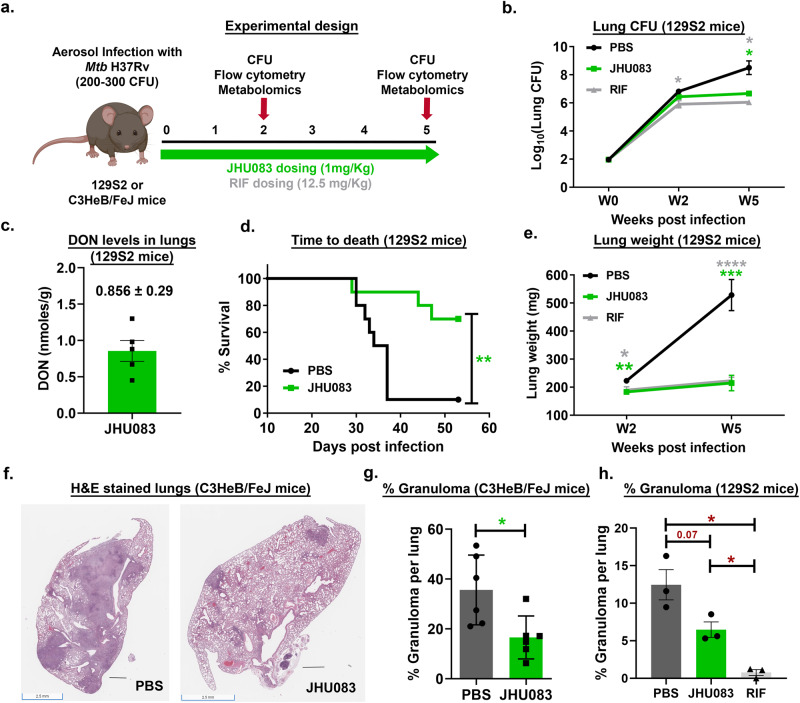
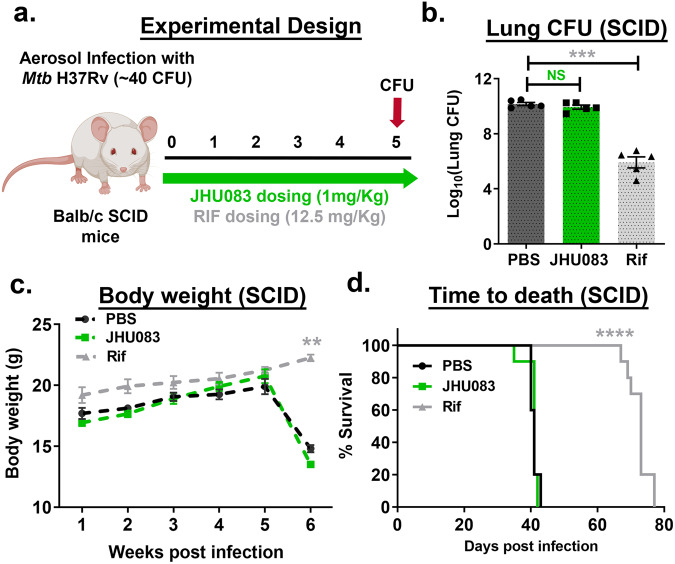
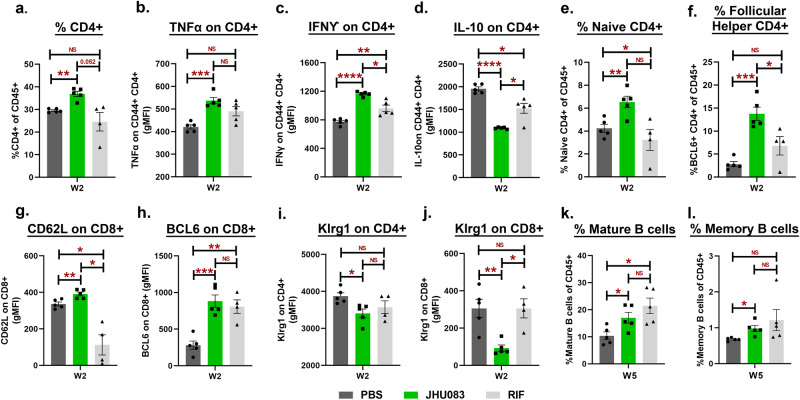
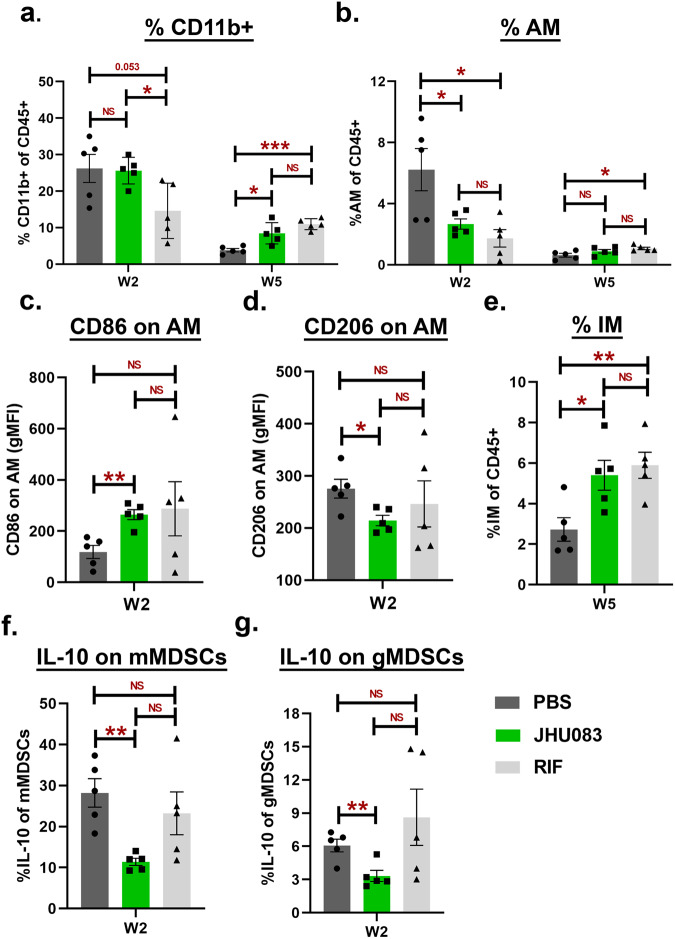
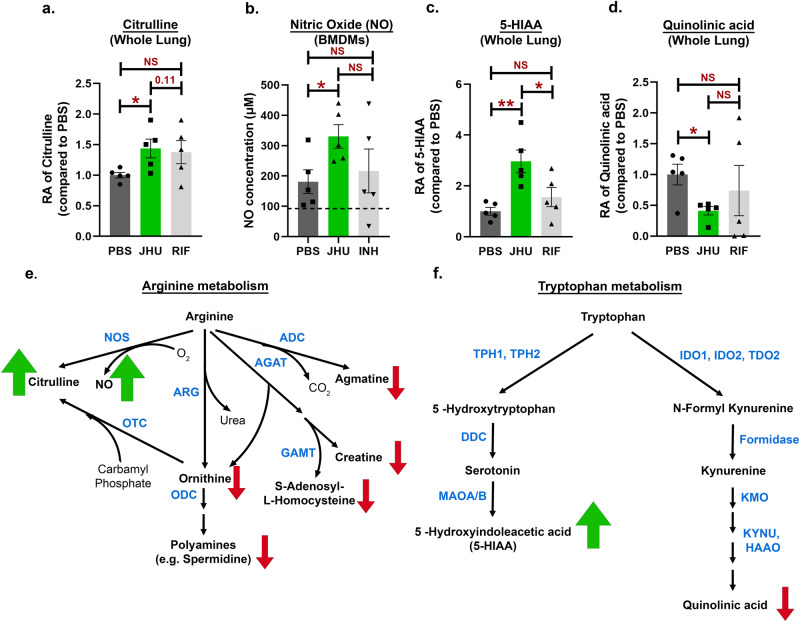
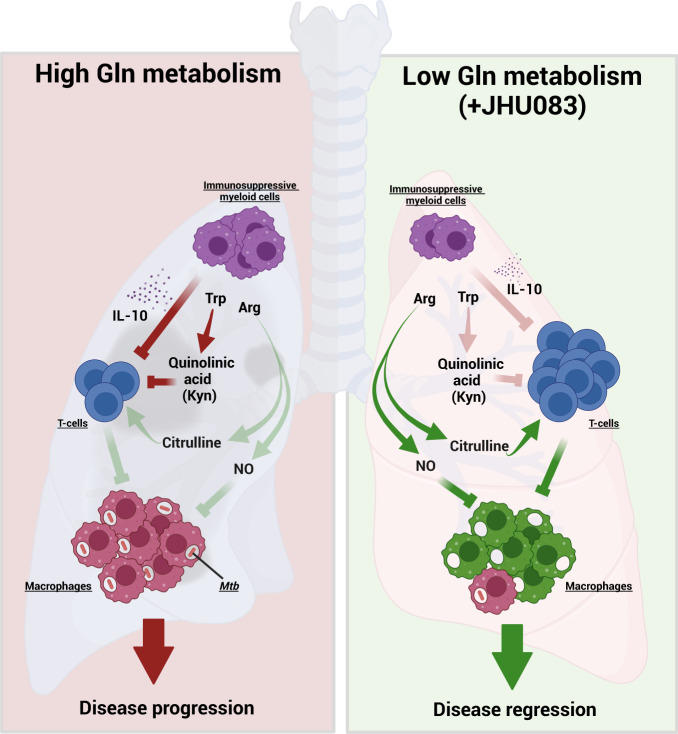
As one of the most successful human pathogens, Mycobacterium tuberculosis (Mtb) has evolved a diverse array of determinants to subvert host immunity and alter host metabolic patterns. However, the mechanisms of pathogen interference with host metabolism remain poorly understood. Here we show that a glutamine metabolism antagonist, JHU083, inhibits Mtb proliferation in vitro and in vivo. JHU083-treated mice exhibit weight gain, improved survival, a 2.5 log lower lung bacillary burden at 35 days post-infection, and reduced lung pathology. JHU083 treatment also initiates earlier T-cell recruitment, increased proinflammatory myeloid cell infiltration, and a reduced frequency of immunosuppressive myeloid cells when compared to uninfected and rifampin-treated controls. Metabolomic analysis of lungs from JHU083-treated Mtb-infected mice reveals citrulline accumulation, suggesting elevated nitric oxide (NO) synthesis, and lowered levels of quinolinic acid which is derived from the immunosuppressive metabolite kynurenine. JHU083-treated macrophages also produce more NO potentiating their antibacterial activity. When tested in an immunocompromised mouse model of Mtb infection, JHU083 loses its therapeutic efficacy suggesting the drug's host-directed effects are likely to be predominant. Collectively, these data reveal that JHU083-mediated glutamine metabolism inhibition results in dual antibacterial and host-directed activity against tuberculosis.


Conflict of interest statement

S.P., J.S., S.L., L.Z., B.K., J.R.M. and W.R.B. declare no conflict of interest. J.A., R.R., J.D.P. and B.S.S. are inventors on multiple Johns Hopkins University (JHU) patents covering glutamine antagonist prodrugs including JHU083 and their utility. These patents have been licensed to Dracen Pharmaceuticals Inc. R.R., J.D.P. and B.S.S. are founders of and hold equity in Dracen Pharmaceuticals Inc. This arrangement has been reviewed and approved by the JHU in accordance with its conflict-of-interest policies. R.D.L. is an inventor on US patent 10842763 submitted by Johns Hopkins University and licensed to Dracen Pharmaceuticals that covers the use of glutamine analogues, such as JHU083 (DRP-083), for cancer immunotherapy. The authors declare no other competing interests.

Figures

Fig. 1
Fig. 1. JHU083 has direct antimycobacterial activity in vitro.
a Chemical structures of the prodrug JHU083 and the active drug DON. Endogenous host esterases and peptidases convert JHU083 into DON. b Chemical structure of MSO. c Table showing the minimum inhibitory concentrations (MIC) values of the drugs against the Mtb H37Rv strain determined using the Alamar blue assay. d Table depicting the effect of glutamine (Gln) supplementation on the antimycobacterial activity of JHU083 using the Alamar blue assay. For each assay, a fixed concentration of Gln was used as shown with the assumed MIC of JHU083 being 2.0 μg/ml or 6.4 μM. e Graph showing the results of the minimal bactericidal concentration (MBC) determination assay. The top dotted line represents the starting inoculum of the Mtb culture while the bottom dotted line represents 1% of the initial inoculum. f Antibacterial activity of drugs against Mtb growing within bone-marrow derived macrophages (BMDMs). IFNγ-activated BMDM from 129S2 mice were infected with Mtb H37Rv at an MOI of 2. They were then treated with 10 μg/ml of either DON or JHU083 (5x the MIC of each drug assuming the MIC is 2.0 μg/ml). Isoniazid (INH) at 1.28 μg/ml was used as the positive control. The cells were lysed at indicated time points and plated on 7H11 selection plates. The assay was performed as described in the “Methods”. Data were plotted as mean ± SEM. Statistical significance was calculated using a two-tailed student t test considering unequal distribution. The exact p-values are provided in the Source Data file. * < 0.05, ** < 0.01, *** < 0.001. All the experiments were performed in triplicate.
Fig. 2
Fig. 2. JHU083 administration reduces Mtb proliferation and lung pathology in mice.
a Schematic of the mouse experiments. Six to ten weeks old 129S2 or C3HeB/FeJ mice (n = 4–10/group) were aerosol infected with ~200–300 CFU of Mtb H37Rv. The mice were treated with JHU083 or RIF by oral gavage starting one day after infection. 1 mg/kg of JHU083 was given daily for the first five days, and then the dose was reduced to 0.3 mg/kg daily (5/7, M-F). 12.5 mg/kg RIF was given daily orally for 5-weeks. b Lung bacillary burden in 129S2 mice treated with JHU083 or PBS or RIF (n = 5/group for week 2 & n = 4/group for week 5). Mice were sacrificed at day 0, week 2, and week 5 post-infection/treatment. The lungs were harvested, homogenized, diluted, and plated on 7H11 selection plates. After 21–25 days, the colonies were counted, and counts were transformed into log10 values and plotted. c DON levels in lungs of JHU083-treated, Mtb-infected 129S2 mice (n = 5/group) at 2 weeks post-infection, 30–40 min after receiving a 1 mg/kg dose of JHU083 (the tissue Tmax of JHU083 is 30 min post-oral dosing; full dosing details are in the Methods). DON levels were determined using LC/MS-based targeted metabolomics. d Survival of 129S2 mice treated with JHU083 or PBS. e Gross lung weight of 129S2 mice (n = 10/group) at weeks 2 and 5 post infection/treatment. f Histopathology of lungs isolated from C3HeB/FeJ mice infected with Mtb H37Rv at week 4.5 post-infection/treatment. The lungs were formalin fixed, sectioned, and stained with hematoxylin and eosin (H&E). g Quantitation of the lung granuloma areas in C3HeB/FeJ mice infected with Mtb H37Rv at week 4.5 post-infection/treatment (n = 6). h Quantitation of the lung granuloma areas in the 129S2 mice lungs infected with Mtb H37Rv at week 5 post-infection/treatment (n = 3). Both total granuloma area (GA) and lung area (LA) areas were measured using ImageScope software (Leica). The percent granuloma area (%GA) was calculated using the formula (%GA = (GA X 100)/LA). Data were plotted as mean ± SEM. Statistical significance was calculated using a two-tailed student t-test considering unequal distribution. For survival curve, log-rank (Mantel-Cox) and Gehan-Breslow-Wilcoxon tests were used and yielded similar p-value. The exact p-values are provided in the Source Data file. * < 0.05, ** < 0.01, *** < 0.001, **** < 0.0001. CFU stands for colony-forming units. All the experiments were repeated at least twice. The mouse clipart shown in 2a was created using Biorender.com (Tornonto, Canada) by SP.
Fig. 3
Fig. 3. JHU083 lacks therapeutic efficacy in Mtb-infected SCID mice.
a Schematic of the SCID mouse experiments. Six to ten weeks old Balb/c SCID mice (n = 5–10/group) were aerosol infected with ~40 CFU of Mtb H37Rv. The mice were then treated with JHU083 or rifampin (RIF) by oral gavage starting one day after infection. 1 mg/kg JHU083 was given daily for the first 5 days and then the dose was reduced to 0.3 mg/kg daily (5/7, M-F). b Lung CFU burden in SCID mice (n = 5/group) treated with JHU083, RIF, or PBS. Mice were sacrificed at week 5 post-infection/treatment. The lungs were harvested, homogenized, diluted, and plated on 7H11 selection plates. After 21–25 days, the colonies were counted, and counts were transformed into log10 values and plotted. c Body weights of SCID mice treated with JHU083, RIF, or PBS (n = 10/group). d Survival of SCID mice treated with JHU083, RIF, or PBS (n = 10/group). Data were plotted as mean ± SEM. Statistical significance was calculated using a two-tailed student t test considering unequal distribution. For survival curve, log-rank (Mantel-Cox) and Gehan-Breslow-Wilcoxon tests were used and yielded similar p-value. The exact p-values are provided in the Source Data file. * < 0.05, ** < 0.01, *** < 0.001, **** < 0.0001. CFU stands for colony-forming units. NS stands for non-significant change, p-value was >0.05. The experiment was repeated twice. The mouse clipart shown in 3a was created using Biorender.com (Tornonto, Canada) by SP.
Fig. 4
Fig. 4. JHU083 treatment elicits early recruitment of T-cells in the lungs.
As described in Fig. 2a, Mtb-infected female 129S2 mice (n = 5/group) were treated with JHU083, RIF, and PBS daily starting on day 1 post infection. Mice were sacrificed on week 2 and week 5, and the lungs were harvested. Single cell suspensions of the lungs from the three treatment groups were stained with appropriate antibodies and analyzed using multicolor-flow cytometry. We found differences in the frequencies or geometric mean fluorescence intensities (gMFI) for: (a) CD4+ T-cells, (b) TNFα expression on activated (CD44+) CD4+ T-cells, (c) IFNγ expression on activated (CD44+) CD4+ T-cells, (d) IL-10 expression on activated (CD44+) CD4+ T-cells, (e) naïve CD4+ T-cells, (f) follicular helper (BCL6+) CD4+ T-cells, (g) CD62L expression on CD8+ T-cells, (h) BCL6 expression on CD8+ T-cells, (i) Klrg1 expression on CD4+ T-cells, (j) Klrg1 expression on CD8+ T-cells, (k) mature B-cells (CD19+ CD27- CD138-), and (l) memory B-cells (CD19+ CD27+ CD138-). The X-axis indicates the lung harvest timepoint. All T-cell data (aj) came from the lungs harvested at week 2 (W2) post-infection/treatment while B-cell data (kl) was generated from lungs harvested at week 5 (W5) post-infection/treatment. For all graph panels, n = 5/group except RIF-treated group in graph (ej) due to loss of a sample during processing (n = 4). Data were plotted as mean ± SEM and are shown as the frequency of CD45+ population. gMFI was mostly used for low abundance cell surface markers and transcription factors. Statistical significance was calculated using a two-tailed student t-test considering unequal distribution. The exact p-values are provided in the Source Data file. * < 0.05, ** < 0.01, *** < 0.001, **** < 0.0001. NS stands for non-significant change, p-value was >0.05. The experiment was repeated two times.
Fig. 5
Fig. 5. JHU083 treatment modulates lung myeloid cell populations.
As described in Fig. 2a, Mtb-infected 129S2 mice were treated with JHU083, RIF, or PBS every day starting at day 1 post-infection (n = 5/group). The mice were sacrificed on week 2 and week 5, and the lungs were harvested. Single cell suspension of the lungs from all three treatment groups were stained with appropriate antibodies and analyzed using multicolor-flow cytometry (n = 5 mice). Details are provided in “Methods” section. We found differences in the frequencies or gMFI values for (a) CD11b+ myeloid cells, (b) alveolar macrophages (AM, CD11b+ SiglecF+), (c) CD86 expression upon AM, (d) CD206 expression upon AM, (e) interstitial macrophages (IM, CD11b+ SiglecF- F4/80+), (f) IL-10 expression upon monocytic myeloid-derived suppressor cells (mMDSCs, CD11b+ Ly6G- Ly6CHigh), (g) IL-10 expression upon granulocytic myeloid-derived suppressor cells (gMDSCs, CD11b+ Ly6G+ Ly6Clow). The X-axis indicates the lung harvest timepoint. Data were plotted as mean ± SEM and are shown as the frequency of CD45+ population. gMFI was mostly used for low abundance cell surface markers and transcription factors. Statistical significance was calculated using a two-tailed student t-test considering unequal distribution. The exact p-values are provided in the Source Data file. * < 0.05, ** < 0.01. NS stands for non-significant change, p-value was >0.05. The experiment was repeated twice.
Fig. 6
Fig. 6. JHU083 treatment drives metabolic reprogramming in Mtb-infected lungs.
As described in Fig. 2a, Mtb-infected 129S2 mice were treated with JHU083, RIF, or PBS every day starting at day 1 post-infection. Mice were sacrificed at week 2, the lungs were harvested, and total metabolites were methanol (MeOH) extracted as described in the “Methods”. The total metabolites were normalized to the tissue weight and then to the untreated controls. We detected significant changes in the levels of (a) citrulline in whole lung MeOH extract (n = 5/group), (b) nitric oxide (NO) in Mtb-infected BMDMs treated with JHU083 as measured by the Griess colorimetric assay (n = 5/group), (c) 5-hydroxyindole acetic acid (5-HIAA) in whole lung MeOH extract (n = 5/group), and (d) quinolinic acid in whole lung MeOH extract (n = 5/group). Schematic representation of the (e) arginine and (f) tryptophan metabolic pathways with metabolites indicated in black and enzymes in blue. Green/red arrows next to a metabolite indicate statistically significant accumulation/depletion, respectively, in the JHU083-treated whole lung MeOH extract group compared to that for the PBS control. Abbreviations: arginine decarboxylase (ADC), L-arginine:glycine amidinotransferase (AGAT), arginase (ARG), guanidinoacetate N-methyltransferase (GAMT), nitric oxide synthase (NOS), ornithine decarboxylase (ODC), ornithine decarboxylase (OTC), dopa decarboxylase (DDC), 3-hydroxyanthranilate 3,4-dioxygenase (HAAO); indoleamine 2,3-dioxygenase (IDO), kynurenine 3-monooxygenase (KMO), kynureninase (KYNU), monoamine oxidase A/B (MAOA/B), tryptophan 2,3-dioxygenase (TDO2), tryptophan hydroxylase (TPH1/2). Data were plotted as mean ± SEM. Statistical significance was calculated using a two-tailed student t-test considering unequal distribution. The exact p-values are provided in the Source Data file. * < 0.05, ** < 0.01. NS stands for non-significant change, p-value was >0.05. The experiment was performed twice.
Fig. 7
Fig. 7. Model depicting the mechanism of action of JHU083.
Under glutamine-sufficient conditions, IL-10 produced by immunosuppressive myeloid cells (MDSCs) and quinolinic acid (a product of the tryptophan/kynurenine pathway) inhibit T-cell proliferation and function, promoting infection and disease progression. Glutamine antagonist JHU083, decreases IL-10-producing MDSCs leading to a higher frequency of activated T-cells. JHU083 treatment was associated with lower lung levels of quinolinic acid suggesting a corresponding reduction in the immunosuppressive metabolite kynurenine (Kyn). It also led to higher lung levels of citrulline suggesting increased conversion of arginine to NO and citrulline. Experiments with Mtb-infected macrophages treated with JHU083 confirmed elevated release of NO, well-known to have antimycobacterial activity. These immunometabolic changes then lead to disease regression and improved lung histology. Red lines represent host-deleterious processes, while green lines are for host-protective processes. Trp Tryptophan, Arg Arginine, NO Nitric Oxide. The schematic was created using Biorender.com (Tornonto, Canada) by SP.

Update of

References

    1. WHO. Global tuberculosis report 2023. (2023).
    1. Cambier CJ, Falkow S, Ramakrishnan L. Host evasion and exploitation schemes of Mycobacterium tuberculosis. Cell. 2014;159:1497–1509. doi: 10.1016/j.cell.2014.11.024. - DOI - PubMed
    1. Jasenosky LD, Scriba TJ, Hanekom WA, Goldfeld AE. T cells and adaptive immunity to Mycobacterium tuberculosis in humans. Immunol. Rev. 2015;264:74–87. doi: 10.1111/imr.12274. - DOI - PubMed
    1. Morgan J, et al. Classical CD4 T cells as the cornerstone of antimycobacterial immunity. Immunol. Rev. 2021;301:10–29. doi: 10.1111/imr.12963. - DOI - PMC - PubMed
    1. Wu AA, Drake V, Huang HS, Chiu S, Zheng L. Reprogramming the tumor microenvironment: tumor-induced immunosuppressive factors paralyze T cells. Oncoimmunology. 2015;4:e1016700. doi: 10.1080/2162402X.2015.1016700. - DOI - PMC - PubMed

Publication types