. 2024 Sep;42(9):1404-1416.
doi: 10.1038/s41587-023-01977-4. Epub 2023 Nov 16.

Generation of locus coeruleus norepinephrine neurons from human pluripotent stem cells

Affiliations

Generation of locus coeruleus norepinephrine neurons from human pluripotent stem cells

Yunlong Tao et al. Nat Biotechnol. 2024 Sep.

Abstract

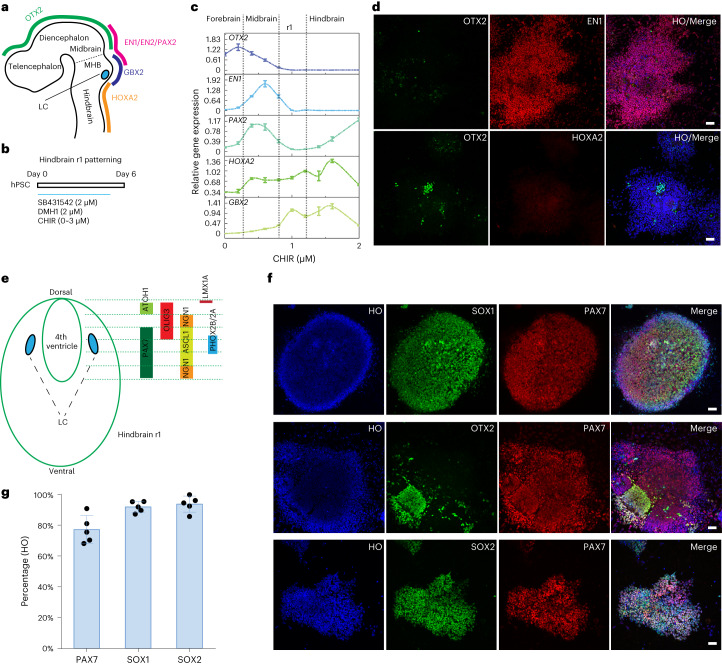
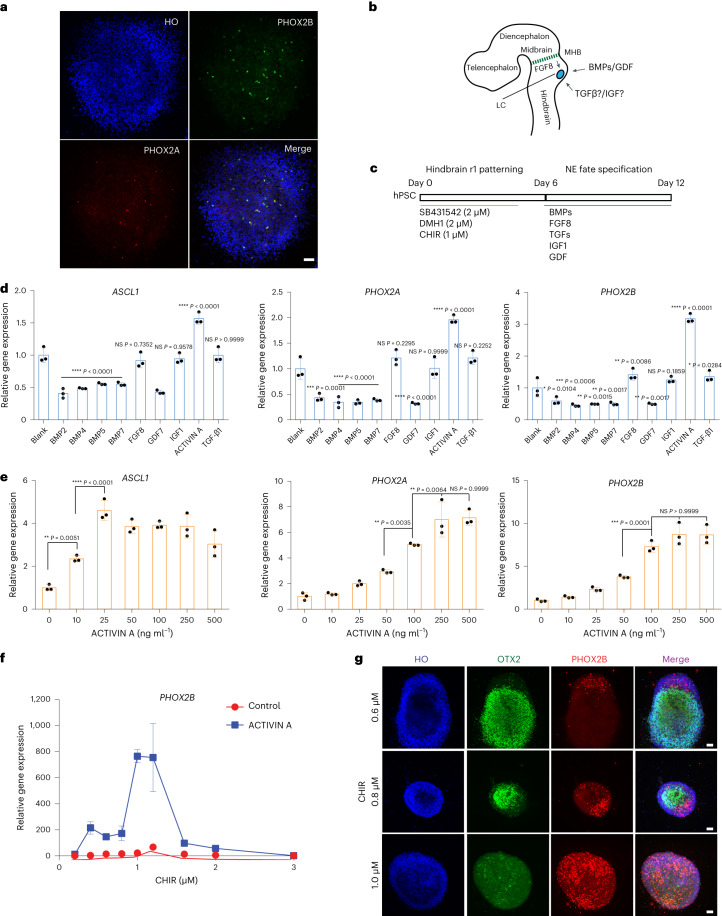
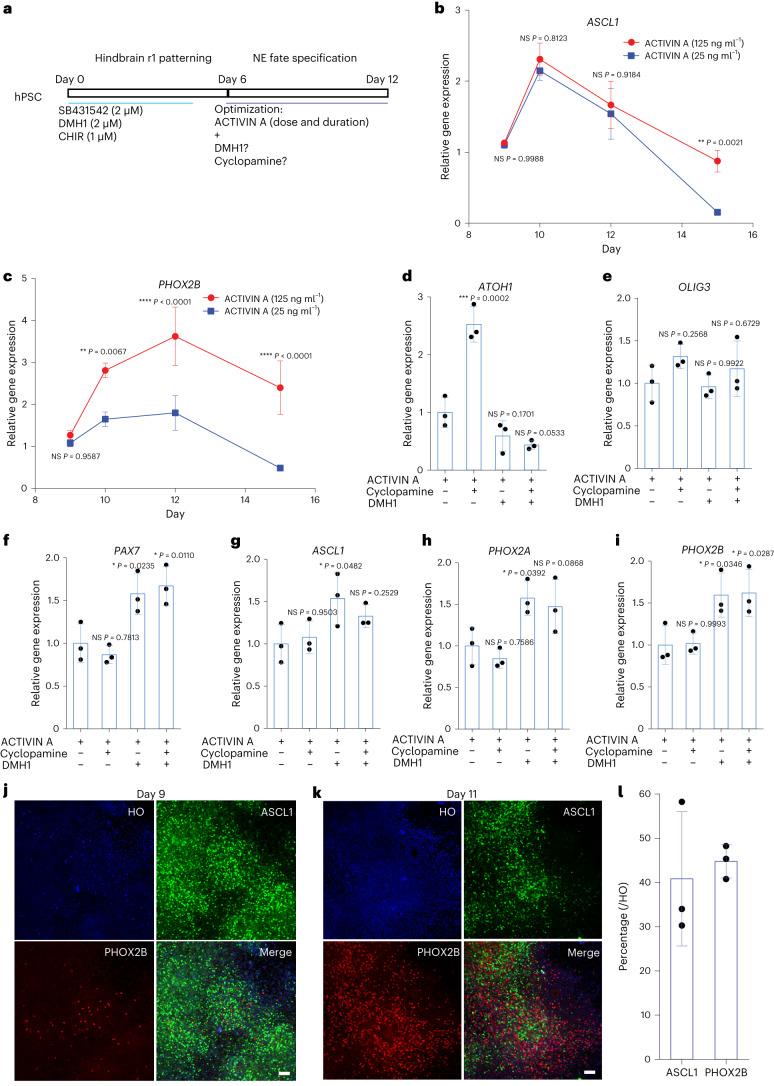
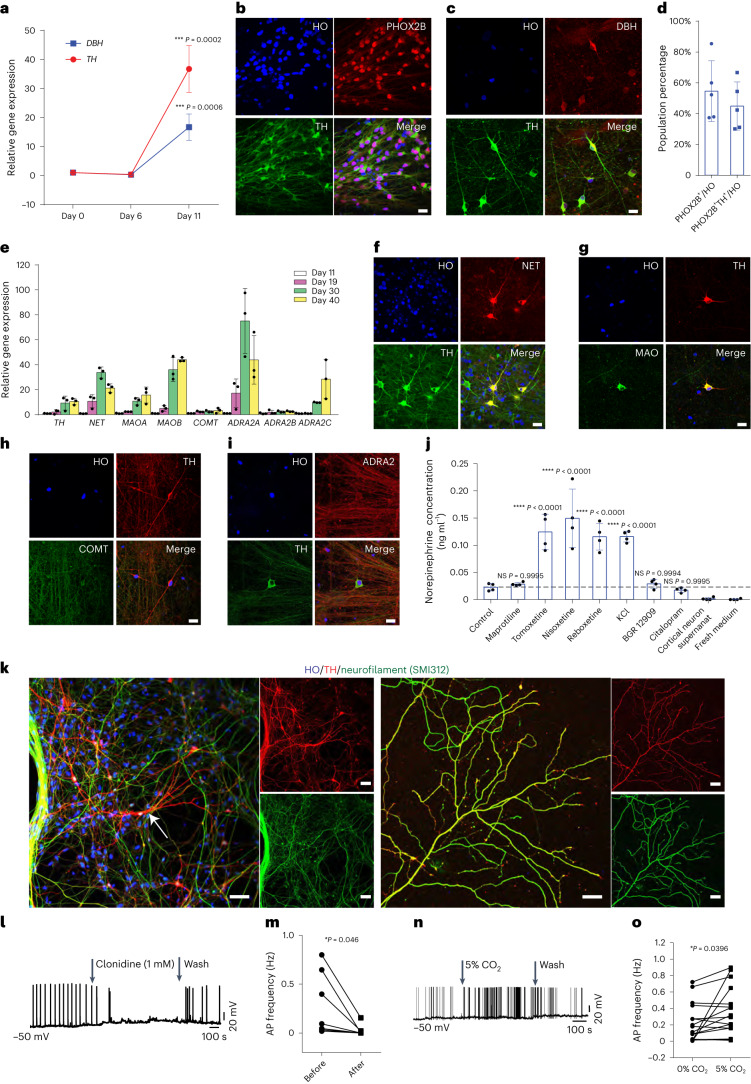
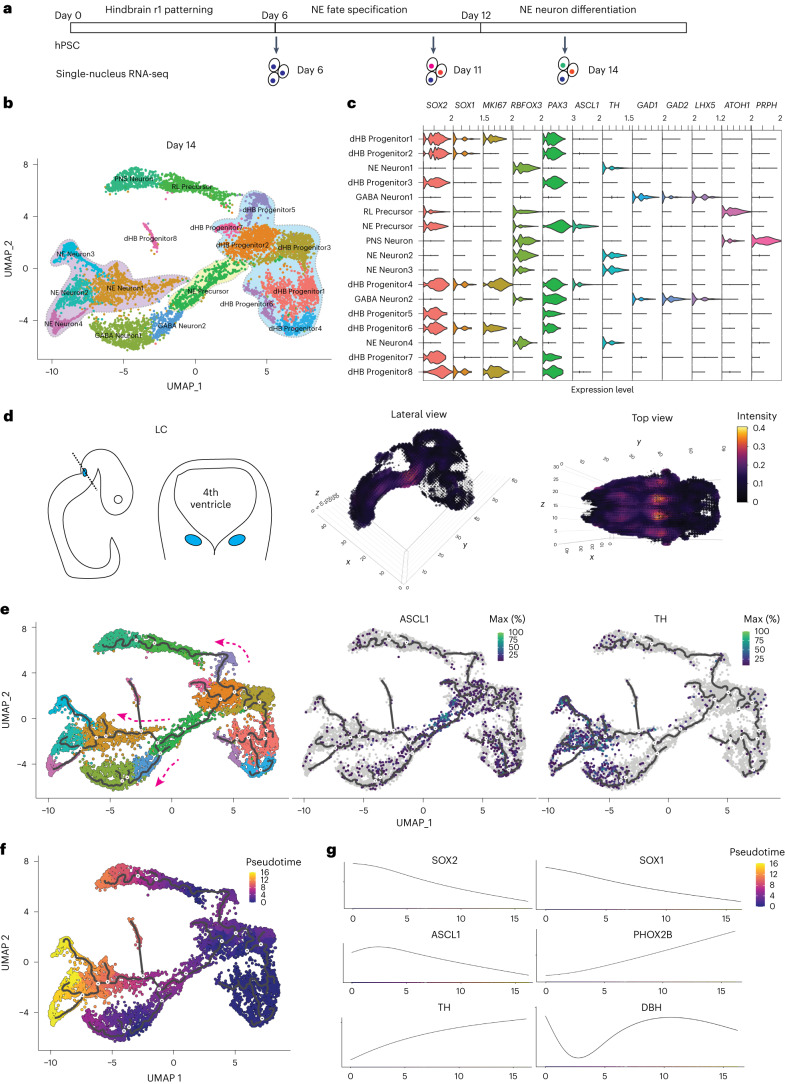
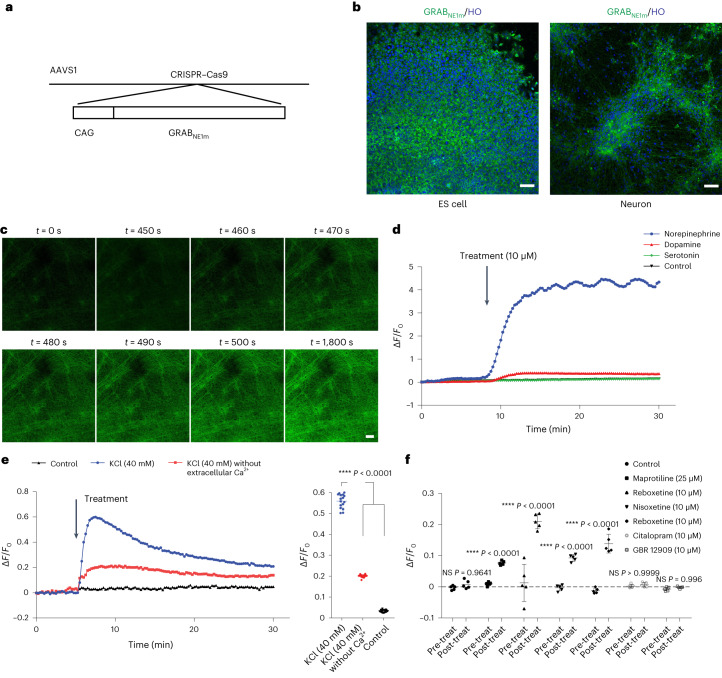
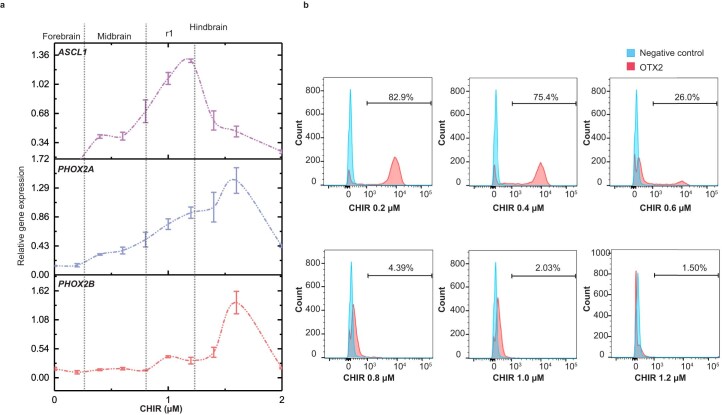
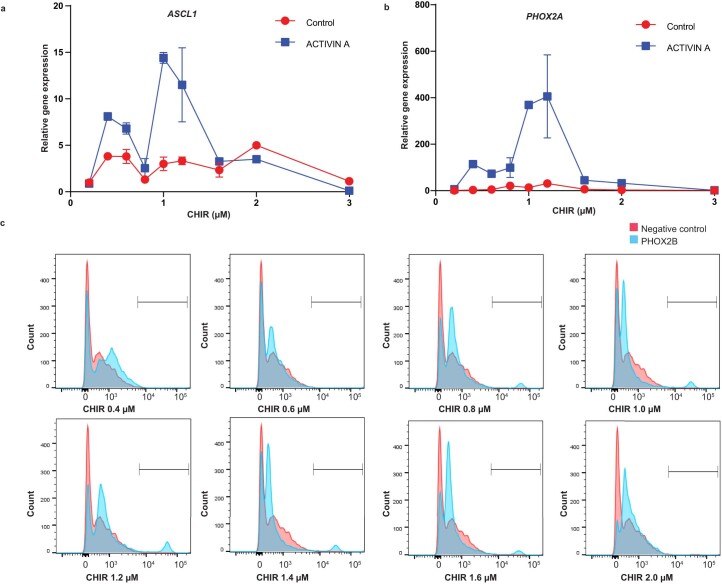
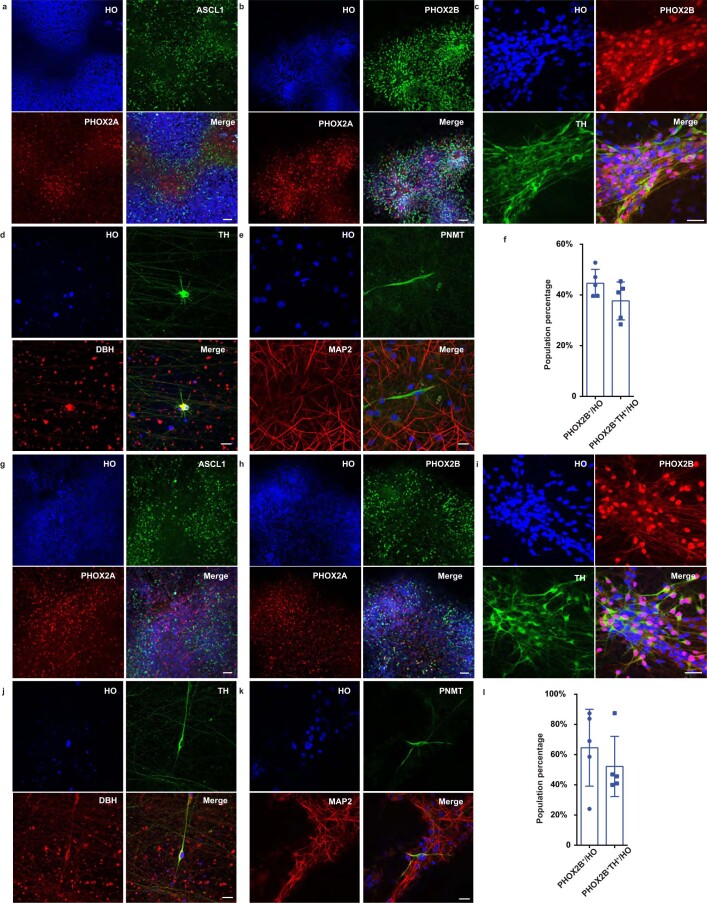
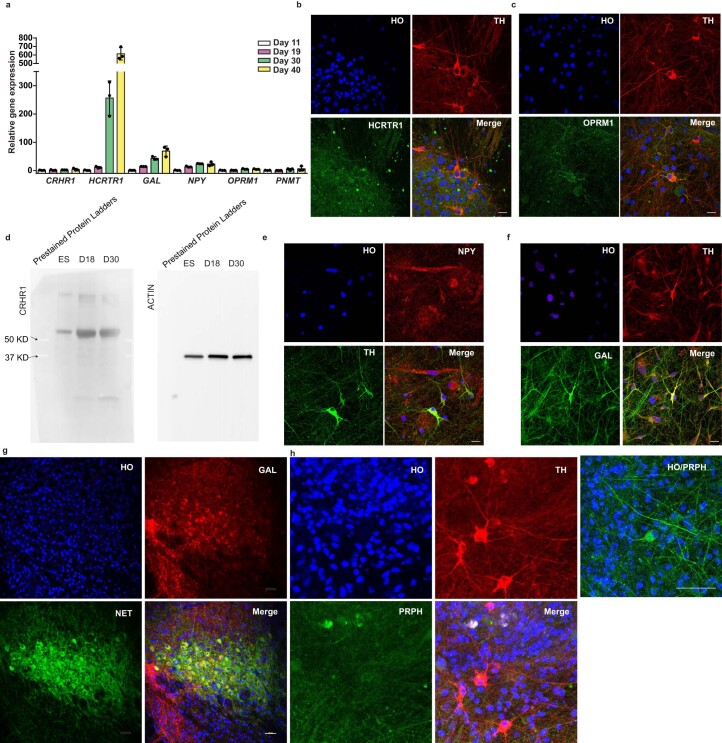
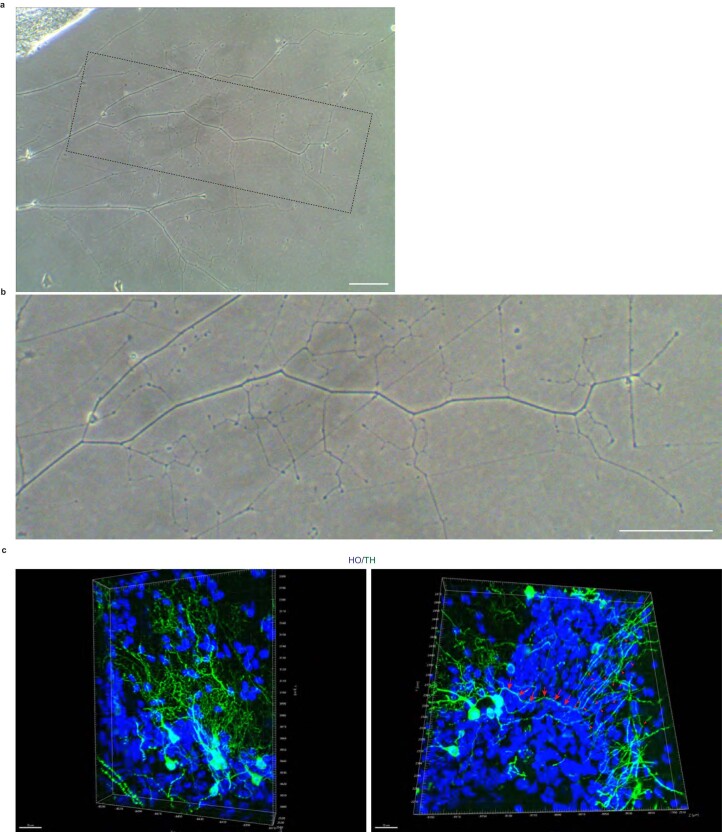
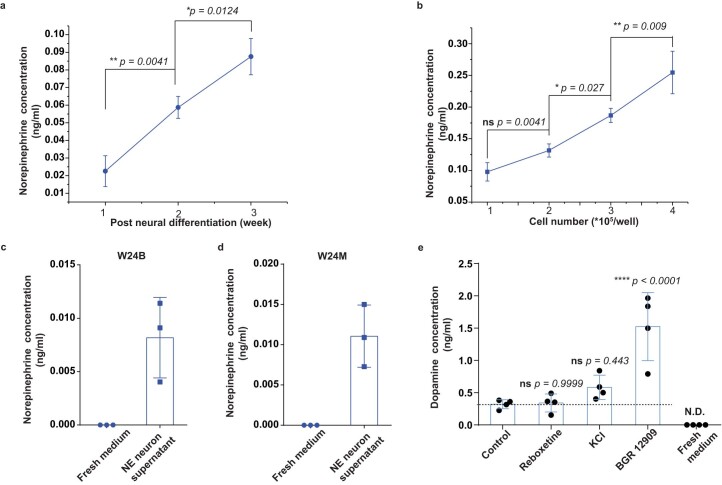
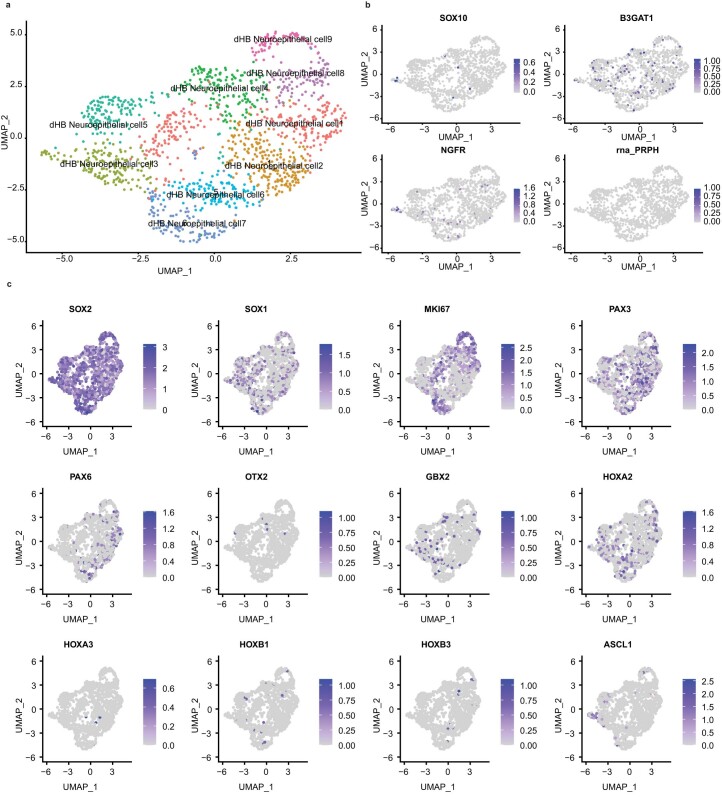
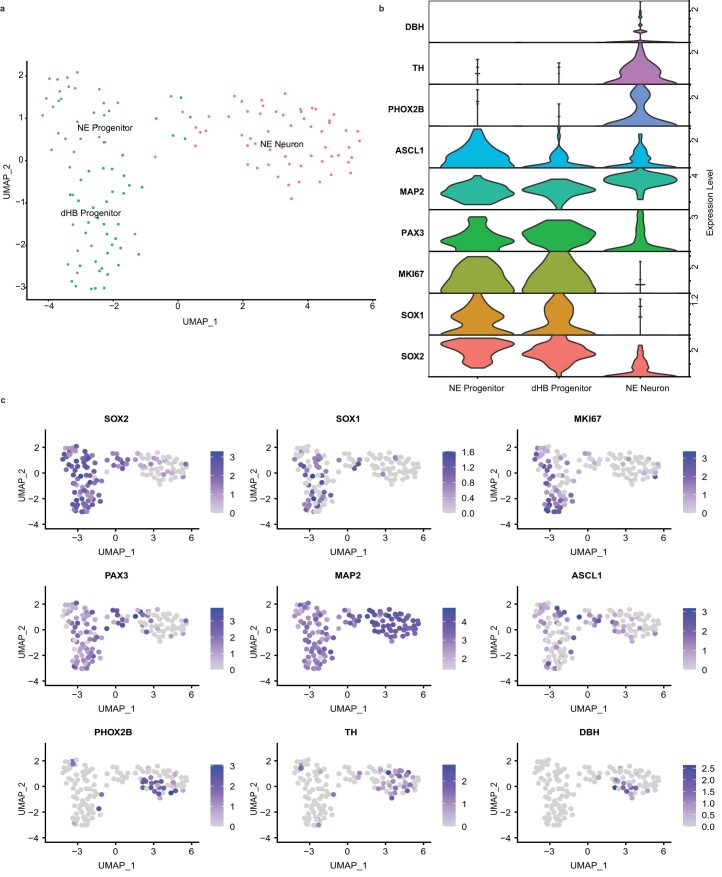
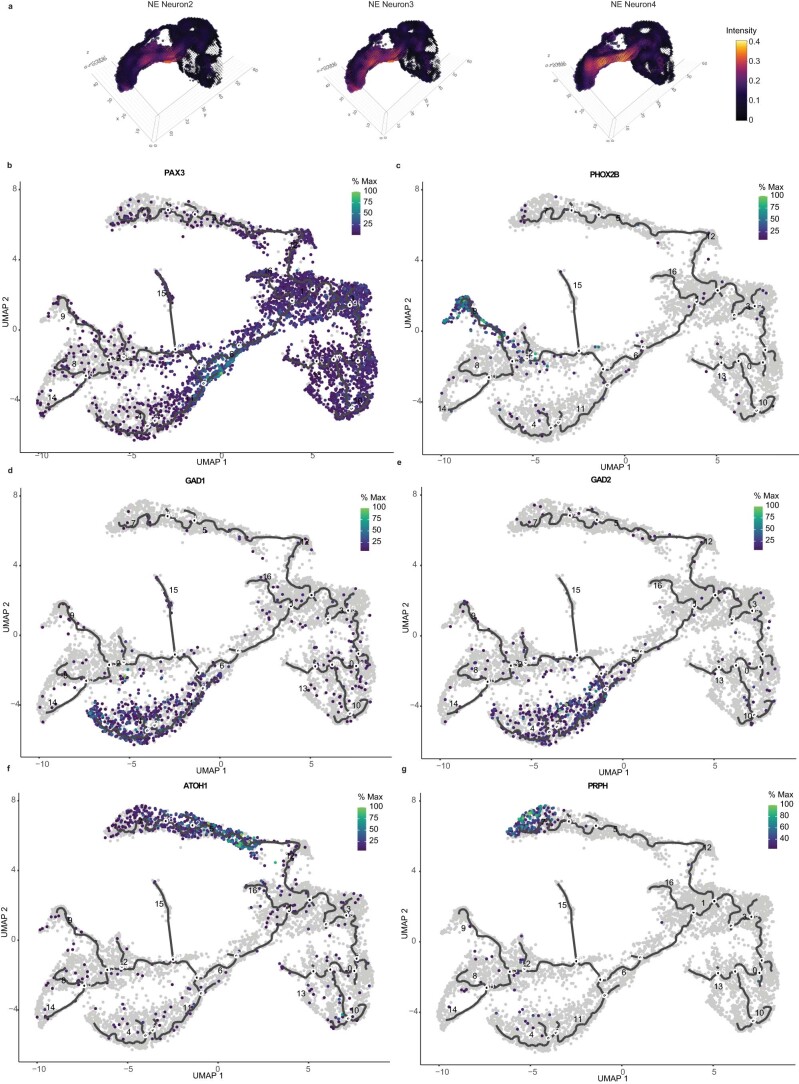
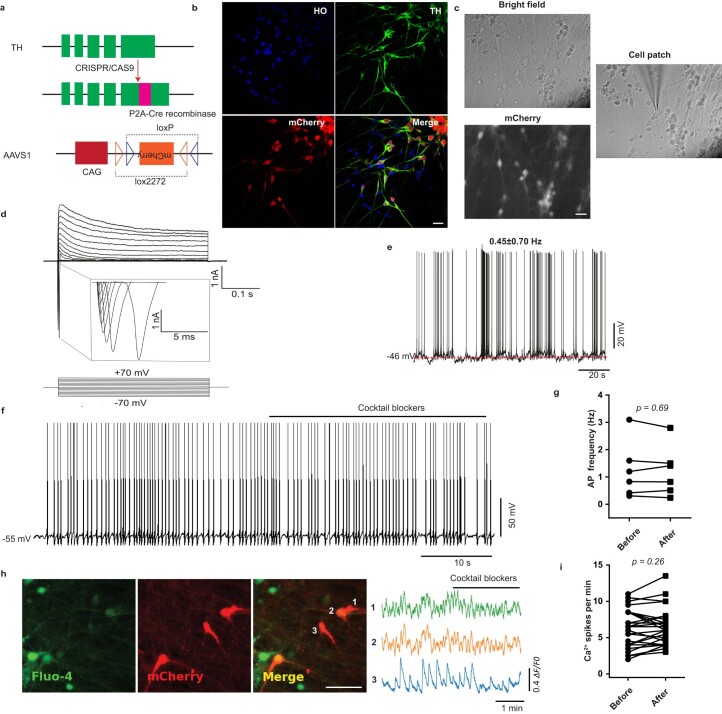
Central norepinephrine (NE) neurons, located mainly in the locus coeruleus (LC), are implicated in diverse psychiatric and neurodegenerative diseases and are an emerging target for drug discovery. To facilitate their study, we developed a method to generate 40-60% human LC-NE neurons from human pluripotent stem cells. The approach depends on our identification of ACTIVIN A in regulating LC-NE transcription factors in dorsal rhombomere 1 (r1) progenitors. In vitro generated human LC-NE neurons display extensive axonal arborization; release and uptake NE; and exhibit pacemaker activity, calcium oscillation and chemoreceptor activity in response to CO2. Single-nucleus RNA sequencing (snRNA-seq) analysis at multiple timepoints confirmed NE cell identity and revealed the differentiation trajectory from hindbrain progenitors to NE neurons via an ASCL1-expressing precursor stage. LC-NE neurons engineered with an NE sensor reliably reported extracellular levels of NE. The availability of functional human LC-NE neurons enables investigation of their roles in psychiatric and neurodegenerative diseases and provides a tool for therapeutics development.


Conflict of interest statement

The authors declare no competing interests. S.-C.Z. is a co-founder of BrainXell, Inc.

Figures

Fig. 1
Fig. 1. Specification of dorsal hindbrain (r1) neuroepithelia.
a, Schematic representation of LC location along the embryonic forebrain, midbrain and hindbrain and their corresponding homeodomain transcription factors. b, Experimental design to pattern hindbrain r1 region from hPSCs during the first 6 d of neural induction. c, Expression of forebrain, midbrain and hindbrain genes under a series of CHIR99021 (CHIR) concentrations. Data are shown as mean ± s.e.m. n = 3 biologically independent samples for each condition. d, Immunostaining for OTX2, EN1 and HOXA2 in day 6 cells when treated with 1.0 µM CHIR99021 in the presence of SB431542 and DMH1. Scale bar, 50 µm. e, Schematic representation of the hindbrain r1 domains along the dorsal to ventral subdomains and their corresponding transcription factors. f, Immunostaining for PAX7, SOX1 and SOX2 at day 6 from cells treated with 1.0 µM CHIR99021 in the presence of SB431542 and DMH1. HO, Hoechst. Scale bar, 50 µm. g, Quantification of SOX2-, SOX1- and PAX7-expressing cells at day 6 when treated with 1.0 µM CHIR99021. Data are shown as mean ± s.d. n = 5 biologically independent samples for each condition. Source data
Fig. 2
Fig. 2. Specification of NE progenitors.
a, Immunostaining for NE neural progenitor markers PHOX2A and PHOX2B at day 6 in cells treated with 1.0 µM CHIR99021 (CHIR). HO, Hoechst. Scale bar, 50 µm. b, Schematic representation of the potential morphogens that may affect NE progenitor fate specification. c, Experimental design to identify factors that positively affect NE progenitor specification. d, qPCR of NE progenitor markers ASCL1, PHOX2A and PHOX2B under the treatment of BMPs, FGF8, GDF7, IGF1, ACTIVIN A and TGFβ1. Data are shown as mean ± s.d. n = 3 biologically independent samples for each condition. The significance (versus ‘Blank’ condition) was assessed by one-way ANOVA (Dunnett’s multiple comparisons test). *P < 0.05, **P < 0.01,***P < 0.001 and ****P < 0.0001. NS, not significant. e, qPCR of NE progenitor markers ASCL1, PHOX2A and PHOX2B under a series of ACTIVIN A concentrations. Data are shown as mean ± s.d. n = 3 biologically independent samples for each condition. The significance was assessed by one-way ANOVA (Dunnett’s multiple comparisons test). *P < 0.05, **P < 0.01 and ***P < 0.001. NS, not significant. f, Relative PHOX2B expression in the presence or absence of ACTIVIN A (2nd week), whereas the cells were treated with a series of CHIR99021 concentrations at the first week. Data are shown as mean ± s.d. n = 3 biologically independent samples for each condition. g, Immunostaining for the regional marker OTX2 and NE progenitor marker PHOX2B at day 12 when cells were treated with 125 ng ml−1 ACTIVIN A. Scale bar, 50 µm. Source data
Fig. 3
Fig. 3. Temporal and concentration effects of ACTIVIN A on the expression of ASCL1 and PHOX2A/2B.
a, Experimental design to optimize NE progenitor fate specification at the second stage of differentiation. CHIR, CHIR99021. b,c, qPCR of ASCL1 and PHOX2B expression under 25 ng ml−1 and 125 ng ml−1 ACTIVIN A from day 9 to day 15. Data are shown as mean ± s.d. n = 3 biologically independent samples for each condition. The significance (comparison between 25 ng ml−1 and 125 ng ml−1 at the same timepoint) was assessed by two-way ANOVA (Sidak’s multiple comparisons test). *P < 0.05, **P < 0.01, ***P < 0.001 and ****P < 0.0001. NS, not significant. df, Expression of dorsal markers ATOH1, OLIG3 and PAX7 under the treatment of ACTIVIN A with or without DMH1/cyclopamine. Data are shown as mean ± s.d. n = 3 biologically independent samples for each condition. The significance (versus the first condition) was assessed by one-way ANOVA (Dunnett’s multiple comparisons test). *P < 0.05, **P < 0.01, ***P < 0.001 and ****P < 0.0001. gi, Expression of NE progenitor marker genes ASCL1, PHOX2A and PHOX2B under the treatment of ACTIVIN A with or without DMH1/cyclopamine. Data are shown as mean ± s.d. n = 3 biologically independent samples for each condition. The significance (versus the first condition) was assessed by one-way ANOVA (Dunnett’s multiple comparisons test). *P < 0.05 and **P < 0.01. jl, Immunostaining of NE progenitor markers ASCL1 and PHOX2B at day 9 (j) and day 11 (k) during differentiation under the opimized condition and their quantification. Scale bar in j,k, 50 µm. l, HO, Hoechst. Data are shown as mean ± s.d. n = 3 biologically independent samples for each condition. Source data
Fig. 4
Fig. 4. Maturation of NE neurons.
a, qPCR of NE neuronal marker genes TH and DBH during differenitation. Data are shown as mean ± s.d. n = 3 biologically independent samples for each condition. The significance (versus day 0) was assessed by one-way ANOVA (Dunnett’s multiple comparisons test) for each gene. *P < 0.05, **P < 0.01, ***P < 0.001 and ****P < 0.0001. NS, not significant. b,c, Immunostaining of NE neuronal markers PHOX2B, TH and DBH at day 18 (b) and day 30 (c). HO, Hoechst. Scale bar, 20 µm. d, Quantification of PHOX2B and PHOX2B/TH+ cells in culture. Data are shown as mean ± s.d. n = 5 biologically independent samples for each condition. e, qPCR analysis of gene expression after neuronal differentiation at days 11, 19, 30 and 40. Data are shown as mean ± s.d. n = 3 biologically independent samples for each condition. fi, Immunostaining of NE markers NET, MAO, COMT and ADRA2 in H9-dervied NE neurons at day 30. Scale bar, 20 µm. j, Supernatant NE content at week 4 under the treatment of NRIs or KCl. Data are shown as mean ± s.d. n = 4 biologically independent samples for each condition. Significance (versus control group) was assessed by one-way ANOVA (Dunnett’s multiple comparisons test). *P < 0.05, **P < 0.01, ***P < 0.001 and ****P < 0.0001. k, Immunostaining of neurofilament in NE neuron cell body, dendrites and axons. The white arrow points to the NE cell body, which is not stained by neurofilament (SM312). Scale bar, 50 µm. l, Representative trace of spontaneous firing before, at and after clonidine (1 mM) treatment. m, Quantification of the firing rate change in l. Data are shown as symbols and lines in the ‘before–after’ pattern. n = 6 neurons. n, Representative trace of spontaneous firing before, at and after perfusion with 5% CO2. o, Quantification of the firing rate change in n. Data are shown as symbols and lines in the ‘before–after’ pattern. n = 16 neurons. Significance was assessed by paired t-test (two-tailed) in m,o. Source data
Fig. 5
Fig. 5. snRNA-seq analysis of the differentiating cells.
a, Schematic overview of the experimental design. Differentiating cells were collected at day 6, day 11 and day 14 for snRNA-seq. b, UMAP embeddings showing clustering of 7,260 cells at day 14 of NE differentiation. Cell clusters were labeled with the cell type annotations. Dorsal hindbrain progenitors, NE precursor and NE neuron clusters are highlighted in the UMAP. c, Violin plots of indicated gene expression in all the clusters in b. The selected genes were used to annotate the clusters. d, Schematic representation of LC location in the mouse neural tube at E10.5 stage of development and the mapping of snRNA-seq cluster (NE Neuron1 in b) to the E10.5 Allen Developing Mouse Brain Atlas. e, The Monocle trajectory analysis of snRNA-seq data in b. The line indicates the differentiation trajectory for the clusters. Three major branches were identified. For NE neurons, the trajectory starts from the dorsal hindbrain progenitors and goes through NE precursors expressing ASCL1. f, Psedoutime analysis of the snRNA-seq data in b. g, Dynamic gene expression of neural progenitor and NE markers along the psedoutime.
Fig. 6
Fig. 6. Generation and testing of the NE sensor cells.
a, Schematic diagram of experimental design for generating the cell line expressing NE sensor GRABNE1m. b, GRABNE1m expression in ESCs and ESC-derived NE neurons. HO, Hoechst. Scale bar, 50 µm. c, Time-lapse of GRABNE1m fluorescence under the treatment of NE. Scale bar, 50 µm. d, GRABNE1m fluorescence intensity along NE (10 µM), DA (10 µM) and serotonin (10 µM) treatment. ΔF/F0 refers to the peak change in fluorescence intensity. The control group overlaps with the serotonin group in the panel. e, GRABNE1m fluorescence intensity along KCl (40 mM) admininstration with or without extracellular calcium. n = 16 biologically independent fields for each condition. Significance (versus KCl condition) was assessed by one-way ANOVA (Dunnett’s multiple comparisons test). ****P < 0.0001. f, Comparison of fluorescence intensity before and after drug administration. Data are shown as mean ± s.d. n = 5 biologically independent samples for both pre-treatment and post-treatment in each condition. Significance was assessed by two-way ANOVA (Sidak’s multiple comparisons test). The comparison is between pre-treatment and post-treatment in each condtion. *P < 0.05, **P < 0.01,***P < 0.001 and ****P < 0.0001. NS, not significant. Source data
Extended Data Fig. 1
Extended Data Fig. 1. Hindbrain r1 patterning.
a, qPCR of norepinephrine neural progenitor markers ASCL1, PHOX2A and PHOX2B under the treatment of a series of CHIR concentrations. Data are shown as mean ± SEM. n = 3 biologically independent samples for each condition. b, Flow cytometry quantification of OTX2 positive cell population in differentiating cells under a series of CHIR99021 (CHIR) concentrations. Source data
Extended Data Fig. 2
Extended Data Fig. 2. Regional dependent effect of ACTIVIN A.
a, b, qPCR of ASCL1 and PHOX2A expression under ACTIVIN A treatment (2nd week) following a series of CHIR99021(CHIR) concentrations at the first week. Data are shown as mean ± s.e.m. n = 3 biologically independent samples for each condition. c, Flow cytometry quantification of PHOX2B positive cell population from cells treated with ACTIVIN A after being pre-treated with a series of CHIR concentrations. Source data
Extended Data Fig. 3
Extended Data Fig. 3. Generation of NE neurons from hiPSCs.
a–l, Replication of the NE differentiation in W24B (a-f) and W24M (g-l) hiPSCs. a,b,g,h, Immunostaining for NE progenitor markers ASCL1, PHOX2B and PHOX2A at day 11. c,d,i,j, Immunostaining for NE markers PHOX2B, TH and DBH at day 18 (c, i) and day 30 (d,j). e,k, Immunostaining for PNMT in culture. HO, Hoechst. scale bars (a, b, g, h), 50 μm; scale bars (c-e,i-k): 20 μm. f,l, Quantification of PHOX2B and PHOX2B/TH positive cells in culture. Data are shown as mean ± s.d. n = 5 biologically independent samples for each condition. Source data
Extended Data Fig. 4
Extended Data Fig. 4. Characterization of hPSC derived NE neuron.
a, qPCR of gene expression following NE neuronal differentiation at day 11, 19, 30 and 40. Data are shown as mean ± s.d. n = 3 biologically independent samples for each condition. b, c, Immunostaining for HCRT1 and OPRM1 in H9 derived NE neurons at day 30. Scale bars, 20 μm. d, The expression of CRHR1 by western blot at Day 0 (ES), Day 18 (D18) and Day 30 (D30) along NE differentiation. e, f, Immunostaining for NPY and GAL in H9 derived NE neurons at day 30. scale bars, 50 μm. g, Immunostaining for GAL and NET in mouse LC to demonstrate the specificity of the GAL antibody. Scale bar, 50 μm. h,Immunostaining for PRPH (Peripherin) in hPSC derived LC-NE neurons at day 30. A positive control to demonstrate the specificity of the peripherin antibody is provided using hPSC derived neurons. Scale bars, 20 μm. Source data
Extended Data Fig. 5
Extended Data Fig. 5. NE neuron maturation in vitro and vivo.
a, b, Phase contrast image showing neurite (axon) branching in NE neuron cultures at 2 months. Scale bars, 0.1 mm. c, The 3D reconstruction view showing the dendrites and axon branches from TH+ NE neurons in the transplanted mouse cortex. The arrows point to an axon. Each arrowhead indicates an axonal branch site. Scale bars, 20 μm.
Extended Data Fig. 6
Extended Data Fig. 6. Neurotransmitter release in NE neuron culture.
a–d, Norepinephrine concentration in the supernate at different time of culture (a), from different density of neuronal cultures (b) and in iPSCs derived NE cells (c,d). Data are shown as mean ± s.d. n = 3 biologically independent samples for each condition. Significance was assessed by one way ANOVA (Sidak’s multiple comparisons test).* p<0.05, ** p <0.01. ns, not significant. e, Dopamine. concentration in the supernate collected in different conditions. Data are shown as mean ± s.d. n = 4 biologically independent samples. Significance versus control group was assessed by one way ANOVA (Dunnett’s multiple comparisons test). **** p <0.0001. ns, not significant. N.D., not detected. Source data
Extended Data Fig. 7
Extended Data Fig. 7. snRNA-Seq analysis of cells under NE differentiation at day 6.
a, Uniform manifold approximation and projection (UMAP) embeddings showing clustering of differentiating cells at day 6 of NE differentiation. Cell clusters were labeled with cell type annotations. dHB, dorsal hindbrain. b, Representative feature plots of genes involved in neural crest stem cell differentiation in the differentiating cells. c, Representative feature plots of genes related to brain regions and NE differentiation in the clusters.
Extended Data Fig. 8
Extended Data Fig. 8. snRNA-Seq analysis of cells under NE differentiation at day 11.
a, Uniform manifold approximation and projection (UMAP) embeddings showing clustering of differentiating cells at day 11 of NE differentiation. Cell clusters were labeled with cell type annotations. dHB, dorsal hindbrain. NE, Norepinephrine. b, Violin plots of gene expression of clusters in a. c, Representative feature plots of gene expression in the differentiating cells at day11.
Extended Data Fig. 9
Extended Data Fig. 9. snRNA-Seq analysis of cells under NE differentiation at day 14.
a, Spatial mapping of NE neural subtypes to the E10.5 Allen Mouse Developing Brain ISH Atlas. b–g, Feature plots of selected maker genes in the key trajectory branches towards NE, GABA and peripheral neurons.
Extended Data Fig. 10
Extended Data Fig. 10. Functional properties of NE neurons.
a, Schematic diagram of experimental design for generating the TH reporter cell line. b, mCherry signal and TH immunostaining in differentiated NE neurons that are differentiated for 7 days. HO, Hoechst. Scale bars, 20 μm. c, The bright field and red channel of mCherry fluorescence when performing the cell patch for electrophysiology. Scale bars, 20 μm. d, The Na+ and K+ current recorded in NE neurons. e, Representative trace of spontaneous firing from recorded NE neurons. f, Representative trace of spontaneous firing before, at, and after cocktail blockers. g, Quantification of the firing rate change in panel f. Data are shown as symbols and lines in the ‘before-after’ pattern. n = 7 neurons. h, Representative image and calcium signals in the TH-labeled neurons before, at, and after cocktail blockers. i, Quantification of the firing rate change in panel h. Data are shown as symbols and lines in the ‘before-after’ pattern. n = 26 neurons. Significance was assessed by paired t-test (two tailed) in g, i. Source data

References

    1. Sharma, Y. et al. Comparative anatomy of the locus coeruleus in humans and nonhuman primates. J. Comp. Neurol.518, 963–971 (2010). 10.1002/cne.22249 - DOI - PMC - PubMed
    1. Mouton, P. R., Pakkenberg, B., Gundersen, H. J. & Price, D. L. Absolute number and size of pigmented locus coeruleus neurons in young and aged individuals. J. Chem. Neuroanat.7, 185–190 (1994). 10.1016/0891-0618(94)90028-0 - DOI - PubMed
    1. Sara, S. J. & Bouret, S. Orienting and reorienting: the locus coeruleus mediates cognition through arousal. Neuron76, 130–141 (2012). 10.1016/j.neuron.2012.09.011 - DOI - PubMed
    1. Benarroch, E. E. Locus coeruleus. Cell Tissue Res.373, 221–232 (2018). 10.1007/s00441-017-2649-1 - DOI - PubMed
    1. Zoghbi, H. Y., Percy, A. K., Glaze, D. G., Butler, I. J. & Riccardi, V. M. Reduction of biogenic amine levels in the Rett syndrome. N. Engl. J. Med.313, 921–924 (1985). 10.1056/NEJM198510103131504 - DOI - PubMed