. 2023 Nov 16;13(1):20015.
doi: 10.1038/s41598-023-46585-z.

Experimental and computational methods to highlight behavioural variations in TonB-dependent transporter expression in Pseudomonas aeruginosa versus siderophore concentration

Affiliations

Experimental and computational methods to highlight behavioural variations in TonB-dependent transporter expression in Pseudomonas aeruginosa versus siderophore concentration

Thibaut Hubert et al. Sci Rep. .

Abstract

Iron is a key nutrient for bacterial growth. The source can be either heme or siderophore-Fe complexes. Siderophores are small molecules synthesized by bacteria to scavenge iron from the bacterial environment. The pathogen Pseudomonas aeruginosa can express at least 15 different iron uptake pathways and all but one involve a TonB-dependent transporter (TBDT) for the uptake of iron across the outer membrane. Little is known about how bacteria modulate and adapt the expression of their different iron import pathways according to their environment. Here, we have developed fluorescent reporters between the promoter region of genes encoding a TBDT and the fluorescent reporter mCherry. With these constructs, we can follow the expression of TBDTs under different growth conditions. Mathematical modelling of the data obtained showed the transcription and expression of the gene encoding the TBDT PfeA to have a sigmoidal shape, whereas it was logarithmic for the TBDT gene foxA. Maximum transcription for pfeA was reached in the presence of 3 µM enterobactin, the siderophore recognized by PfeA, whereas the maximum was not reached for foxA with 100 µM nocardamine, the siderophore of FoxA.


Conflict of interest statement

The authors declare no competing interests.

Figures

Figure 1
Figure 1
Promoter sequences selected for transcriptional fusion. DNA sequences upstream of the ATG codon of pfeA (A) and foxA (B). The Fur box for both genes is highlighted, as are the binding sites of PfeR (A1, A2; B1, B2) for pfeA and the predicted binding sites of FoxI (I1, I2) for foxA. For pfeA, A1: [86–93]; B1: [115–121]; A2: [145–152]; Fur box: [195–211]; B2: [241–247]. For foxA, B1: [47–53]; A1: [121–128]; I1: [165–170]; Fur box: [165–182]; I2: [186–191]. The two 255-bp sequences presented here were used as promoter regions to construct the fluorescent reporter strains prompfeA-mCherry and promfoxA-mCherry.
Figure 2
Figure 2
Correlation between mCherry and pfeA or foxA transcription in prompfeA-mCherry and promfoxA-mCherry cells in the presence of increasing concentrations of ENT and NOCA, respectively. The P. aeruginosa prompfeA-mCherry and promfoxA-mCherry strains were grown for 8 h in CAA medium in the absence or presence of increasing concentrations of ENT (0.001 to 10 µM) or NOCA (1 to 100 µM). The transcription of pfeA (light blue points) and mCherry (dark blue triangles) was followed by RT-qPCR in prompfeA-mCherry and foxA (red squares) and mCherry (dark red diamonds) in promfoxA-mCherry. The results are expressed as the ratio of the values obtained for the growth in the presence of the siderophores to those obtained in their absence. Each concentration of ENT or NOCA was tested using biological triplicates. The error bars represent the standard errors calculated by CFX Maestro™ Software (Bio-Rad). The reference genes used were clpX and rpoD. The data for prompfeA-mCherry were fitted using the Hill Eq. (1), as the two data sets showed a sigmoid shape. The two data sets for promfoxA-mCherry showed a linear shape in the logarithmic domain and, thus, a logarithmic Eq. (2) was used for each fit.
Figure 3
Figure 3
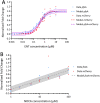
Normalization of pfeA, foxA and mCherry transcription. (A) The normalized data sets of RT-qPCR fold changes from the prompfeA-mCherry strain are represented in blue for pfeA and in red for mCherry (data as dots and the Hill curve as the dashed line). The Hill curve of the pfeA + mCherry data set, with an error of ± 7%, is represented by the purple dashed line and the transparent purple area. (B) The normalized data sets of RT-qPCR fold changes from the promfoxA-mCherry strain are represented in blue for foxA and in red for mCherry. The logarithmic normalized data sets of foxA, mCherry, and foxA + mCherry are modeled using the same logarithmic equation, with an error of ± 15% represented as a grey dashed line with a transparent grey area.
Figure 4
Figure 4
mCherry fluorescence monitored in both prompfeA-mCherry (A) and promfoxA-mCherry (B) strains. prompfeA–mCherry and promfoxA–mCherry strains were grown in CAA medium in the absence or presence of increasing concentrations of ENT and NOCA (0.01µM to 100 µM), respectively, and the OD600 nm and fluorescence of mCherry (excitation at 570 nm and emission at 610 nm) monitored. The bacterial fluorescence rate calculated using Eq. (6) is represented for each concentration. Three independent experiments with three technical replicates were performed for each concentration of ENT and NOCA tested (n = 3). Only the means of the three data points are shown and no error bars are shown for convenience.
Figure 5
Figure 5
Fold change in mCherry synthesis in prompfeA-mCherry and promfoxA-mCherry cells grown in iron-restricted conditions and in the presence of increasing concentrations of ENT and NOCA, respectively. The β values of strain prompfeA-mCherry (filled blue circles, empty blue circles are outliers) are plotted according to the ENT concentration and those of strain promfoxA-mCherry (filled red circles, the empty red circles are outliers) according to the NOCA concentration. The sigmoid curve fitted with the Hill Eq. (1) on the prompfeA-mCherry data is represented by the blue dashed line and the parameters obtained were: y0 = 73.08, ymax = 874.07, n = 2.10, K = 0.61 µM. The logarithmic model (2) based on promfoxA-mCherry data is represented by the red dashed line and the parameters obtained were: a = 192.93 and xE = 0.45 µM. Outliers were not considered for either curve fitting.
Figure 6
Figure 6
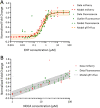
Normalization of the models from RT-qPCR data and fluorescence analysis. (A) The normalized set of RT-qPCR fold changes from prompfeA-mCherry for mCherry are represented in red and the normalized set of beta values from the fluorescence data in green (data as filled circles, outliers as empty circles, and the Hill curve as a dashed line). The Hill curve of RT-qPCR + Fluo, with an error of ± 10%, is represented as an orange dashed line with a transparent orange area. The table shows the Hill parameters of the different normalized data sets. (B) The normalized set of RT-qPCR fold changes from promfoxA-mCherry for mCherry is represented in red and the normalized set of beta values from the fluorescence data in green. The normalized logarithmic model fitted for the three data sets is represented as a grey dashed line, with an error of ± 15% indicated by the transparent grey area.

Similar articles

References

    1. Ratledge C, Dover LG. Iron metabolism in pathogenic bacteria. Annu. Rev. Microbiol. 2000;54:881–941. doi: 10.1146/annurev.micro.54.1.881. - DOI - PubMed
    1. Andrews SC, Robinson AK, Rodriguez-Quinones F. Bacterial iron homeostasis. FEMS Microbiol. Rev. 2003;27:215–237. doi: 10.1016/S0168-6445(03)00055-X. - DOI - PubMed
    1. Ratledge C. Iron metabolism and infection. Food Nutr. Bull. 2007;28:S515–S523. doi: 10.1177/15648265070284S405. - DOI - PubMed
    1. Andrews S, et al. Control of iron metabolism in bacteria. Met. Ions Life Sci. 2013;12:203–239. doi: 10.1007/978-94-007-5561-1_7. - DOI - PubMed
    1. Bullen, J. J., Rogers, H. J. & Griffiths, E. Role of iron in bacterial infection. In Curr. Top. Microbiol. Immunol. Vol. 80 (eds Arber, W. et al.) 1–35 (Springer, 1978). - PubMed

Publication types

MeSH terms