. 2023 Nov 16;24(1):45.
doi: 10.1186/s12865-023-00583-y.

Long-term humoral and cellular immunity after primary SARS-CoV-2 infection: a 20-month longitudinal study

Affiliations

Long-term humoral and cellular immunity after primary SARS-CoV-2 infection: a 20-month longitudinal study

Astrid Korning Hvidt et al. BMC Immunol. .

Abstract

Background: SARS-CoV-2 remains a world-wide health issue. SARS-CoV-2-specific immunity is induced upon both infection and vaccination. However, defining the long-term immune trajectory, especially after infection, is limited. In this study, we aimed to further the understanding of long-term SARS-CoV-2-specific immune response after infection.

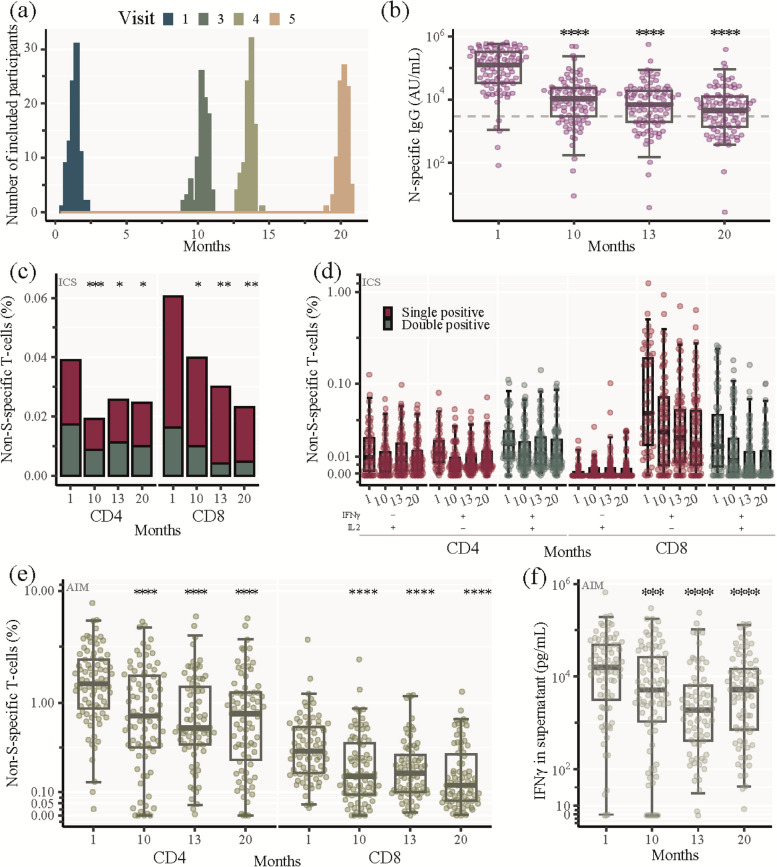
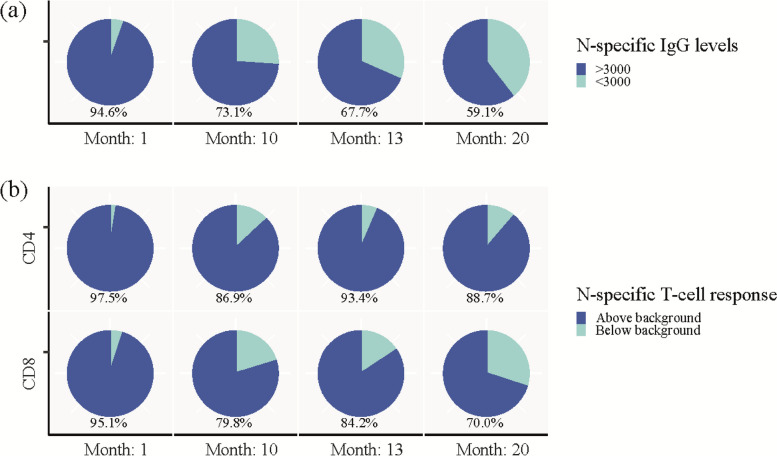
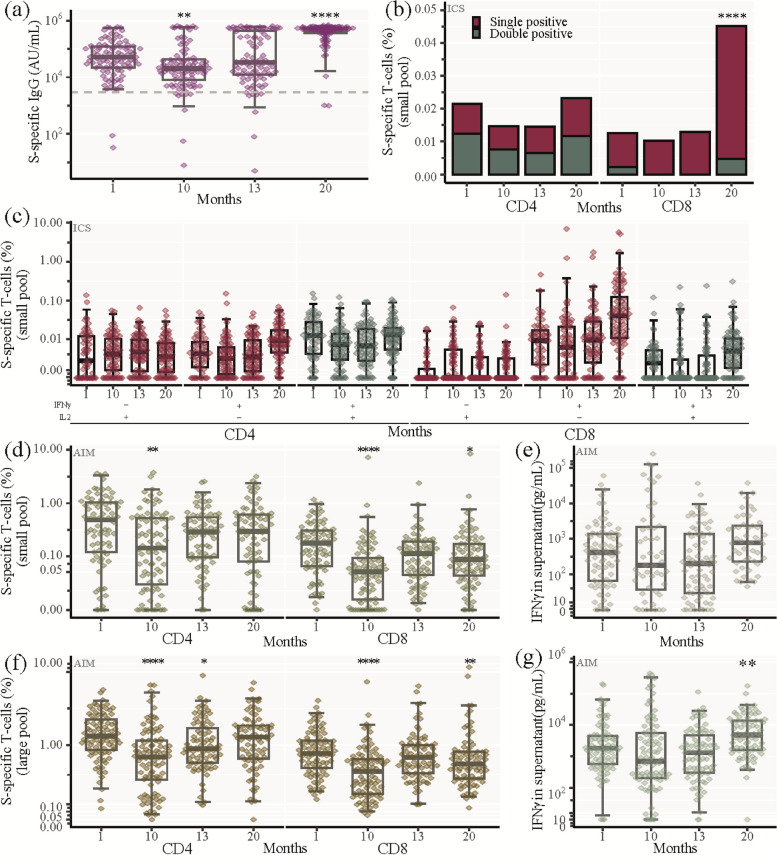
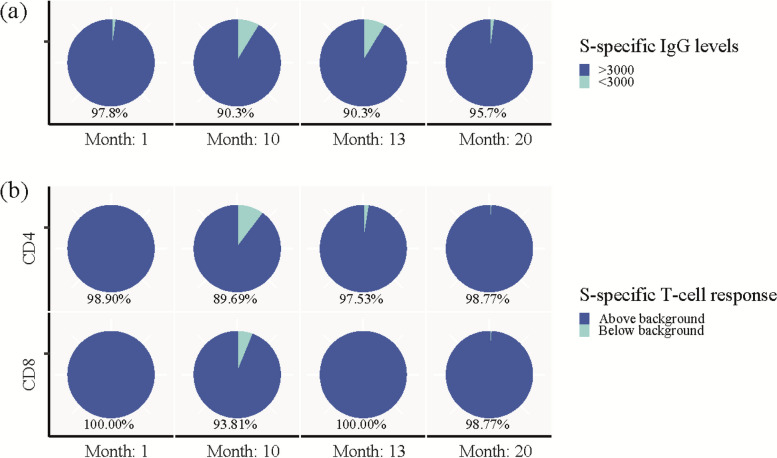
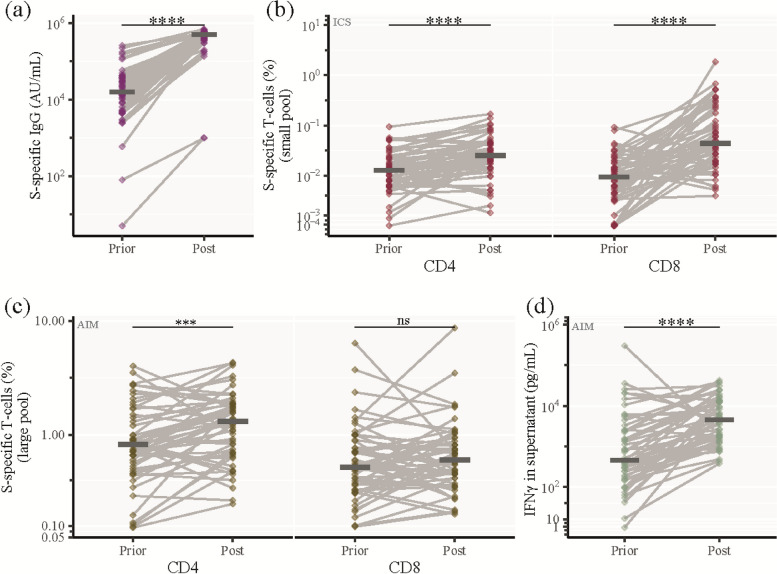
Results: We conducted a longitudinal cohort study among 93 SARS-CoV-2 recovered individuals. Immune responses were continuously monitored for up to 20 months after infection. The humoral responses were quantified by Spike- and Nucleocapsid-specific IgG levels. T cell responses to Spike- and non-Spike epitopes were examined using both intercellular cytokine staining (ICS) assay and Activation-Induced marker (AIM) assay with quantification of antigen-specific IFNγ production. During the 20 months follow-up period, Nucleocapsid-specific antibody levels and non-Spike-specific CD4 + and CD8 + T cell frequencies decreased in the blood. However, a majority of participants maintained a durable immune responses 20 months after infection: 59% of the participants were seropositive for Nucleocapsid-specific IgG, and more than 70% had persisting non-Spike-specific T cells. The Spike-specific response initially decreased but as participants were vaccinated against COVID-19, Spike-specific IgG levels and T cell frequencies were boosted reaching similar or higher levels compared to 1 month post-infection. The trajectory of infection-induced SARS-CoV-2-specific immunity decreases, but for the majority of participants it persists beyond 20 months. The T cell response displays a greater durability. Vaccination boosts Spike-specific immune responses to similar or higher levels as seen after primary infection.

Conclusions: For most participants, the response persists 20 months after infection, and the cellular response appears to be more long-lived compared to the circulating antibody levels. Vaccination boosts the S-specific response but does not affect the non-S-specific response. Together, these findings support the understanding of immune contraction, and with studies showing the immune levels required for protection, adds to the knowledge of durability of protection against future SARS-CoV-2.

Keywords: Antibodies; Antigen-specific T cells; Immune durability; Infection; SARS-CoV-2; Vaccine.


Conflict of interest statement

The authors declare no competing interests.

Figures

Fig. 1
Fig. 1
SARS-CoV-2 non-Spike-specific longitudinal immune response. a Sampling time of the 93 participants for each visit. Zero months represents the time of infection defined as positive PCR test. b SARS-CoV-2 nucleocapsid (N)-specific IgG analysed by Mesoscale. Being seropositive was defined as IgG levels above 3000 AU/mL (dashed line). c, d Percentage of SARS-CoV-2 non-spike (S)-specific CD4 + and CD8 + memory T cells analysed by ICS. c Total SARS-CoV-2 non-S-specific CD4 + and CD8 + memory T cells at indicated time points. IFNγ only and IL2 only producing cells: red bar, IFNγ and IL2 double producing cells: green bar. Stacked bars represent median values. d Percentage of SARS-CoV-2 non-S-specific CD4 + and CD8 + memory T cells producing either IL2 only (red, left panel), IFNγ only (red, middle panel), or co-producing IFNγ and IL2 (green, right panel) at each visit. e, f Percentage of SARS-CoV-2 non-S-specific CD4 + and CD8 + T cells analysed by AIM. e Total SARS-CoV-2 non-S-specific CD4 + and CD8 + T cells at indicated time points, i.e., cells expressing 2 or 3 activation induced markers (CD69, OX40 or 41BB). f IFNγ production by SARS-CoV-2 non-S-specific cells measured in the supernatant harvested from the cell stimulations in the AIM assay (Analysed by mesoscale). b, d, e, f Box and whisker plots show median values ± IQR and error bars indicate 95% CI. Statistical comparisons were performed using Friedman test and Wilcoxon unpaired signed-ranks test adjusted using Bonferroni with visit 1 as a reference. *P ≤ 0.05, **P < 0.01, ***P < 0.001, ****P < 0.0001, no asterisk indicates non-significance
Fig. 2
Fig. 2
Durability of SARS-CoV-2 infection-induced immunity. a Pie charts showing percentage of participants with SARS-CoV-2 nucleocapsid-specific IgG above (dark blue) and below (light blue) 3000 AU/mL at each visit. b Pie charts showing percentage of participants with SARS-CoV-2 non-spike-specific CD4 + (top panel) and CD8 + (lower panel) T cells above (dark blue) or below (light blue) background response analysed by AIM
Fig. 3
Fig. 3
SARS-CoV-2 Spike-specific longitudinal immune response. a SARS-CoV-2 spike (S)-specific IgG analysed by Mesoscale. Being seropositive was defined as IgG above 3000 AU/mL (dashed line). b, c Percentage of SARS-CoV-2 S-specific CD4 + and CD8 + memory T cells analysed by ICS after stimulation with the S-small peptide pool. b Total SARS-CoV-2 S-specific CD4 + and CD8 + T memory cells at indicated time points. IFNγ only and IL2 only producing cells: red bar, IFNγ and IL2 double producing cells: green bar. Stacked bars represent median values. c Percentage of SARS-CoV-2 S-specific CD4 + and CD8 + memory T cells producing either IL2 only (red, left panel), IFNγ only (red, middle panel), or co-producing IFNγ and IL2 (green, right panel) at each visit. d-g Percentage of SARS-CoV-2 S-specific CD4 + and CD8 + T cells analysed by AIM after stimulation with the S-small (d, e) or the large (f, g) peptide pool, i.e., cells expressing 2 or 3 activation induced markers (CD69, OX40 or 41BB). d SARS-CoV-2 S-specific CD4 + and CD8 + T cells at indicated time points (S-small pool). e IFNγ production by SARS-CoV-2 S-specific cells (S-small pool) (Analysed by mesoscale). f SARS-CoV-2 S-specific CD4 + and CD8 + T cells at indicated time points (S-large pool). g IFNγ production by SARS-CoV-2 S-specific cells (S-large pool) (Analysed by mesoscale). a, c, d-g Box and whisker plots show median values ± IQR and error bars indicate 95% CI. Statistical comparisons were performed using Friedman test and Wilcoxon unpaired signed-ranks test adjusted using Bonferroni with visit 1 as a reference. *P ≤ 0.05, **P < 0.01, ***P < 0.001, ****P < 0.0001, no asterisk indicates non-significance
Fig. 4
Fig. 4
Population frequency of Spike-specific immune responses. a Pie charts showing percentage of participants with SARS-CoV-2 spike (S)-specific IgG above (dark blue) and below (light blue) 3000 AU/mL at each visit. b Pie charts showing percentage of participants with SARS-CoV-2 S-specific CD4 + (top panel) and CD8 + (lower panel) T cells above (dark blue) or below (light blue) background response analysed by AIM after stimulation with the S-large pool
Fig. 5
Fig. 5
Evaluation of SARS-CoV-2 vaccination on humoral and cellular immunity. Analysis of a subset of 65 patients who received their first 2 vaccinations between two subsequent visits (Prior: A visit where the participant had not been vaccinated, Post: The subsequent visit, where the participant had received 2 vaccinations). a SARS-CoV-2 S-specific IgG levels (b) Percentage of SARS-CoV-2 S-specific CD4 + and CD8 + memory T cells analysed by ICS after stimulation with the S-small peptide pool. c Percentage of SARS-CoV-2 S-specific CD4 + and CD8 + T cells analysed by AIM after stimulation with the S-large pool. d IFNγ production by SARS-CoV-2 S-specific cells (S-large pool). Horizontal line shows median. Statistical comparisons were performed using Wilcoxon unpaired signed-ranks test adjusted using Bonferroni. *P ≤ 0.05, **P < 0.01, ***P < 0.001, ****P < 0.0001

Similar articles

Cited by

References

    1. Statement on the fifteenth meeting of the IHR. Emergency Committee on the COVID-19 pandemic; 2005. https://www.who.int/news/item/05-05-2023-statement-on-the-fifteenth-meet.... Accessed 15 June 2023.
    1. Karlsson AC, Humbert M, Buggert M. The known unknowns of T cell immunity to COVID-19. Sci Immunol. 2020;5(53):eabe8063. doi: 10.1126/sciimmunol.abe8063. - DOI - PubMed
    1. Moss P. The T cell immune response against SARS-CoV-2. Nat Immunol. 2022;23(2):186–193. doi: 10.1038/s41590-021-01122-w. - DOI - PubMed
    1. Qi H. T follicular helper cells in space-time. Nat Rev Immunol. 2016;16(10):612–625. doi: 10.1038/nri.2016.94. - DOI - PubMed
    1. Staerke NB, Reekie J, Nielsen H, Benfield T, Wiese L, Knudsen LS, Iversen MB, Iversen K, Fogh K, Bodilsen J, et al. Levels of SARS-CoV-2 antibodies among fully vaccinated individuals with Delta or Omicron variant breakthrough infections. Nat Commun. 2022;13(1):4466. doi: 10.1038/s41467-022-32254-8. - DOI - PMC - PubMed

Publication types