

Training in retinoscopy: learning curves using a standardized method
- PMID: 37974128
- PMCID: PMC10655477
- DOI: 10.1186/s12909-023-04750-y
Training in retinoscopy: learning curves using a standardized method
Abstract
Background: Retinoscopy is one of the most effective objective techniques for evaluating refractive status, especially in non-cooperative patients. However, it presents a slow learning curve that often leads to student frustration. With the current Covid-19 pandemic and the need for social isolation, clinical education based on simulation has become more relevant. Therefore, we implemented retinoscopy laboratories and learning protocols to reduce student stress and learning time.
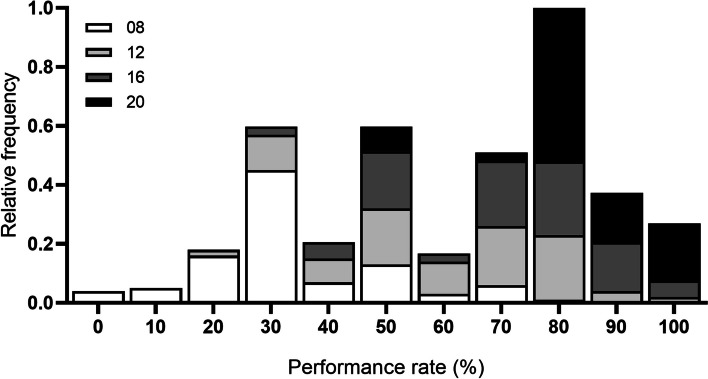
Methods: We conducted a study to evaluate the retinoscopy learning curve using a new training protocol proposal. One hundred trainees were assessed in four stages, corresponding to 08, 12, 16, and 20 hours of training. Six different refractive defects were used trying to reproduce frequent conditions of care. The time spent on the assessment was not considered as additional training time. To analyze the data, we used non-parametric statistics and linear regression to assess the variables associated with training time and performance rate.
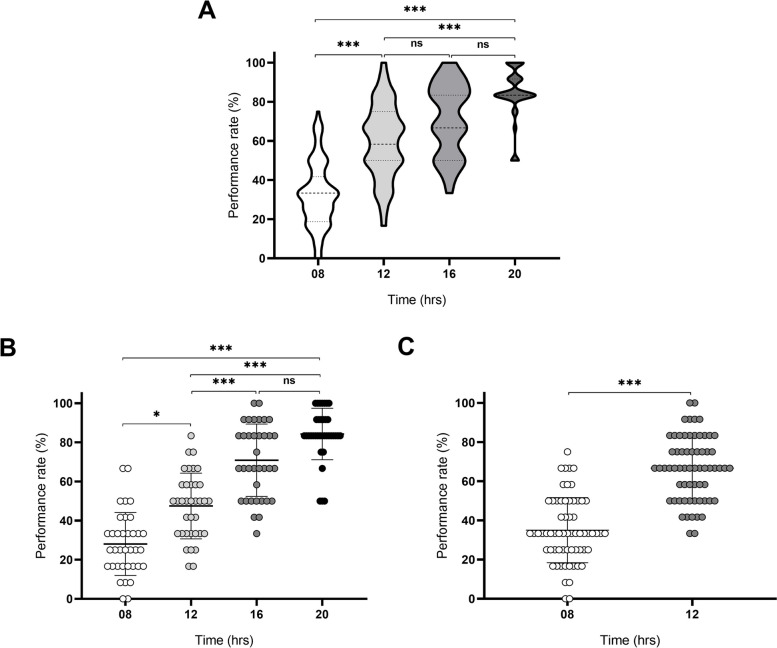
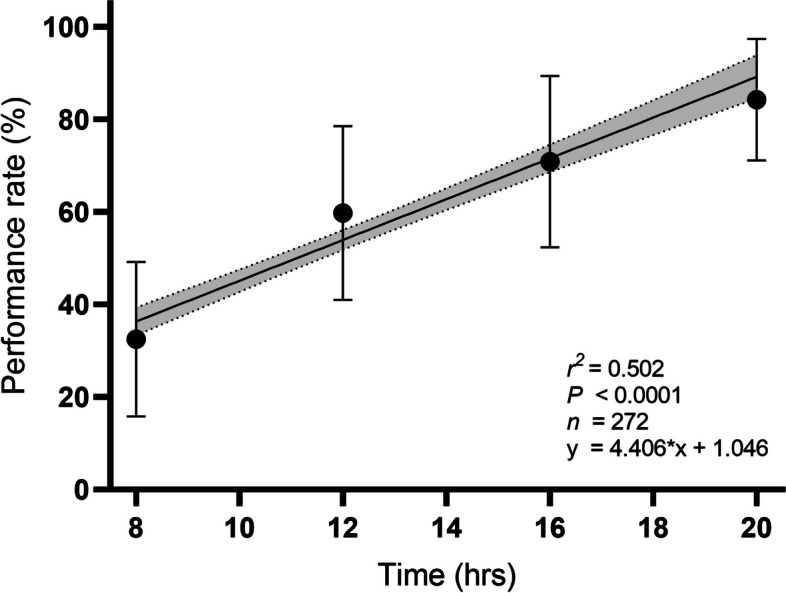
Results: The mean performance score at 08 hrs was 32.49% (±16.69 SD); at 12 hrs was 59.75% (±18.80 SD); at 16 hrs was 70.83% (±18.53 SD) and at 20 hrs was 84.26% (±13.18 SD). Performance at 12 hrs was significative higher than 08 hrs of training, but did not show significant differences with the performance rate at 16 and 20 hrs. We found a strong positive correlation between performance and training time in retinoscopy (R = 0.9773, CI: 0.2678 - 0.9995 p = 0.0227).
Conclusion: This study showed that an increasing number of hours of practice positively correlates with performance in retinoscopy. The elaboration of a protocol and standardization of performance per hour also allowed us to estimate that a minimum of 13.4 hrs of practice is required to achieve 60% performance. Using the resulting formula, it is possible to determine the number of hours of retinoscopy practice are necessary to reach a certain level of performance.
Keywords: Learning curve; Optometry; Refractive errors; Retinoscopy; Simulation training; Standardization; Teaching.
© 2023. The Author(s).
Conflict of interest statement
The authors declare no competing interests.
Figures
References
-
- Kaur K, Gurnani B: Subjective Refraction Techniques. In: StatPearls. edn. Treasure Island (FL): StatPearls Publishing 2022. - PubMed
MeSH terms
LinkOut - more resources
Full Text Sources
Medical
