. 2023 Nov 16;20(1):266.
doi: 10.1186/s12974-023-02955-y.

Contribution of macrophages to neural survival and intracochlear tissue remodeling responses following cochlear implantation

Affiliations

Contribution of macrophages to neural survival and intracochlear tissue remodeling responses following cochlear implantation

Muhammad Taifur Rahman et al. J Neuroinflammation. .

Abstract

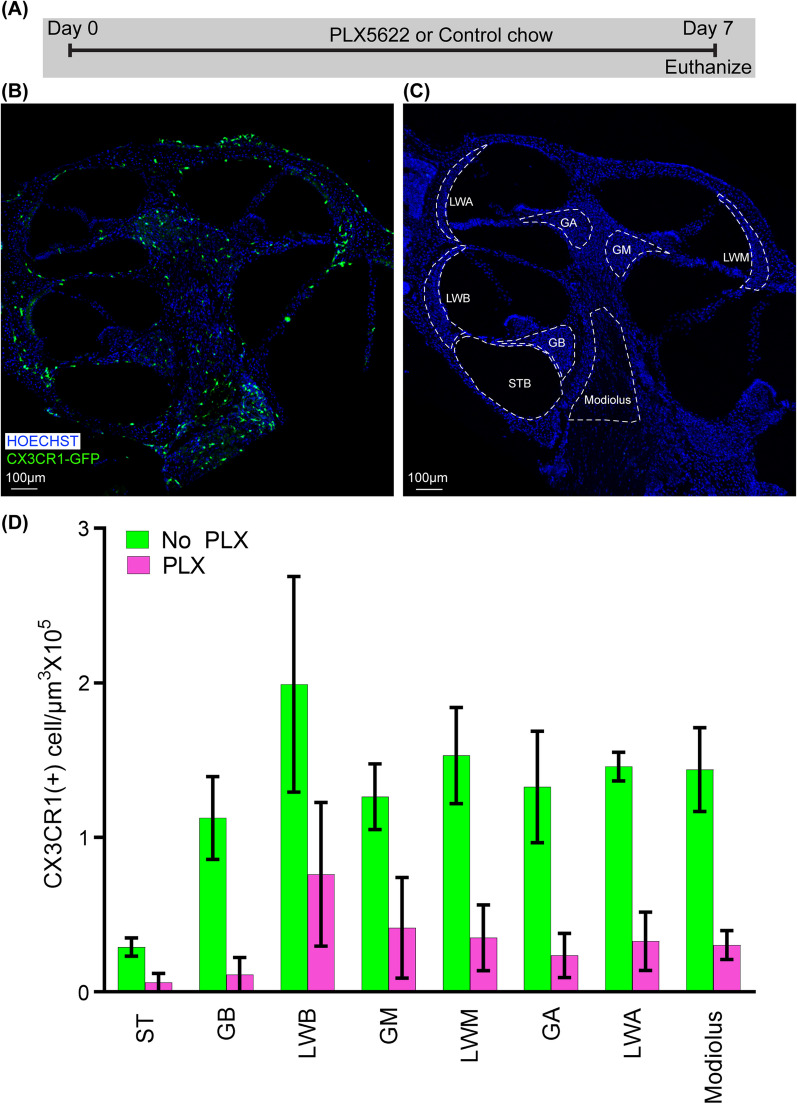
Background: Cochlear implants (CIs) restore hearing to deafened patients. The foreign body response (FBR) following cochlear implantation (post-CI) comprises an infiltration of macrophages, other immune and non-immune cells, and fibrosis into the scala tympani, a space that is normally devoid of cells. This FBR is associated with negative effects on CI outcomes including increased electrode impedances and loss of residual acoustic hearing. This study investigates the extent to which macrophage depletion by an orally administered CSF-1R specific kinase (c-FMS) inhibitor, PLX-5622, modulates the tissue response to CI and neural health.

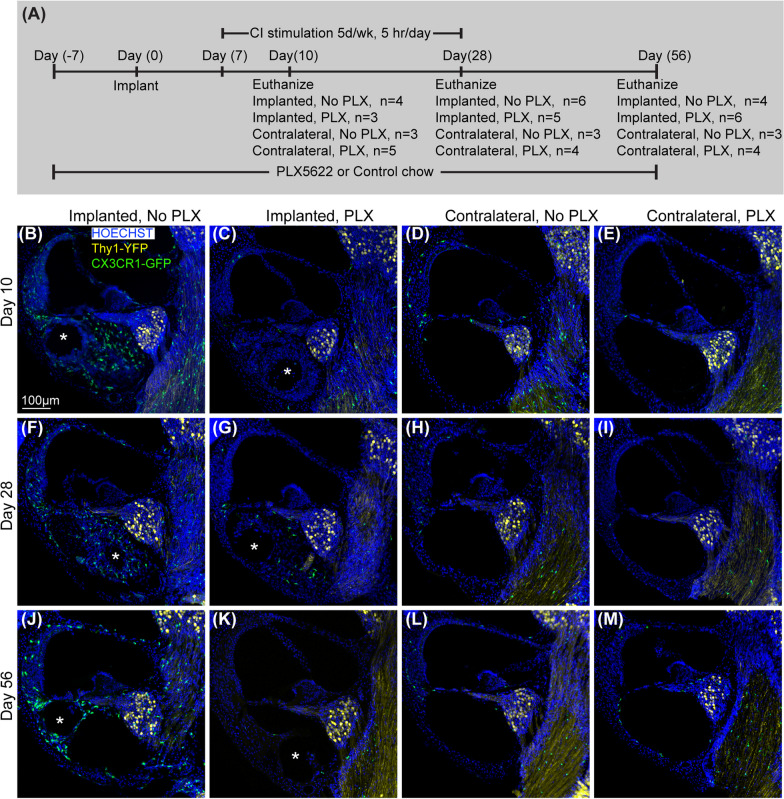
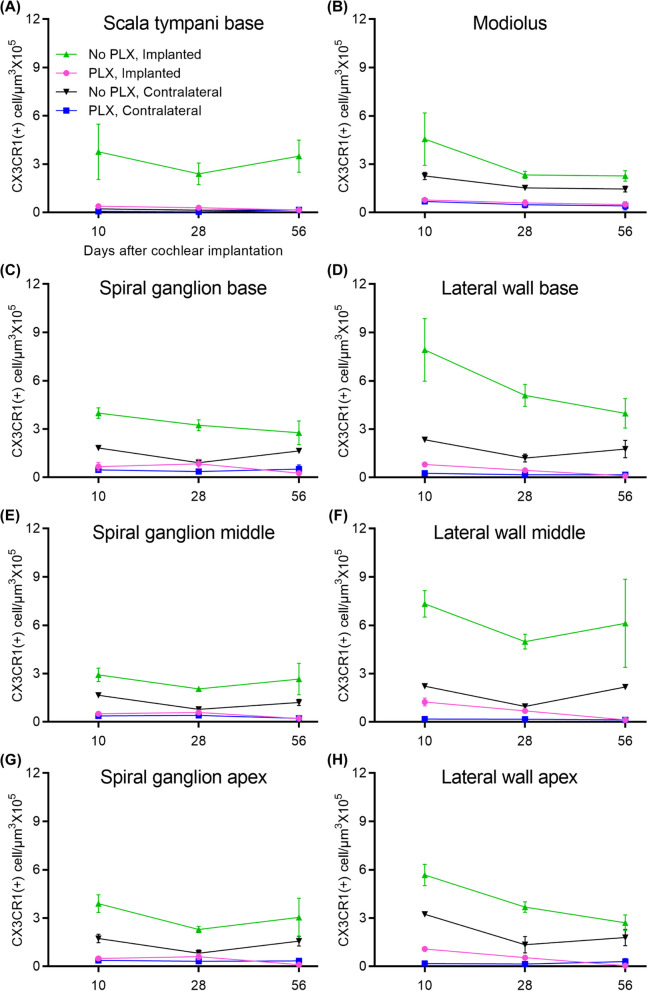
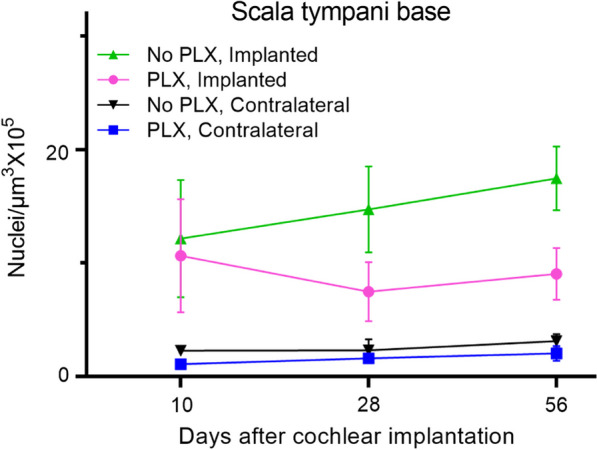
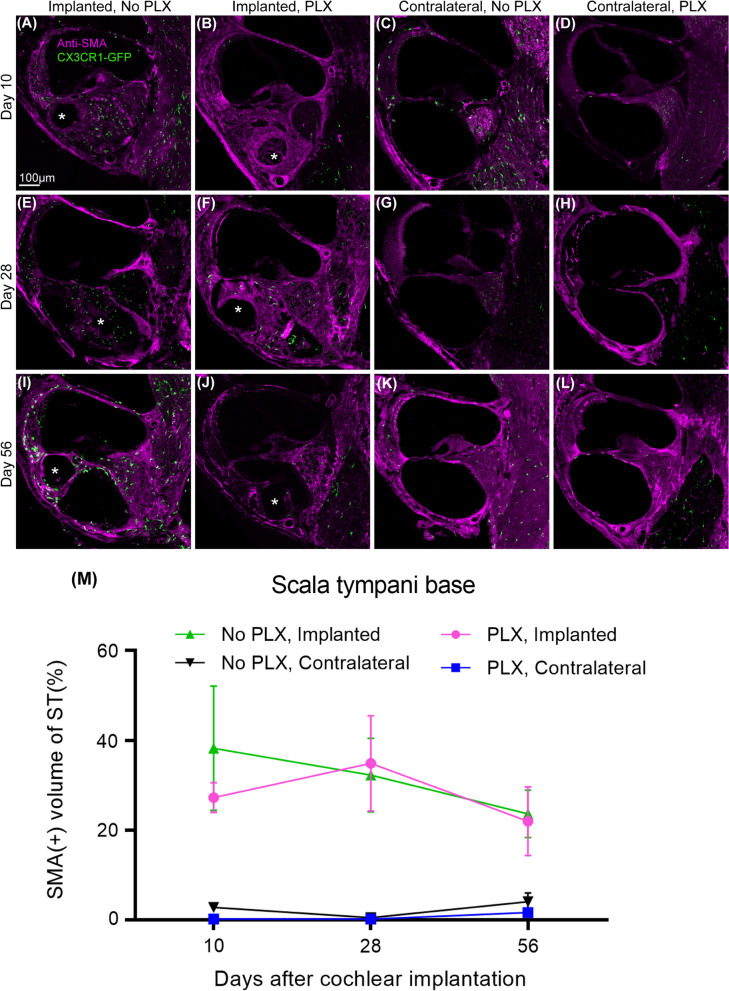
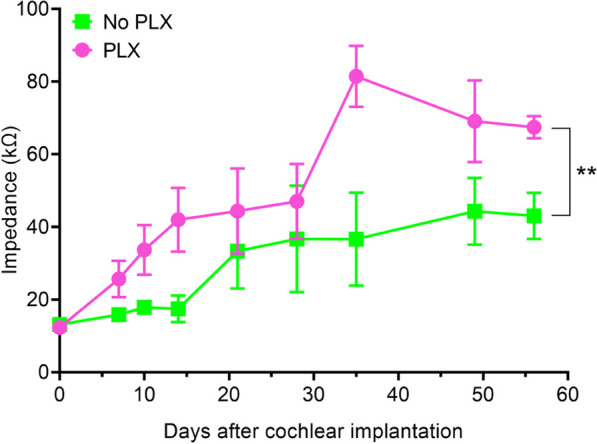
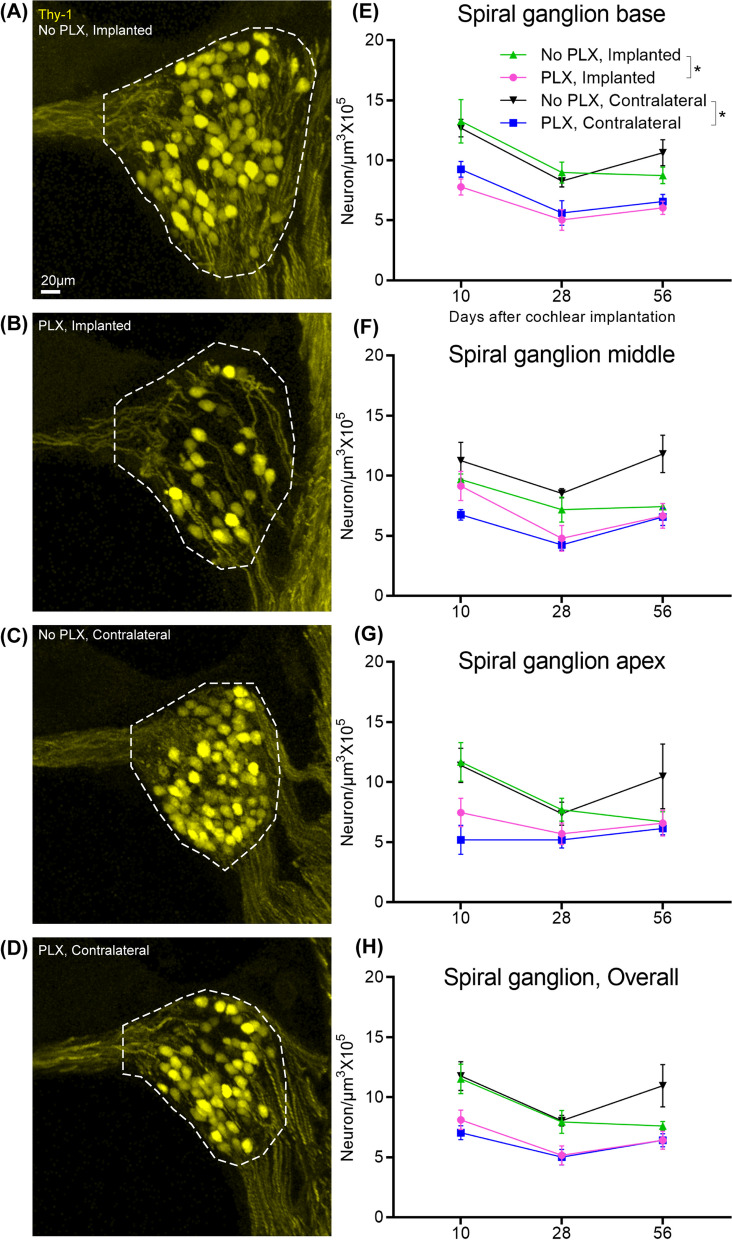
Main text: 10- to 12-week-old CX3CR1 + /GFP Thy1 + /YFP mice on C57BL/6J/B6 background was fed chow containing 1200 mg/kg PLX5622 or control chow for the duration of the study. 7 days after starting the diet, 3-channel cochlear implants were implanted in the ear via the round window. Serial impedance and neural response telemetry (NRT) measurements were acquired throughout the study. Electric stimulation began 7 days post-CI until 28 days post-CI for 5 h/day, 5 days/week, with programming guided by NRT and behavioral responses. Cochleae harvested at 10, 28 or 56 days post-CI were cryosectioned and labeled with an antibody against α-smooth muscle actin (α-SMA) to identify myofibroblasts and quantify the fibrotic response. Using IMARIS image analysis software, the outlines of scala tympani, Rosenthal canal, modiolus, and lateral wall for each turn were traced manually to measure region volume. The density of nuclei, CX3CR1 + macrophages, Thy1 + spiral ganglion neuron (SGN) numbers, and the ratio of the α-SMA + volume/scala tympani volume were calculated. Cochlear implantation in control diet subjects caused infiltration of cells, including macrophages, into the cochlea. Fibrosis was evident in the scala tympani adjacent to the electrode array. Mice fed PLX5622 chow showed reduced macrophage infiltration throughout the implanted cochleae across all time points. However, scala tympani fibrosis was not reduced relative to control diet subjects. Further, mice treated with PLX5622 showed increased electrode impedances compared to controls. Finally, treatment with PLX5622 decreased SGN survival in implanted and contralateral cochleae.

Conclusion: The data suggest that macrophages play an important role in modulating the intracochlear tissue response following CI and neural survival.

Keywords: Biomaterials; Cochlear implant; Fibrosis; Foreign body response; Inflammation.


Conflict of interest statement

Marlan R. Hansen is a co-founder and Chief Medical Officer of iotaMotion Inc. and a co-founder of ZwiCoat Materials Innovations, Inc with equity interest.

Figures

Fig. 1
Fig. 1
Depletion of cochlear CX3CR1 + cells by oral administration of CSFR1 inhibitor, PLX5622. A Study design for oral administration of CSFR1 inhibitor, PLX5622. Two groups of 10- to 12-week-old CX3CR1+/GFP Thy1+/YFP mice with C57BL/6J/B6 background were fed chow mixed with PLX5622 (PLX) or control chow (No PLX). On day 7, all mice were euthanized, and labeled with Hoechst 3342 for histopathologic examination and confocal imaging. Confocal microscopy images showing CX3CR1-positive cells in B No-PLX (n = 3) and C PLX (n = 3) groups. D Graphical representation of the effect of 7 days of PLX-5622 treatment on cochlear resident CX3CR1-positive cells. ST: scala tympani of the base of the cochlea, GB: spiral ganglion of the basal turn of the cochlea, LWB: lateral wall of basal turn of the cochlea, GM: spiral ganglion of middle turn of cochlea, LWM: lateral wall of middle turn of cochlea, GA: spiral ganglion of apical turn of cochlea, LWA: lateral wall of middle turn of cochlea
Fig. 2
Fig. 2
Cochlear implantation following the elimination of cochlear macrophages. A Study design for cochlear implantation in PLX5662 treated mice. Cochlear implantation was performed on 2 groups of CX3CR1+/GFP Thy1+/YFP mice: one group was fed on chow with 1200 ppm of PLX-5622 (PLX) and the other group with control chow (No PLX) for 7 days. CI surgeries were performed on the left ear of both groups of mice after that (day 0). Following recovery from surgery, mice were continued with respective chow (PLX or No PLX) until they were killed at 10, 28, and 56 days post-implantation. Starting on post-operative day 7, mice within stimulation cages, connected to the CI processor were stimulated for 5 h per day, 5 days a week. B–M Fluorescent microscopic images of representative mid-modiolar, 30-µm-thick sections of the basal turn of the cochleae from respective groups. The following labels were used (Hoechst, blue), macrophages (CX3CR1-GFP, green), and neurons, (Thy1-YFP, yellow). Asterisks indicate the tract of the CI. In the presence of a functional cochlear implant, macrophage (CX3CR1 + cells) infiltration into the cochlea appears to be sustained until the end of the study period (56 days post-CI). This was associated with the infiltration of other cells labeled with nuclear labeling Hoechst
Fig. 3
Fig. 3
Quantification of CX3CR1 + macrophage density in the cochlea following cochlear implantation. Cochlear implantation was performed in CX3CR1+/GFP Thy1+/YFP mice, fed on chow with 1200 ppm of PLX-5622 (PLX) or control chow (No PLX) for 7 days. Following surgery, mice were continued with respective chow (PLX or No PLX). Starting on post-operative day 7, mice within stimulation cages, connected to the CI processor were stimulated for 5 h per day, 5 days a week. Mice were euthanized at 10, 28 and 56 days post-CI and imaged. Image analysis was performed in IMARIS image analysis software. In 30-µm-thick mid-modiolar sections, CX3CR1 + macrophage cells were counted on maximum intensity z-projections of 3D confocal image stacks. The outline of Rosenthal’s canal (RC) and lateral wall at the base, middle, and apex of the cochlea, scala tympani of the base of the cochlea, and modiolus was traced and the volume of each area was measured. CX3CR1 + macrophages were counted using an automated counting system in IMARIS image analysis software aided by custom-made macros. The density of macrophages with visible, Hoechst + nuclei was calculated per 105 µm3 in each area mentioned. Values derived from every region of the cochlea for an individual animal were averaged together from 3 sections; “n” is the total number of mice used in the study. A–H Density of macrophage in different locations of cochlea in different treatment groups. Number of cochlea analyzed in this study are as follows: at day 10 post-CI, implanted ‘no PLX’ (n = 4), implanted PLX, (n = 3), contralateral ‘no PLX’ (n = 3), contralateral PLX (n = 5); at day 28 post-CI, implanted ‘no PLX’ (n = 6), implanted PLX, (n = 5), contralateral ‘no PLX’ (n = 3), contralateral PLX (n = 4); at day 56 post-CI, implanted ‘no PLX’ (n = 3), implanted PLX, (n = 6), contralateral ‘no PLX’ (n = 3), contralateral PLX (n = 4). Error bars indicate SEM
Fig. 4
Fig. 4
Quantification of cellular density into scala tympani of the base of cochlea following cochlear implantation. Cochlear implantation was performed in CX3CR1+/GFP Thy1+/YFP mice, fed on chow with 1200 ppm of PLX-5622 (PLX) or control chow (No PLX) for 7 days. Treatment with respective diets and electrical stimulation was continued until the desired endpoints (10, 28, or 56 days). Nuclei were labeled with Hoechst 3342 in 30-µm-thick mid-modiolar sections. Image analysis was performed in IMARIS image analysis software. Hoechst + cells were counted on maximum intensity z-projections of 3D confocal image stacks in scala tympani of the base of the cochlea. The volume of scala tympani and nuclear counts were made using an automated counting system in IMARIS image analysis software aided by custom-made macros. Nuclear density (Hoechst + cells) was calculated per 105 µm3. An average of 3 sections per animal was taken with ‘n’ being the number of animals. Number of cochlea analyzed in this study are as follows: at day 10 post-CI, Implanted ‘no PLX’ (n = 4), implanted PLX, (n = 3), contralateral ‘no PLX’ (n = 3), contralateral PLX (n = 5); at day 28 post-CI, Implanted ‘no PLX’ (n = 6), implanted PLX, (n = 5), contralateral ‘no PLX’ (n = 3), contralateral PLX(n = 4); at day 56 post-CI, Implanted ‘no PLX’ (n = 3), implanted PLX, (n = 6), contralateral ‘no PLX’ (n = 3), contralateral PLX (n = 4). Error bars indicate SEM
Fig. 5
Fig. 5
Quantification of α-SMA + tissue within scala tympani of the base of the cochlea following cochlear implantation. Following 7-day feeding on chow with 1200 ppm of PLX-5622 (PLX) or control chow (No PLX), cochlear implantation was performed in CX3CR1+/GFP Thy1+/YFP mice. Respective diets were resumed following recovery from surgery. Electrical stimulation was continued until 28 days post-CI. Mice were euthanized at the desired endpoints (10, 28, or 56 days). Following euthanasia, 30 µm mid-modiolar sections were labeled with antiα-SMA antibodies. A–L Representative images are shown. Asterisks within the images indicate the tract of the CI, M analyses the data. The volume of the scala tympani and α-SMA + tissue volumes were measured using IMARIS image analysis software. Fibrosis was measured by dividing the volume of α-SMA + tissue by the volume of scala tympani, expressed in % volume. Number of cochlea used in this study are as follows: at day 10 post-CI, implanted ‘no PLX’ (n = 4), implanted PLX, (n = 3), contralateral ‘no PLX’ (n = 3), contralateral PLX(n = 5); at day 28 post-CI, Implanted ‘no PLX’ (n = 6), implanted PLX, (n = 5), contralateral ‘no PLX’ (n = 3), contralateral PLX(n = 4); at day 56 post-CI, implanted ‘no PLX’ (n = 3), implanted PLX, (n = 6), contralateral ‘no PLX’ (n = 3), contralateral PLX (n = 4). Error bars indicate SEM
Fig. 6
Fig. 6
Electrode impedance following cochlear implantation plotted over time. Lines represent mean impedance values across all functional electrodes (without open circuit) at the representative time points for the No PLX (green line) and PLX groups (pink line). Error bars indicate SEM. ** indicates p < 0.001
Fig. 7
Fig. 7
Quantification of spiral ganglion neuron density following cochlear implantation. 7-day feeding on chow with 1200 ppm of PLX-5622 (PLX) or control chow (No PLX) was followed by cochlear implantation in CX3CR1+/GFP Thy1+/YFP mice. After recovery from surgical anesthesia, respective diets were resumed. Electrical stimulation was done as described before. Cochlea harvested at desired endpoints (10, 28, or 56 days) were sectioned at 30 µm thickness. A–D Representative images from the base of the cochlea. Quantification is shown for E base, F middle, G apex, H overall. After measurement of spiral ganglia volume and quantification of spiral ganglion neurons, SGN density was calculated by dividing the SGN count by the volume and expressed as per 105 µm3. Density in 3 sections per animal was averaged. The number of the animals is considered the ‘n’ for this experiment. Number of cochlea used in this study are as follows: at day 10 post-CI, implanted ‘no PLX’ (n = 4), implanted PLX, (n = 3), contralateral ‘no PLX’ (n = 3), contralateral PLX(n = 5); at day 28 post-CI, implanted ‘no PLX’ (n = 6), implanted PLX, (n = 5), contralateral ‘no PLX’ (n = 3), contralateral PLX (n = 4); at day 56 post-CI, implanted ‘no PLX’ (n = 3), implanted PLX, (n = 6), contralateral ‘no PLX’ (n = 3), contralateral PLX(n = 4). Error bars indicate SEM. * indicates p < 0.05

Update of

References

    1. Ahmadi N, Gausterer JC, Honeder C, Motz M, Schopper H, Zhu C, et al. Long-term effects and potential limits of intratympanic dexamethasone-loaded hydrogels combined with dexamethasone-eluting cochlear electrodes in a low-insertion trauma Guinea pig model. Hear Res. 2019;384:107825. doi: 10.1016/j.heares.2019.107825. - DOI - PubMed
    1. Anderson JM, Rodriguez A, Chang DT. Foreign body reaction to biomaterials. Semin Immunol. 2008;20(2):86–100. doi: 10.1016/j.smim.2007.11.004. - DOI - PMC - PubMed
    1. Bas E, Bohorquez J, Goncalves S, Perez E, Dinh CT, Garnham C, Van De Water TR, et al. Electrode array-eluted dexamethasone protects against electrode insertion trauma induced hearing and hair cell losses, damage to neural elements, increases in impedance and fibrosis: a dose response study. Hear Res. 2016;337:12–24. doi: 10.1016/j.heares.2016.02.003. - DOI - PubMed
    1. Bas E, Goncalves S, Adams M, Dinh CT, Bas JM, Van De Water TR, Eshraghi AA. Spiral ganglion cells and macrophages initiate neuro-inflammation and scarring following cochlear implantation. Front Cell Neurosci. 2015;9:303. doi: 10.3389/fncel.2015.00303. - DOI - PMC - PubMed
    1. Brun J, Andreasen CM, Ejersted C, Andersen TL, Caverzasio J, Thouverey C. PDGF receptor signaling in osteoblast lineage cells controls bone resorption through upregulation of Csf1 expression. J Bone Miner Res. 2020;35(12):2458–2469. doi: 10.1002/jbmr.4150. - DOI - PubMed

LinkOut - more resources