

Proton therapy (PT) combined with concurrent chemotherapy for locally advanced non-small cell lung cancer with negative driver genes
- PMID: 37974211
- PMCID: PMC10652584
- DOI: 10.1186/s13014-023-02372-8
Proton therapy (PT) combined with concurrent chemotherapy for locally advanced non-small cell lung cancer with negative driver genes
Abstract
Purpose: To discuss the optimal treatment modality for inoperable locally advanced Non-Small Cell Lung Cancer patients with poor physical status, impaired cardio-pulmonary function, and negative driver genes, and provide clinical evidence.
Materials and methods: Retrospective analysis of 62 cases of locally advanced non-small cell lung cancer patients with negative driver genes treated at Tsukuba University Hospital(Japan) and Qingdao University Affiliated Hospital(China).The former received proton therapy with concurrent chemotherapy, referred to as the proton group, with 25 cases included; while the latter underwent X-ray therapy with concurrent chemoradiotherapy followed by 1 year of sequential immunomodulatory maintenance therapy, referred to as the X-ray group, with 37 cases included.The treatment response and adverse reactions were assessed using RECIST v1.1 criteria and CTCAE v3.0, and radiotherapy planning and evaluation of organs at risk were performed using the CB-CHOP method.All data were subjected to statistical analysis using GraphPad Prism v9.0, with a T-test using P < 0.05 considered statistically significant.
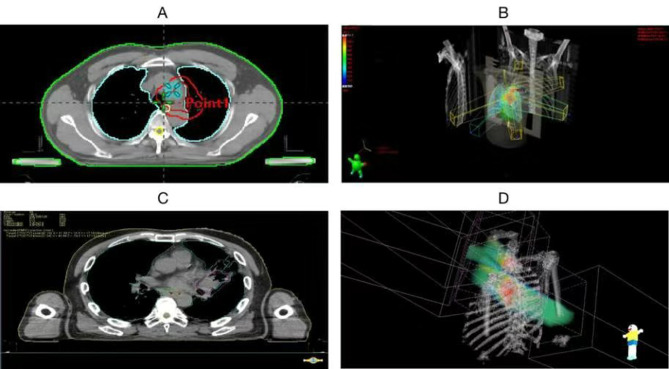
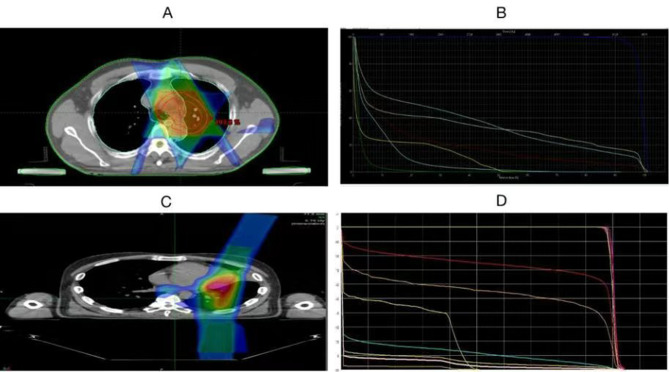
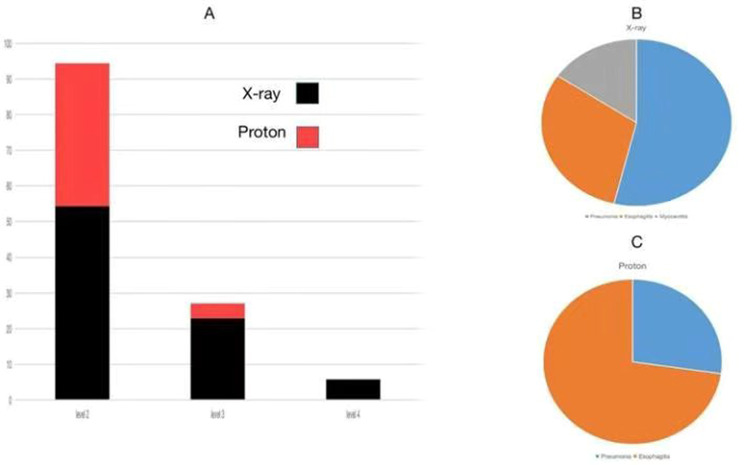
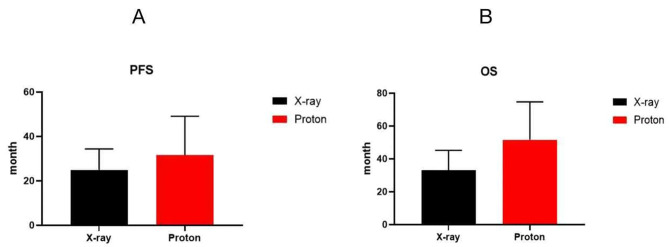
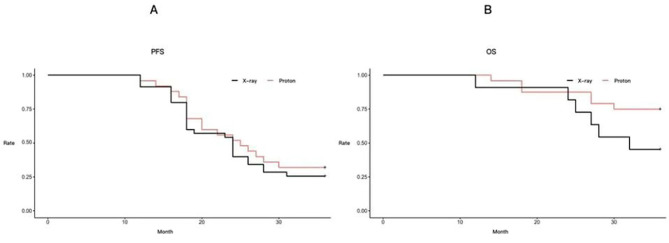
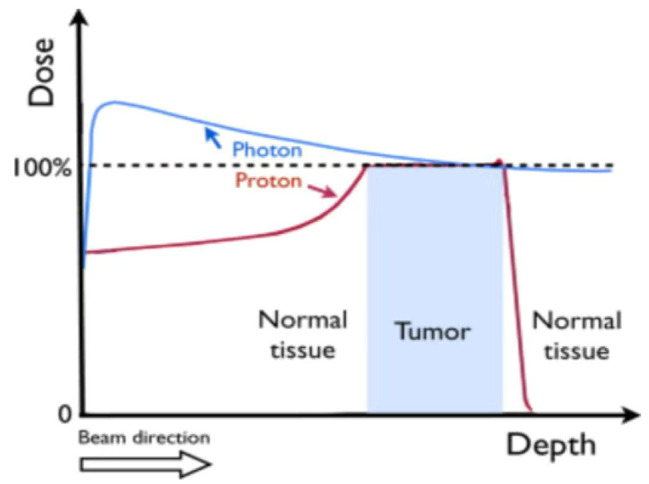
Results: (1)Target dose distribution: compared to the X-ray group, the proton group exhibited smaller CTV and field sizes, with a more pronounced bragg peak.(2)Organs at risk dose: When comparing the proton group to the X-ray group, lung doses (V5, V20, MLD) and heart doses (V40, Dmax) were lower, with statistical significance (P < 0.05), while spinal cord and esophagus doses showed no significant differences between the two groups (P > 0.05).(3)Treatment-related toxicities: The incidence of grade 3 or higher adverse events in the proton group and X-ray group was 28.6% and 4.2%, respectively, with a statistically significant difference (P < 0.05). In terms of the types of adverse events, the proton group primarily experienced esophagitis and pneumonia, while the X-ray group primarily experienced pneumonia, esophagitis, and myocarditis. Both groups did not experience radiation myelitis or esophagotracheal fistula.(4)Efficacy evaluation: The RR in the proton group and X-ray group was 68.1% and 70.2%, respectively (P > 0.05), and the DCR was 92.2% and 86.4%, respectively (P > 0.05), indicating no significant difference in short-term efficacy between the two treatment modalities.(5)Survival status: The PFS in the proton group and X-ray group was 31.6 ± 3.5 months (95% CI: 24.7 ~ 38.5) and 24.9 ± 1.55 months (95% CI: 21.9 ~ 27.9), respectively (P > 0.05), while the OS was 51.6 ± 4.62 months (95% CI: 42.5 ~ 60.7) and 33.1 ± 1.99 months (95% CI: 29.2 ~ 37.1), respectively (P < 0.05).According to the annual-specific analysis, the PFS rates for the first to third years in both groups were as follows: 100%, 56.1% and 32.5% for the proton group vs. 100%, 54.3% and 26.3% for the X-ray group. No statistical differences were observed at each time point (P > 0.05).The OS rates for the first to third years in both groups were as follows: 100%, 88.2%, 76.4% for the proton group vs. 100%, 91.4%, 46.3% for the X-ray group. There was no significant difference in the first to second years (P > 0.05), but the third year showed a significant difference (P < 0.05). Survival curve graphs also depicted a similar trend.
Conclusion: There were no significant statistical differences observed between the two groups in terms of PFS and OS within the first two years. However, the proton group demonstrated a clear advantage over the X-ray group in terms of adverse reactions and OS in the third year. This suggests a more suitable treatment modality and clinical evidence for populations with frail health, compromised cardio-pulmonary function, post-COVID-19 sequelae, and underlying comorbidities.
Keywords: Cardio-pulmonary function; DVH; Negative driver genes; Non-small cell Lung cancer(NSCLC); Proton therapy.
© 2023. The Author(s).
Conflict of interest statement
The authors declare that they have no competing interests.
Figures
Similar articles
-
[Therapeutic effects and prognostic factors for the limited-stage small cell lung cancer treated with multidisciplinary therapy].Zhonghua Zhong Liu Za Zhi. 2012 Mar;34(3):216-21. doi: 10.3760/cma.j.issn.0253-3766.2012.03.013. Zhonghua Zhong Liu Za Zhi. 2012. PMID: 22780978 Chinese.
-
Response, toxicity, failure patterns, and survival in five Radiation Therapy Oncology Group (RTOG) trials of sequential and/or concurrent chemotherapy and radiotherapy for locally advanced non-small-cell carcinoma of the lung.Int J Radiat Oncol Biol Phys. 1998 Oct 1;42(3):469-78. doi: 10.1016/s0360-3016(98)00251-x. Int J Radiat Oncol Biol Phys. 1998. PMID: 9806503 Clinical Trial.
-
[Proton beam therapy with concurrent chemotherapy for non-small cell lung cancer -- our experiences and future direction].Gan To Kagaku Ryoho. 2015 Feb;42(2):144-7. Gan To Kagaku Ryoho. 2015. PMID: 25743132 Japanese.
-
Radiotherapy and chemotherapy in locally advanced non-small cell lung cancer: preclinical and early clinical data.Hematol Oncol Clin North Am. 2004 Feb;18(1):41-53. doi: 10.1016/s0889-8588(03)00138-2. Hematol Oncol Clin North Am. 2004. PMID: 15005280 Review.
-
Single or combined immune checkpoint inhibitors compared to first-line platinum-based chemotherapy with or without bevacizumab for people with advanced non-small cell lung cancer.Cochrane Database Syst Rev. 2020 Dec 14;12(12):CD013257. doi: 10.1002/14651858.CD013257.pub2. Cochrane Database Syst Rev. 2020. Update in: Cochrane Database Syst Rev. 2021 Apr 30;4:CD013257. doi: 10.1002/14651858.CD013257.pub3. PMID: 33316104 Free PMC article. Updated.
Cited by
-
Gamma knife radiosurgery for a rare Rosette-forming glioneuronal tumor in the brainstem region: A case report and literature review.Medicine (Baltimore). 2025 Mar 14;104(11):e41869. doi: 10.1097/MD.0000000000041869. Medicine (Baltimore). 2025. PMID: 40101077 Free PMC article. Review.
-
Single-cell analysis unveils cell subtypes of acral melanoma cells at the early and late differentiation stages.J Cancer. 2025 Jan 1;16(3):898-916. doi: 10.7150/jca.102045. eCollection 2025. J Cancer. 2025. PMID: 39781353 Free PMC article.
-
Enhancing Precision in Radiation Therapy for Locally Advanced Lung Cancer: A Case Study of Cone-Beam Computed Tomography (CBCT)-Based Online Adaptive Techniques and the Promise of HyperSight™ Iterative CBCT.Cureus. 2024 Aug 15;16(8):e66943. doi: 10.7759/cureus.66943. eCollection 2024 Aug. Cureus. 2024. PMID: 39280544 Free PMC article.
-
A review on functional lung avoidance radiotherapy plan for lung cancer.Front Oncol. 2024 Dec 5;14:1429837. doi: 10.3389/fonc.2024.1429837. eCollection 2024. Front Oncol. 2024. PMID: 39703855 Free PMC article. Review.
-
Tracing the history of clinical practice of liquid biopsy: a bibliometric analysis.Front Immunol. 2025 May 13;16:1574736. doi: 10.3389/fimmu.2025.1574736. eCollection 2025. Front Immunol. 2025. PMID: 40433362 Free PMC article.
References
-
- Narjust Duma, Rafael Santana-Davila, Julian R Molina. Non-Small Cell Lung Cancer: Epidemiology, Screening, diagnosis, and Treatment[J]. Mayo Clin Proc 2019,94(8):1623–40. - PubMed
-
- Tetsuya MDTJC-H, Yang M-JA. Ullas Batra,Byoung-Chul Cho,Gerardo Cornelio,Tony Lim,Tony Mok,Kumar Prabhash,Thanyanan Reungwetwattana,Sheng-Xiang Ren,Navneet Singh,Shinichi Toyooka,Yi-Long Wu,Pan-Chyr Yang,Yasushi Yatabe.Expert Consensus recommendations on Biomarker Testing in Metastatic and Nonmetastatic NSCLC in Asia[J] J Thorac Oncol. 2023;18(4):436–46. - PubMed
-
- Marina CG, Julien Mazieres, Martin Reck, Christos Chouaid, Helge Bischoff, Niels Reinmuth, Laura Cove-Smith, Talal Mansy,Diego Cortinovis, Maria RM. Angelo Delmonte, José Garcia Sánchez, Luis Enrique Chara Velarde, Reyes Bernabe, Luis Paz-Ares, Ignacio Diaz Perez, Nataliya Trunova,Kayhan Foroutanpour, Corinne Faivre Finn. Durvalumab After Sequential Chemoradiotherapy in Stage III, Unresectable NSCLC: The Phase 2 PACIFIC-6 Trial[J]. J Thorac Oncol, 2022,17(12):1415–1427. - PubMed
-
- Zihan Z. Bingjie Guan, Huang Xia, Rong Zheng, Benhua Xu. Particle radiotherapy in the era of radioimmunotherapy[J]. Cancer Lett 2023 567:21626810.1016/j.canlet.2023.216268. - PubMed
MeSH terms
Substances
Grants and funding
LinkOut - more resources
Full Text Sources
Medical
Research Materials
