. 2024 Mar;44(3):367-383.
doi: 10.1177/0271678X231214838. Epub 2023 Nov 16.

CCL5 mediated astrocyte-T cell interaction disrupts blood-brain barrier in mice after hemorrhagic stroke

Affiliations

CCL5 mediated astrocyte-T cell interaction disrupts blood-brain barrier in mice after hemorrhagic stroke

Shiyi Zhou et al. J Cereb Blood Flow Metab. 2024 Mar.

Abstract

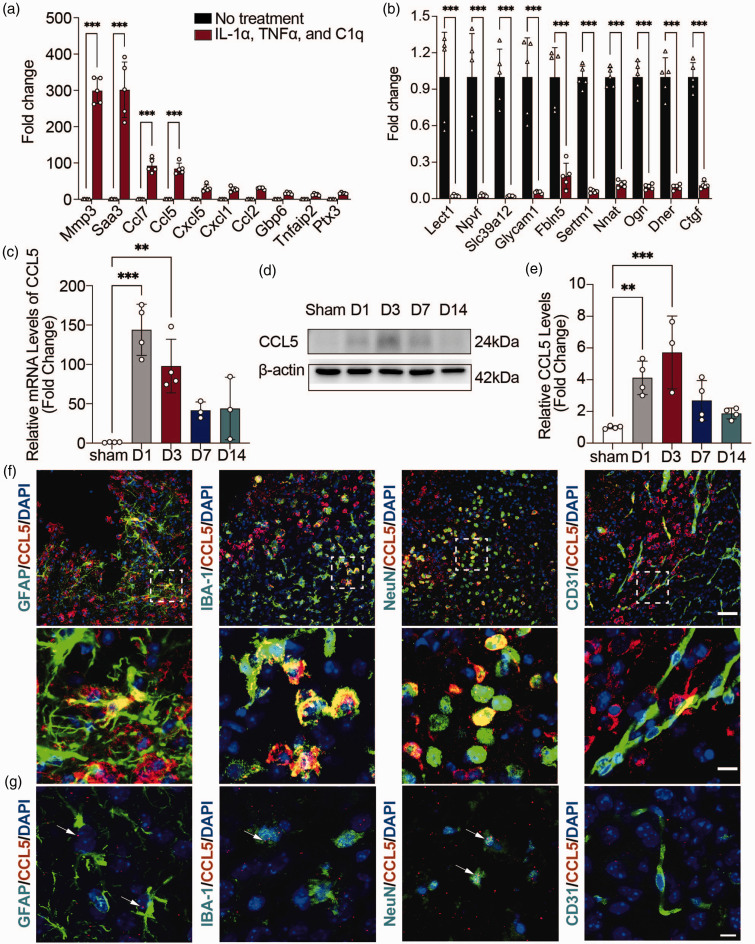
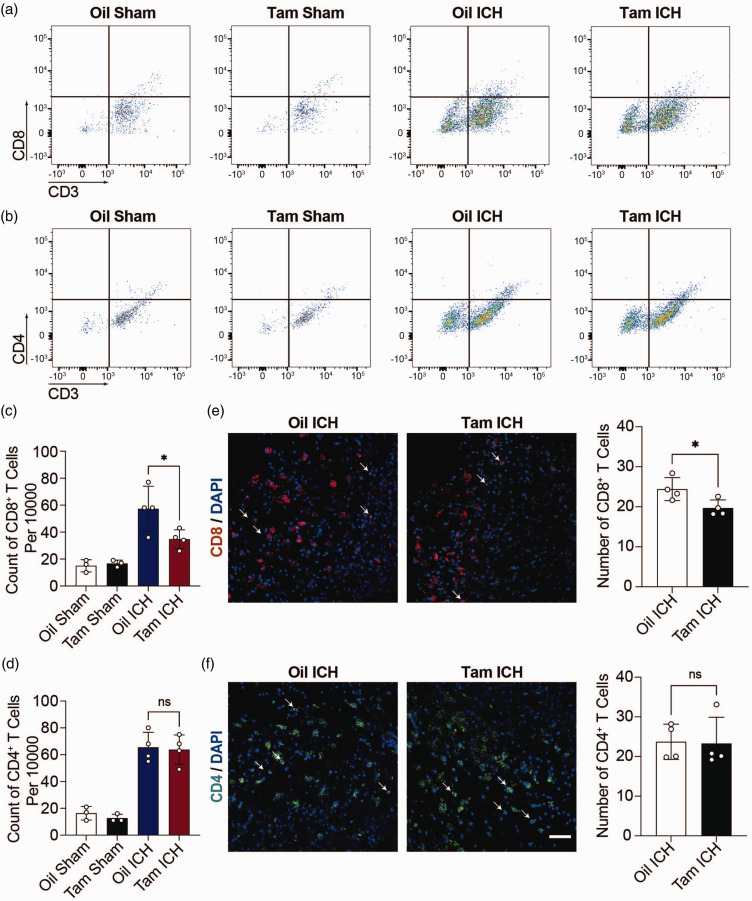
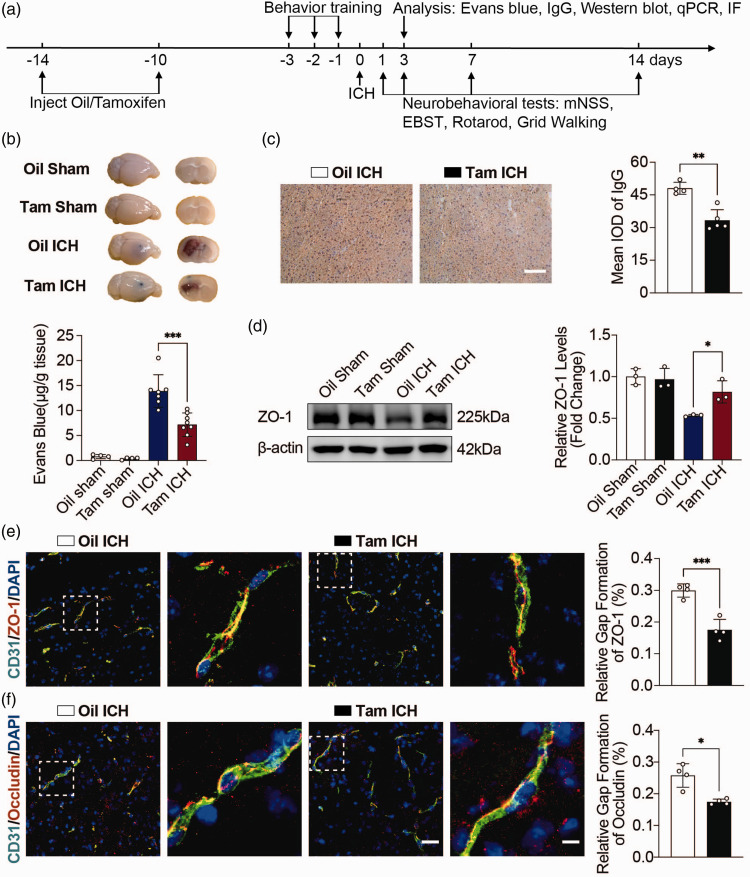
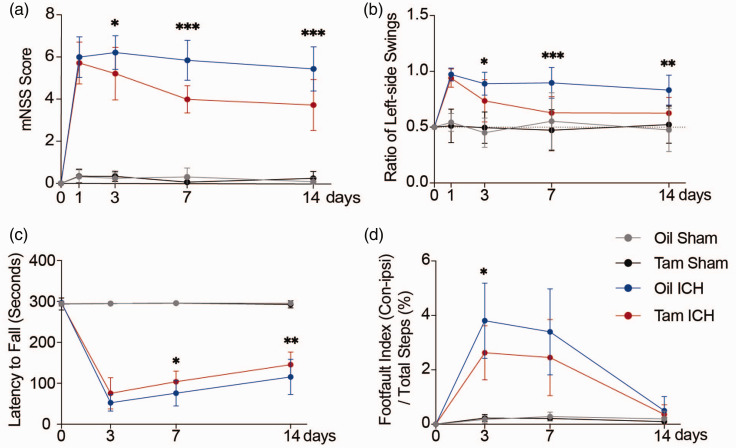
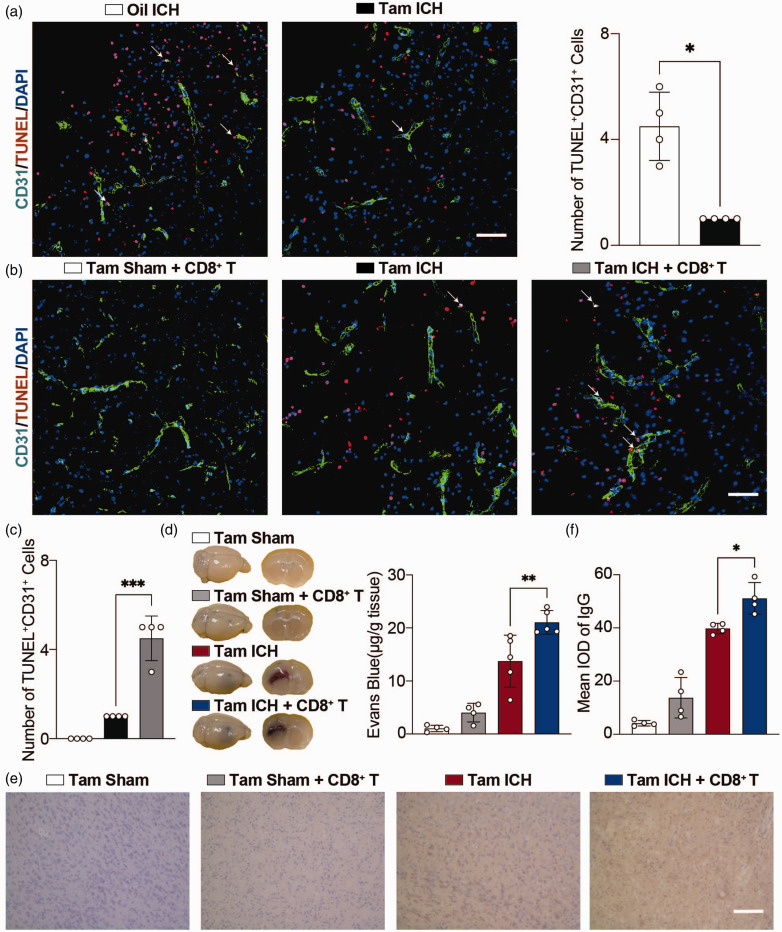
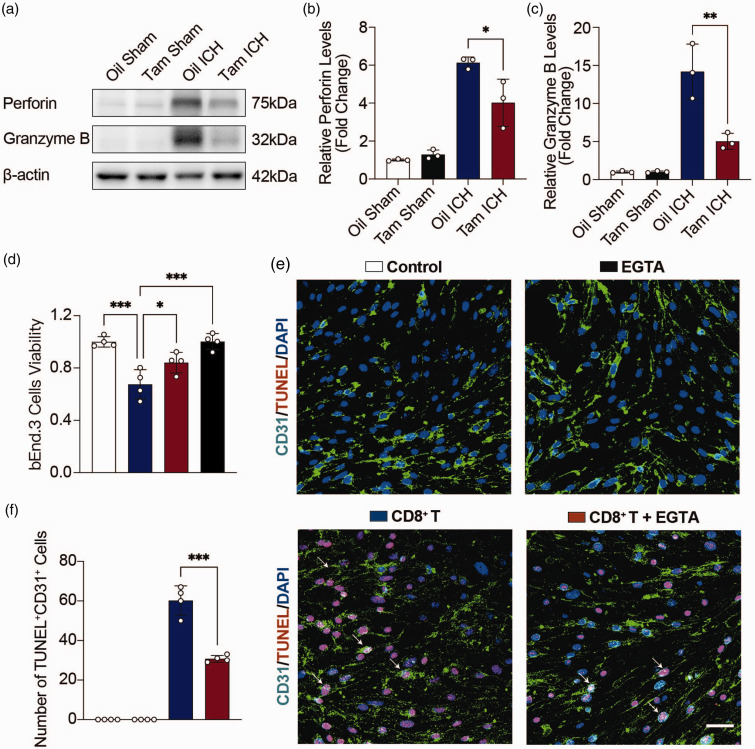
The crosstalk between reactive astrocytes and infiltrated immune cells plays a critical role in maintaining blood-brain barrier (BBB) integrity. However, how astrocytes interact with immune cells and the effect of their interaction on BBB integrity after hemorrhagic stroke are still unclear. By performing RNA sequencing in astrocytes that were activated by interleukin-1α (IL-1α), tumor necrosis factor α (TNFα), and complement component 1q (C1q) treatment, we found CCL5 was among the top upregulated genes. Immunostaining and western blot results demonstrated that CCL5 was increased in mice brain after hemorrhagic stroke. Flow cytometry showed that knockout of astrocytic CCL5 reduced the infiltration of CD8+ but not CD4+ T and myeloid cells into the brain (p < 0.05). In addition, knockout CCL5 in astrocytes increased tight junction-related proteins ZO-1 and Occludin expression; reduced Evans blue leakage, perforin and granzyme B expression; improved neurobehavioral outcomes in hemorrhagic stroke mice (p < 0.05), while transplantation of CD8+ T cells reversed these protective effects. Moreover, co-culture of CD8+ T cells with bEnd.3 cells induced the apoptosis of bEnd.3 cells, which was rescued by inhibiting perforin. In conclusion, our study suggests that CCL5 mediated crosstalk between astrocytes and CD8+ T cells represents an important therapeutic target for protecting BBB in stroke.

Keywords: Astrocytes; CCL5; T cells; blood-brain barrier; intracerebral hemorrhage.


Conflict of interest statement

Declaration of conflicting interestsThe author(s) declared no potential conflicts of interest with respect to the research, authorship, and/or publication of this article.

Figures

Figure 1.
Figure 1.
CCL5 levels increased markedly in reactive astrocytes. (a, b) RT-PCR analysis of 10 upregulated (a) and downregulated (b) genes between reactive astrocytes and resting astrocytes. n = 5 biologically independent primary astrocytes cultures. GAPDH was used as an internal control. Two-way ANOVA with Bonferroni multiple comparisons test. (c) RT-PCR analysis of CCL5 mRNA expression levels in the hemorrhagic perifocal area at 1, 3, 7, and 14 days after ICH. n = 4 mice in Sham/D1/D3 groups (all male), n = 3 mice in D7 and D14 groups (all male). GAPDH was used as an internal control. One-way ANOVA with Dunnett’s multiple comparisons test. (d) Representative immunoblots of CCL5 protein expression levels in the hemorrhagic perifocal area at 1, 3, 7, and 14 days after ICH. (e) Quantification of CCL5 protein expression levels in the hemorrhagic perifocal area at 1, 3, 7, and 14 days after ICH. n = 4 mice in Sham/D1/D7/D14 groups (all male), n = 3 mice in D3 group (all male). β-actin was used as an internal control. One-way ANOVA with Dunnett’s multiple comparisons test. (f) Representative immunostaining images of CCL5 (red) with astrocytes (GFAP, green), microglia (Iba-1, green), neurons (NeuN, green), and ECs (CD31, green) in the hemorrhagic perifocal area at day 3 of ICH. Above scale bar = 50 μm, below scale bar = 10 μm and (g) Representative RNAscope images of CCL5 mRNA (red) with astrocytes (GFAP, green), microglia (Iba-1, green), neurons (NeuN, green), and ECs (CD31, green) in the hemorrhagic perifocal area at day 3 of ICH. Scale bar = 10 μm. Arrows indicated the colocalization of astrocytes, microglia, and neurons with CCL5 mRNA, respectively. All data are presented as mean ± SD. **p < 0.01, ***p < 0.001.
Figure 2.
Figure 2.
Knockout CCL5 in astrocytes reduced CD8+ T infiltration. (a, b) Representative flow cytometry pseudocolor dot plots showed gating strategy of CD8+ T cells (CD3+ CD8+) (a) and CD4+ T cells (CD3+ CD4+) (b) in Aldh1l1CreERT2+/−: CCL5f/f sham mice treated with oil (Oil Sham) or tamoxifen (Tam Sham), Aldh1l1CreERT2+/−: CCL5f/f hemorrhagic stroke mice treated with oil (Oil ICH) or tamoxifen (Tam ICH). (c, d) The count of CD8+ T cells (CD3+ CD8+) (c) and CD4+ T cells (CD3+ CD4+) (d) per 10000 cells in Oil Sham, Tam Sham, Oil ICH and Tam ICH groups. n = 3 mice in Oil Sham group and Tam Sham group (1 female, 2 male), n = 4 mice in Oil ICH group (1 female, 3 male), n = 4 mice in Tam ICH group (2 female, 2 male). One-way ANOVA with Tukey’s multiple comparisons test. (e) Representative immunostaining images of CD8+ T cells (red) in the hemorrhagic perifocal area at day 3 of ICH. Arrowheads indicate CD8+ T cells. The number of CD8+ T cells in Oil ICH and Tam ICH groups in the hemorrhagic perifocal area at day 3 of ICH. n = 4 mice per group (all male). Two-sided, unpaired Student’s test and (f) Representative immunostaining images of CD4+ T cells (green) in the hemorrhagic perifocal area at day 3 of ICH. Scale bar = 50 μm. Arrowheads indicate CD4+ T cells. The number of CD4+ T cells in Oil ICH and Tam ICH groups in the hemorrhagic perifocal area at day 3 of ICH. n = 4 mice per group (all male). Two-sided, Mann-Whitney test. All data are presented as mean ± SD. *p < 0.05, ns, no significance.
Figure 3.
Figure 3.
Knockout CCL5 in astrocytes attenuated BBB damage. (a) Schematic diagram of the experimental design. mNSS, modified neurologic severity score; EBST, elevated body swing test; IF, immunofluorescent staining; IgG, immunoglobulin G. (b) Representative perfused whole brains and 2 mm brain sections after EB injection in Oil Sham, Tam Sham, Oil ICH and Tam ICH groups. Quantification of extravasated EB from brains after EB injection in Oil Sham, Tam Sham, Oil ICH and Tam ICH groups. n = 4 mice in Oil Sham and Tam Sham groups (1 female, 3 male), n = 7 mice in Oil ICH group (2 female, 5 male), n = 8 mice in Tam ICH group (2 female, 6 male). One-way ANOVA with Tukey’s multiple comparisons test. (c) Representative immunostaining images of IgG leakage in the hemorrhagic perifocal area at day 3 of ICH in Oil ICH and Tam ICH groups. Scale bar = 100 μm. Semi-quantification of IgG intensity in the hemorrhagic perifocal area at day 3 of ICH in Oil ICH and Tam ICH groups. n = 4 mice in Oil ICH group (2 female, 2 male), n = 5 mice in Tam ICH group (2 female, 3 male). Two-sided, unpaired Student’s test. (d) Representative immunoblots of ZO-1 protein expression levels in the hemorrhagic perifocal area at day 3 of ICH in Oil Sham, Tam Sham, Oil ICH and Tam ICH groups. Quantification of ZO-1 protein expression levels in the hemorrhagic perifocal area at day 3 of ICH in Oil Sham, Tam Sham, Oil ICH and Tam ICH groups. n = 3 mice per group (2 female, 1 male). β-actin was used as an internal control. One-way ANOVA with Tukey’s multiple comparisons test. (e) Representative immunostaining images of CD31 (green) and ZO-1 (red) in the hemorrhagic perifocal area at day 3 of ICH in Oil ICH and Tam ICH groups. Semi-quantification of gap length of ZO-1 in the hemorrhagic perifocal area at day 3 of ICH in Oil ICH and Tam ICH groups. n = 4 mice per group (2 female, 2 male). Two-sided, unpaired Student’s test and (f) Representative immunostaining images of CD31 (green) and Occludin (red) in the hemorrhagic perifocal area at day 3 of ICH in Oil ICH and Tam ICH groups. Left scale bar = 50 μm, right scale bar = 10 μm. Semi-quantification of gap length of Occludin in the hemorrhagic perifocal area at day 3 of ICH in Oil ICH and Tam ICH groups. n = 4 mice per group (Oil ICH group all male, Tam ICH group 1 female, 3 male). Two-sided, Welch’s t test. All data are presented as mean ± SD. *p < 0.05, **p < 0.01, ***p < 0.001.
Figure 4.
Figure 4.
Knockout CCL5 in astrocytes improved neurobehavioral recovery in mice after ICH. (a–d) Neurobehavioral outcomes of Tam Sham, Oil Sham, Tam ICH and Oil ICH groups were assessed by four neurobehavioral tests including mNSS (a), EBST (b), rotarod test (c), and grid walking test (d). mNSS (a), EBST (b), rotarod test (c), n = 14 mice in Oil Sham, Oil ICH and Tam ICH groups (7 female, 7 male), n = 13 mice in Tam Sham group (7 female, 6 male). Grid walking test (d), n = 12 mice in Oil Sham and Tam Sham groups (6 female, 6 male), n = 9 mice in Oil ICH and Tam ICH groups (3 female, 6 male). Two-way ANOVA with Bonferroni multiple comparisons test. All data are presented as mean ± SD. *p < 0.05, **p < 0.01, ***p < 0.001.
Figure 5.
Figure 5.
CD8+ T cells transplantation aggravated apoptosis of ECs. (a) Representative immunostaining images of CD31 (green) with TUNEL (red) in the hemorrhagic perifocal area at day 3 of ICH in Oil ICH and Tam ICH groups. Scale bar = 50 μm. Arrowheads indicate the colocalization of CD31 with TUNEL. Number of apoptotic ECs in the hemorrhagic perifocal area at day 3 of ICH in Oil ICH and Tam ICH groups. n = 4 mice per group (all male). Two-sided, Welch’s t test. (b) Representative immunostaining images of CD31 (green) with TUNEL (red) in the hemorrhagic perifocal area at day 3 of ICH in Tam Sham + CD8+ T, Tam ICH, and Tam ICH + CD8+ T groups. Scale bar = 50 μm. Arrowheads indicate the colocalization of CD31 with TUNEL. (c) Number of apoptotic ECs in the hemorrhagic perifocal area at day 3 of ICH in Tam Sham + CD8+ T, Tam ICH, and Tam ICH + CD8+ T groups. n = 4 mice per group (2 female, 2 male). One-way ANOVA with Tukey’s multiple comparisons test. (d) Representative perfused whole brains and 2 mm brain sections after EB injection in Tam Sham, Tam Sham + CD8+ T, Tam ICH and Tam ICH + CD8+ T groups. Quantification of extravasated EB from brains after EB injection in Tam Sham, Tam Sham + CD8+ T, Tam ICH, and Tam ICH + CD8+ T groups. n = 4 mice in Tam Sham and Tam Sham + CD8+ T groups (3 female, 1 male), n = 5 mice in Tam ICH group (3 female, 2 male), n =5 mice in Tam ICH + CD8+ T group (2 female, 3 male). One-way ANOVA with Tukey’s multiple comparisons test and (e) Representative immunostaining images of IgG leakage in the hemorrhagic perifocal area in Tam Sham, Tam Sham + CD8+ T, Tam ICH, and Tam ICH + CD8+ T groups. Scale bar = 100 μm. F. Semi-quantification of IgG intensity in the hemorrhagic perifocal area in Tam Sham, Tam Sham + CD8+ T, Tam ICH, and Tam ICH + CD8+ T groups. n = 4 mice per group (2 female, 2 male). One-way ANOVA with Tukey’s multiple comparisons test. All data are presented as mean ± SD. *p < 0.05, **p < 0.01, ***p < 0.001.
Figure 6.
Figure 6.
Inhibition of perforin reduced apoptosis of ECs. (a) Representative immunoblots of Perforin and Granzyme B protein expression levels in the hemorrhagic perifocal area in Oil Sham, Tam Sham, Oil ICH and Tam ICH groups. (b, c) Quantification of Perforin (b) and Granzyme B (c) protein expression levels in the hemorrhagic perifocal area in Oil Sham, Tam Sham, Oil ICH and Tam ICH groups. n = 3 mice per group (2 female, 1 male). β-actin was used as an internal control. One-way ANOVA with Tukey’s multiple comparisons test. (d) Statistics of bEnd.3 cells viability by CCK8 in Control, CD8+ T, CD8+ T + EGTA, and EGTA groups. n = 4 biologically independent bEnd.3 cell cultures. One-way ANOVA with Tukey’s multiple comparisons test. (e) Representative immunostaining images of CD31 (green) with TUNEL (red) in Control, CD8+ T, CD8+ T + EGTA, and EGTA groups. Scale bar = 50 μm. Arrowheads indicate the colocalization of CD31 with TUNEL and (f) Number of apoptotic bEnd.3 cells in Control, CD8+ T, CD8+ T + EGTA, and EGTA groups. n = 4 biologically independent bEnd.3 cell cultures. One-way ANOVA with Tukey’s multiple comparisons test. All data are presented as mean ± SD. *p < 0.05, **p < 0.01, ***p < 0.001.

Similar articles

Cited by

References

    1. Daneman R, Prat A. The blood-brain barrier. Cold Spring Harb Perspect Biol 2015; 7: a020412. - PMC - PubMed
    1. Huang X, Hussain B, Chang J. Peripheral inflammation and blood-brain barrier disruption: effects and mechanisms. CNS Neurosci Ther 2021; 27: 36–47. - PMC - PubMed
    1. Pivoriūnas A, Verkhratsky A. Astrocyte–endotheliocyte axis in the regulation of the blood–brain barrier. Neurochem Res 2021; 46: 2538–2550. - PubMed
    1. Tschoe C, Bushnell CD, Duncan PW, et al.. Neuroinflammation after intracerebral hemorrhage and potential therapeutic targets. J Stroke 2020; 22: 29–46. - PMC - PubMed
    1. Sukumari-Ramesh S, Alleyne CH, Dhandapani KM. Astrogliosis: a target for intervention in intracerebral hemorrhage? Transl Stroke Res 2012; 3: 80–87. - PubMed

Publication types

LinkOut - more resources