

Stuart has got the PoWeR! Skeletal muscle adaptations to a novel heavy progressive weighted wheel running exercise model in C57BL/6 mice
- PMID: 37974360
- PMCID: PMC10988744
- DOI: 10.1113/EP091494
Stuart has got the PoWeR! Skeletal muscle adaptations to a novel heavy progressive weighted wheel running exercise model in C57BL/6 mice
Abstract
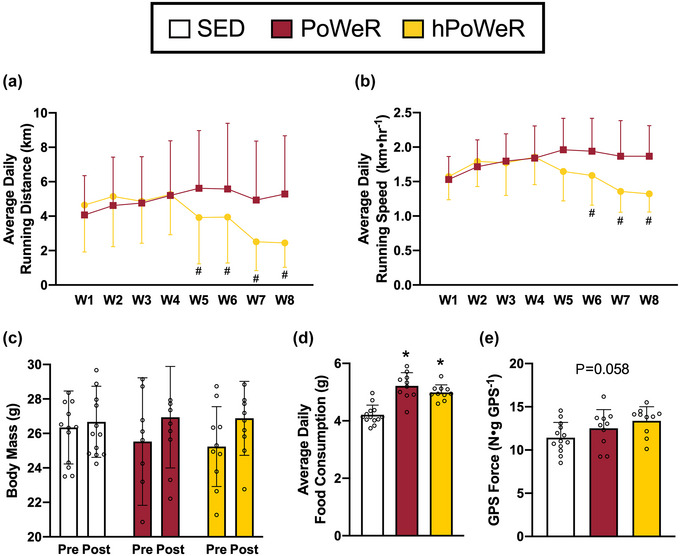
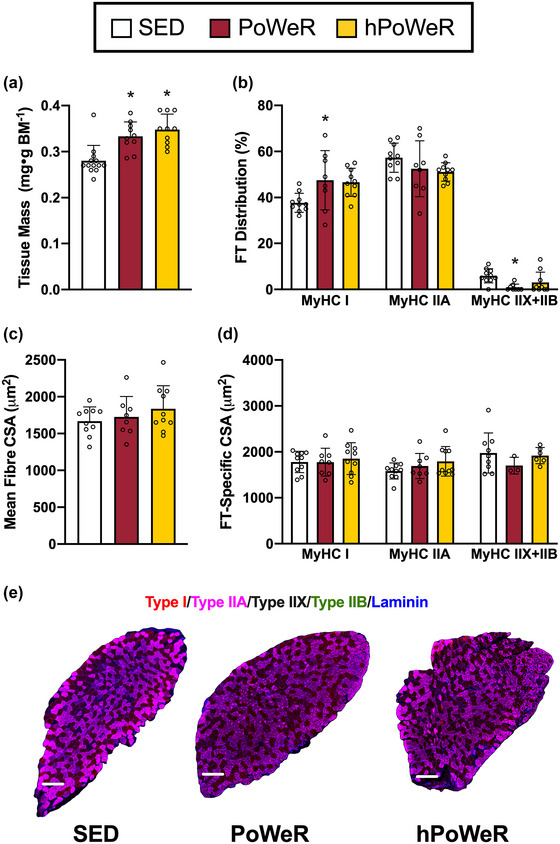
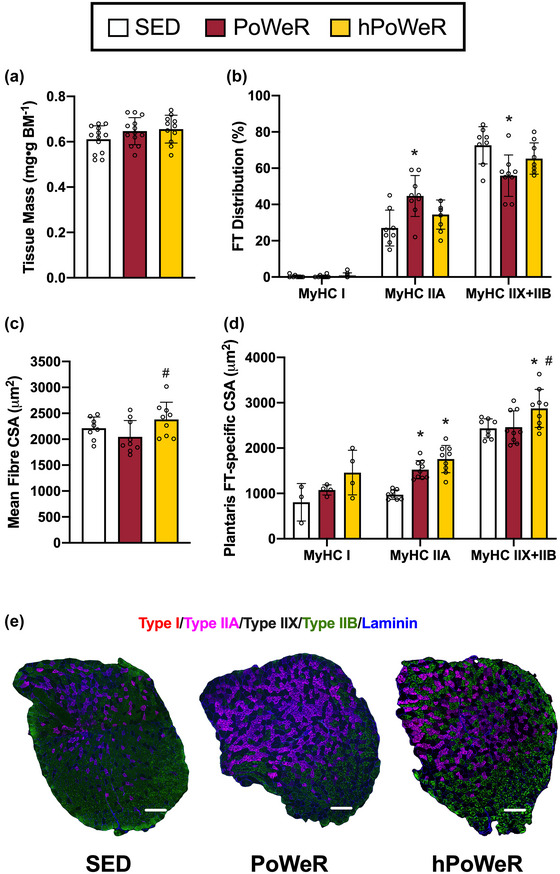
Murine exercise models are developed to study the molecular and cellular mechanisms regulating muscle mass. A progressive weighted wheel running model, named 'PoWeR', was previously developed to serve as a more translatable alternative to involuntary resistance-type exercise models in rodents, such as synergist ablation. However, mice still run great distances despite the added resistance as evidenced by a large glycolytic-to-oxidative shift in muscle fibre type. Thus, PoWeR reflects a blended resistance/endurance model. In an attempt to bias PoWeR further towards resistance-type exercise, we developed a novel heavy PoWeR model (hPoWeR) utilizing higher wheel loads (max of 12.5 g vs 6 g). Adult male C57BL/6 mice voluntarily performed an 8-week progressive loading protocol (PoWeR or hPoWeR). Running distance peaked at ∼5-6 km day-1 in both treatments and was maintained by PoWeR mice, but declined in the hPoWeR mice as load increased beyond 7.5 g. Peak isometric force of the gastrocnemius-soleus-plantaris complex tended to increase in wheel running treatments. Soleus mass increased by 19% and 24% in PoWeR and hPoWeR treatments, respectively, and plantaris fibre cross-sectional area was greater in hPoWeR, compared to PoWeR. There were fewer glycolytic and more oxidative fibres in the soleus and plantaris muscles in the PoWeR treatment, but not hPoWeR. Collectively, these data suggest hPoWeR may modestly alter skeletal muscle supporting the aim of better reflecting typical resistance training adaptations, in line with decreased running volume and exposure to higher resistance. Regardless, PoWeR remains an effective hypertrophic concurrent training model in mice.
Keywords: murine exercise models; muscle hypertrophy; resistance exercise.
© 2023 The Authors. Experimental Physiology published by John Wiley & Sons Ltd on behalf of The Physiological Society.
Conflict of interest statement
The authors have no conflicts of interest to declare.
Figures
Similar articles
-
A Simple and Inexpensive Running Wheel Model for Progressive Resistance Training in Mice.J Vis Exp. 2022 Apr 28;(182). doi: 10.3791/63933. J Vis Exp. 2022. PMID: 35575533
-
Voluntary resistance running wheel activity pattern and skeletal muscle growth in rats.Exp Physiol. 2008 Jun;93(6):754-62. doi: 10.1113/expphysiol.2007.041244. Epub 2008 Feb 15. Exp Physiol. 2008. PMID: 18281393
-
Progressive resistance-loaded voluntary wheel running increases hypertrophy and differentially affects muscle protein synthesis, ribosome biogenesis, and proteolytic markers in rat muscle.J Anim Physiol Anim Nutr (Berl). 2018 Feb;102(1):317-329. doi: 10.1111/jpn.12691. Epub 2017 Mar 15. J Anim Physiol Anim Nutr (Berl). 2018. PMID: 28294417
-
Muscle-Specific Cellular and Molecular Adaptations to Late-Life Voluntary Concurrent Exercise.Function (Oxf). 2022 May 23;3(4):zqac027. doi: 10.1093/function/zqac027. eCollection 2022. Function (Oxf). 2022. PMID: 35774589 Free PMC article.
-
Muscle mechanics: adaptations with exercise-training.Exerc Sport Sci Rev. 1996;24:427-73. Exerc Sport Sci Rev. 1996. PMID: 8744258 Review.
Cited by
-
PoWeR elicits intracellular signaling, mitochondrial adaptations, and hypertrophy in multiple muscles consistent with endurance and resistance exercise training.J Appl Physiol (1985). 2025 Apr 1;138(4):1034-1049. doi: 10.1152/japplphysiol.00872.2024. Epub 2025 Mar 18. J Appl Physiol (1985). 2025. PMID: 40100208 Free PMC article.
-
The utility-and limitations-of the rodent synergist ablation model in examining mechanisms of skeletal muscle hypertrophy.Am J Physiol Cell Physiol. 2024 Sep 1;327(3):C607-C613. doi: 10.1152/ajpcell.00405.2024. Epub 2024 Jul 29. Am J Physiol Cell Physiol. 2024. PMID: 39069828 Review.
-
Animal Models of Exercise and Cardiometabolic Disease.Circ Res. 2025 Jul 7;137(2):139-162. doi: 10.1161/CIRCRESAHA.124.325704. Epub 2025 Jul 3. Circ Res. 2025. PMID: 40608858 Review.
References
-
- Allen, D. L. , Harrison, B. C. , Maass, A. , Bell, M. L. , Byrnes, W. C. , & Leinwand, L. A. (2001). Cardiac and skeletal muscle adaptations to voluntary wheel running in the mouse. Journal of Applied Physiology, 90(5), 1900–1908. - PubMed
-
- Baar, K. , & Esser, K. (1999). Phosphorylation of p70S6k correlates with increased skeletal muscle mass following resistance exercise. American Journal of Physiology. Cell Physiology, 276(1), C120–C127. - PubMed
-
- Cholewa, J. , Guimarães‐Ferreira, L. , da Silva Teixeira, T. , Naimo, M. A. , Zhi, X. , de Sá, R. B. D. P. , Lodetti, A. , Cardozo, M. Q. , & Zanchi, N. E. (2014). Basic models modeling resistance training: An update for basic scientists interested in study skeletal muscle hypertrophy. Journal of Cellular Physiology, 229(9), 1148–1156. - PubMed
MeSH terms
Grants and funding
LinkOut - more resources
Full Text Sources