. 2024 Jan;11(3):e2304017.
doi: 10.1002/advs.202304017. Epub 2023 Nov 17.

Single-Cell Transcriptome Atlas and Regulatory Dynamics in Developing Cotton Anthers

Affiliations

Single-Cell Transcriptome Atlas and Regulatory Dynamics in Developing Cotton Anthers

Yanlong Li et al. Adv Sci (Weinh). 2024 Jan.

Abstract

Plant anthers are composed of different specialized cell types with distinct roles in plant reproduction. High temperature (HT) stress causes male sterility, resulting in crop yield reduction. However, the spatial expression atlas and regulatory dynamics during anther development and in response to HT remain largely unknown. Here, the first single-cell transcriptome atlas and chromatin accessibility survey in cotton anther are established, depicting the specific expression and epigenetic landscape of each type of cell in anthers. The reconstruction of meiotic cells, tapetal cells, and middle layer cell developmental trajectories not only identifies novel expressed genes, but also elucidates the precise degradation period of middle layer and reveals a rapid function transition of tapetal cells during the tetrad stage. By applying HT, heterogeneity in HT response is shown among cells of anthers, with tapetal cells responsible for pollen wall synthesis are most sensitive to HT. Specifically, HT shuts down the chromatin accessibility of genes specifically expressed in the tapetal cells responsible for pollen wall synthesis, such as QUARTET 3 (QRT3) and CYTOCHROME P450 703A2 (CYP703A2), resulting in a silent expression of these genes, ultimately leading to abnormal pollen wall and male sterility. Collectively, this study provides substantial information on anthers and provides clues for heat-tolerant crop creation.

Keywords: anthers; high temperature; single-cell RNA sequencing (scRNA-seq); single-cell multi-omics; tapetum.


Conflict of interest statement

The authors declare no conflict of interest.

Figures

Figure 1
Figure 1
Generation of a cotton anther cell expression atlas. A) Schematic of single‐cell sequencing in cotton anthers. B) Sketches of anatomy of cotton anther. C) An integrated uniform manifold approximation and projection (UMAP) visualization of 18 cell clusters in cotton anthers. Each dot denotes a single‐cell. Colors denote corresponding cell clusters. D) 18 cell clusters displayed by 3D UMAP scatterplots. Cluster names and colors are the same as in (C). E) Expression patterns of representative cluster‐specific marker genes on UMAP. Dot diameter indicates the proportion of cluster cells expressing a given gene. F) The expression patterns of selected marker genes in cotton anthers using UMAP plots and RNA in situ hybridization assays. KCS11, 3‐KETOACYL‐COA SYNTHASE 11; PRX71, PEROXIDASE 71; PRX40, PEROXIDASE40; AMS, ABORTED MICROSPORES; HTA3, HISTONE H2A 3; MS5, MALE‐STERILE 5; TPS21, TERPENE SYNTHASE 21; NAC083, NAC DOMAIN CONTAINING PROTEIN 83; CAX3, CATION EXCHANGER 3; EP, epidermis; EN, endothecium; ML, middle layer; T, tapetum; MAM, microspore after meiotic; V, vascular region; C, connective; MC, meiotic cell.
Figure 2
Figure 2
Developmental trajectory of middle layer.A) UMAP projections showing middle layer cells populations. ML1 to ML3, sub‐cell clusters. B) UMAP of the pseudotime trajectory of middle layer cells by using Monocle3. C,D) Simulation of the successive developmental trajectory of middle layer over pseudo‐time by using Monocle2. E) Expression patterns of TGA10, ARPN, TCH4, and CYSB over pseudo‐time. F) Heatmap showing hierarchical clustering of the expression of DEGs in each pseudotime cluster. GO terms and p value of each gene cluster are shown in the table on the right. G) Observation of the middle layer in cotton anther at stage 7 to stage 11. Scale bar, 20 µm. TGA10, TGACG MOTIF‐BINDING PROTEIN 10; ARPN, PLANTACYANIN; TCH4, TOUCH 4; CYSB, CYSTATIN B; ML, middle layer; T, tapetum.
Figure 3
Figure 3
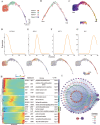
Developmental trajectory of tapetum cells. A) Uniform manifold approximation and projection (UMAP) showing tapetum cell populations (clusters 2, 5, 7 and 10). Each dot denotes a single‐cell. B) Simulation of the successive developmental trajectory of tapetum over pseudo‐time by using Monocle2. “Start” denotes the beginning of pseudo‐time. “End” denotes the ending of pseudo‐time. C) UMAP of the pseudotime trajectory of tapetum cells by using Monocle3. D–G) Expression patterns of GLUCOSYL TRANSFERASE 85A3 (UGT85A3), SUCROSE‐PHOSPHATE SYNTHASE A2 (SPSA2), KINESIN 7.4 (KIN7.4), and MALE STERILITY 1 (MS1) over pseudo‐time. Color bar indicates the relative expression level. H) Heatmap showing hierarchical clustering of the expression of differentially expressed genes (DEGs) in each tapetum cell cluster along pseudotime. Representative cluster‐dependent genes, GO terms and p value of each gene cluster are shown in the table on the right. Color bar indicates the relative expression level. I) A gene regulatory network (GRN) built of 155 TFs expressed dynamically across tapetum pseudotime with a parameter cutoff of 0.1. Node size is equivalent to the number of predicted connections. Edge color represents activation (blue) or repression (green). Edge width represents the strength of the predicted connection.
Figure 4
Figure 4
Single‑cell chromatin accessibility under NT in cotton anthers. A) UMAP plot of scRNA‐seq and scATAC‐seq data and their weighted mutual neighbor (WNN) data, as well as integrated WNN analysis. Cells are labeled by their scRNAseq‐annotated clusters. B) The cluster‐cluster correlation (Spearman correlation coefficient) between scRNA‐seq (bottom) and scATAC‐seq (right). The scATAC‐seq was calculated based on gene activity scores per cluster. The scRNA‐seq correlation was calculated based on gene expression per cluster. C) Heatmap of Z‐scores of cluster‐specific peaks derived from scATAC‐seq. D) The mean TF family motif enrichment (average deviation scores per cluster per TF family) across all clusters scale by row with z‐score. E) UMAP projection of scATAC‐seq profiles colored by chromVAR TF motif bias‐corrected deviations for the MYB‐related TFs. EP, epidermis; EN, endothecium; ML, middle layer; T, tapetum; MAM, microspore after meiotic; V, vascular region; C, connective; MC, meiotic cell.
Figure 5
Figure 5
Construction of a single‐cell transcriptome atlas under HT of cotton anthers. A) UMAP plots of NT and HT cells after integration using Seurat. After integration, cells were clustered and labeled based on a previously annotated NT reference dataset. B) Preference of each cell type under HT stress. C) The number of up‐regulated and down‐regulated genes under HT was shown in a volcano plot. D) The above represents each cell type‐specific upregulated gene and the corresponding enrichment pathways. The below represents upregulated genes and the corresponding enrichment pathways in more than two cell types. Color bars indicate the z‐score of −log10 (p‐value). E) The above represents each cell type‐specific down‐regulated gene and the corresponding enrichment pathways. The below represents down‐regulated genes and the corresponding enrichment pathways in more than two cell types. Color bars indicate the z‐score of −log10 (p‐value). EP, epidermis; EN, endothecium; ML, middle layer; T, tapetum; MAM, microspore after meiotic; V, vascular region; C, connective; MC, meiotic cell; NT, normal temperature; HT, high temperature.
Figure 6
Figure 6
The tapetal cells responsible for pollen wall synthesis are the most sensitive to HT. A) UMAP visualization of the integration of scRNA‐seq scATAC‐seq under NT and HT base on the WNN graph. B) Transmission electron microscopy analysis of pollen walls at stage 8 under NT and HT. Scale bar, 2 µm. C) The exine, D) nexine, and E) intine wall thickness of pollen walls under NT and HT at stage 8. The P‐value was calculated by using the Student t‐test (n >24). The error bars represent standard deviations (SDs). ** p <0.01. F) Gene co‐expression network for tapetal cells that disappeared under HT. The marked genes represent genes that have been previously reported to be associated with pollen wall formation. Different colors represent different modules. G) Visualization of chromatin accessibility tracks of the Gh CYP703A2 locus across all clusters. H) Luminescence imaging of transient dual‐luciferase reporter assay between GhMS188 and Gh CYP703A2 promoter or Gh CYP703A2 promoter without MYB‐binding sites. Luminescence signals on N. benthamiana leaves were visualized using a cryogenically cooled CCD camera. p Δ CYP703A2 represents the Gh CYP703A2 promoter without MYB‐related binding elements. I) Associations of GhMS188 with Gh CYP703A2 promoter in LUC assays in N. benthamiana leaves under NT and HT. EP, epidermis; EN, endothecium; ML, middle layer; T, tapetum; MAM, microspore after meiotic; V, vascular region; C, connective; MC, meiotic cell; In, intine; NE, nexine; Ba, bacula; Te, tectum; NT, normal temperature; HT, high temperature.
Figure 7
Figure 7
HT inhibits the expression of QRT3 and CYP703A2 and causes male sterility. A,B) UMAP plots above showed the expression of CYP703A2 (A) and QRT3 (B) under NT and HT. The right panel represents the RNA in situ hybridization of CYP703A2 (A) and QRT3(B) under NT and HT at stage 7 to 9. Scale bar, 50 µm. C,E) Male Phenotypes of cyp703a2 (C), qrt3 (E), and WT plants under NT. Red pollen grains represent fertile and white pollen grains represent sterile. Scale bars above = 5 mm. Scale bars below = 200 µm. D,F) Transmission electron microscopy analysis of pollen walls from the cyp703a2 (D), qrt3 (F), and WT plants under NT at stage 8. Scale bar, 2 µm. G) Immunofluorescence studies of pectin of anther under NT and HT at stage7 to 9. Sections were stained with antibodies against de‐esterified pectin (JIM5) and esterified pectin (JIM7). Scale bar, 50 µm. H) Immunofluorescence signals intensity of microspore in (H) measured by ImageJ under NT and HT. The P‐value was calculated by using the Student t‐test (n >10). ns, not significant. ** p <0.01. I) Sporopollenin autofluorescence in NT and HT anther sections at stage 8, stage 9, and stage 10. Scale bar, 50 µm. J) Fluorescence signals intensity of microspore in (G) measured by ImageJ under NT and HT. The P‐value was calculated by using the Student t‐test (n >10). ** p <0.01. In, intine; NE, nexine; Ba, bacula; Te, tectum; T, tapetum; Msp, microspore; NT, normal temperature; HT, high temperature.
Figure 8
Figure 8
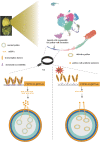
Model of the effect of HT on pollen wall formation. This model shows chromatin accessibility of genes specifically expressed in the tapetum cells responsible for pollen wall synthesis was closed under HT, resulting in the silencing of these genes due to the inability of transcription factors like MYB to bind to their promoter regions to regulate their expression, ultimately leading to abnormal pollen wall formation under heat stress. NT and HT: normal temperature and high temperature, respectively.

Similar articles

Cited by

References

    1. van der Linde K., Walbot V., Curr. Top. Dev. Biol. 2019, 131, 239. - PubMed
    1. Sanders P. M., Bui A. Q., Weterings K., McIntire K. N., Hsu Y.‐C., Lee P. Y., Truong M. T., Beals T. P., Goldberg R. B., Sexual Plant Reproduction 1999, 11, 297.
    1. Wu Y., Min L., Wu Z., Yang L., Zhu L., Yang X., Yuan D., Guo X., Zhang X., Sci. Rep. 2015, 5, 9608. - PMC - PubMed
    1. Zhang D., Luo X., Zhu L., J. Genet. Genomics 2011, 38,379. - PubMed
    1. Walbot V., Egger R. L., Annu. Rev. Plant Biol. 2016, 67, 365. - PubMed

Publication types

LinkOut - more resources