. 2023 Apr;2(4):383-398.
doi: 10.1038/s44161-023-00250-w. Epub 2023 Mar 8.

Redifferentiated cardiomyocytes retain residual dedifferentiation signatures and are protected against ischemic injury

Affiliations

Redifferentiated cardiomyocytes retain residual dedifferentiation signatures and are protected against ischemic injury

Avraham Shakked et al. Nat Cardiovasc Res. 2023 Apr.

Abstract

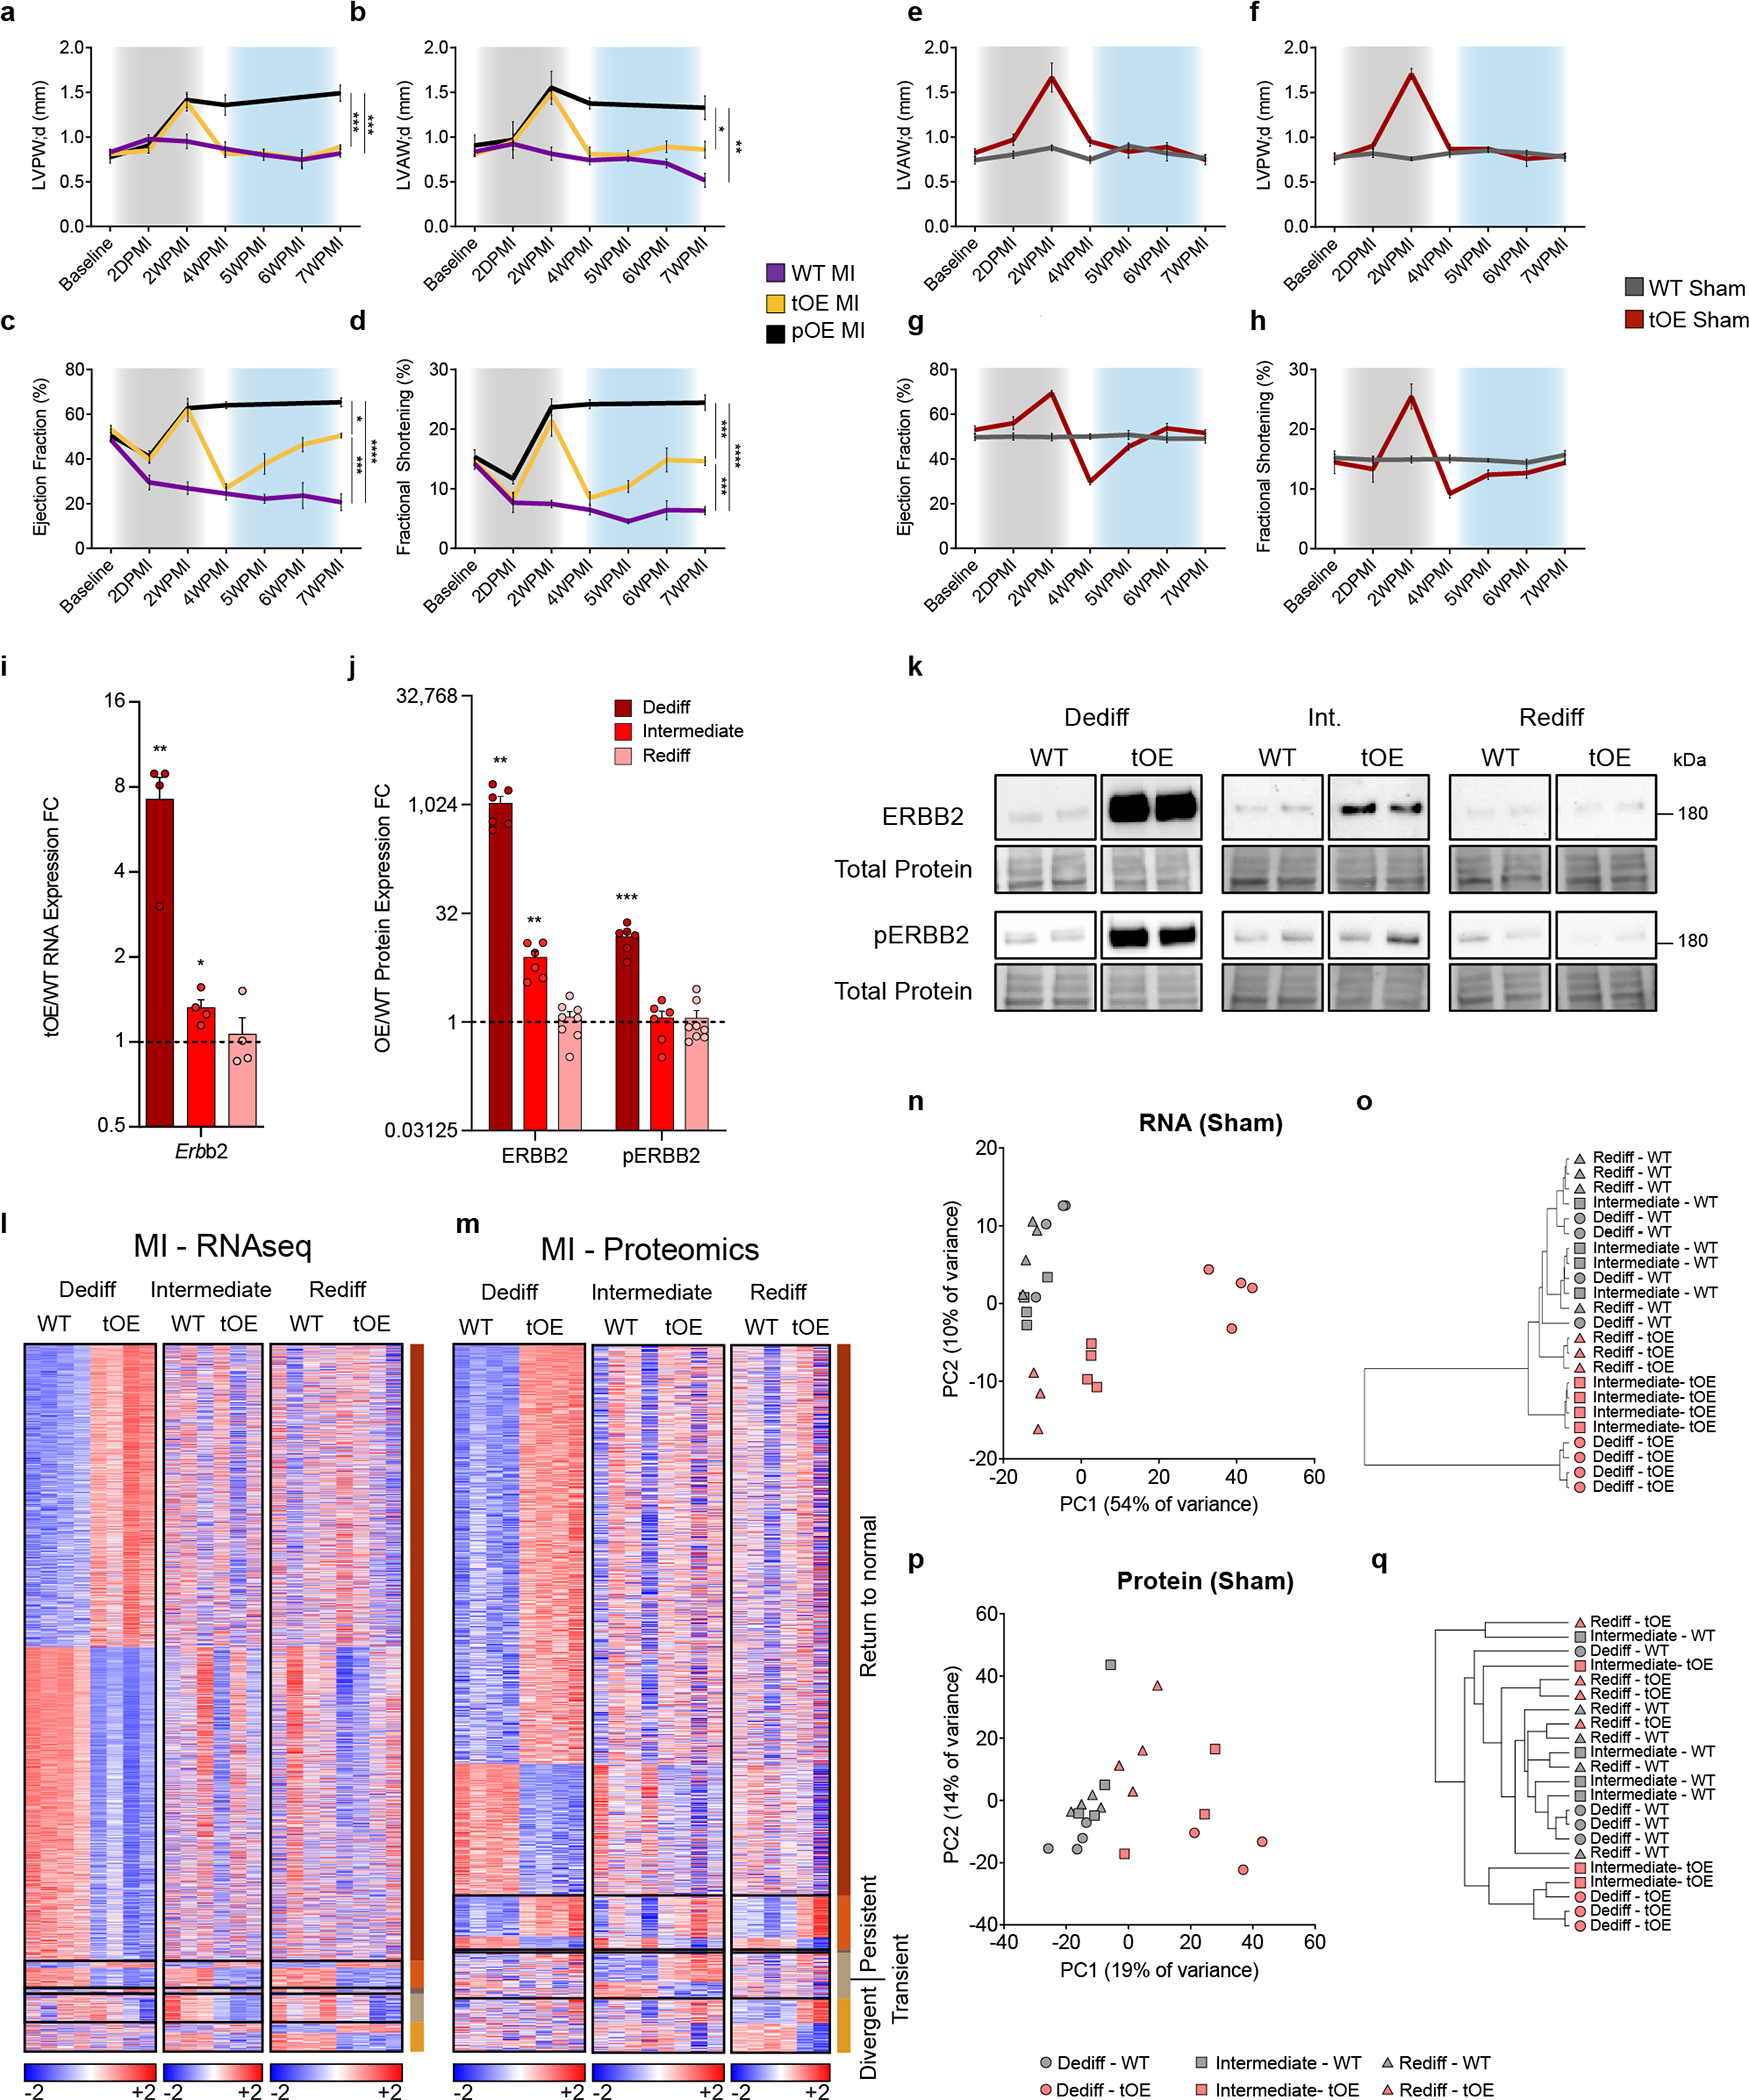
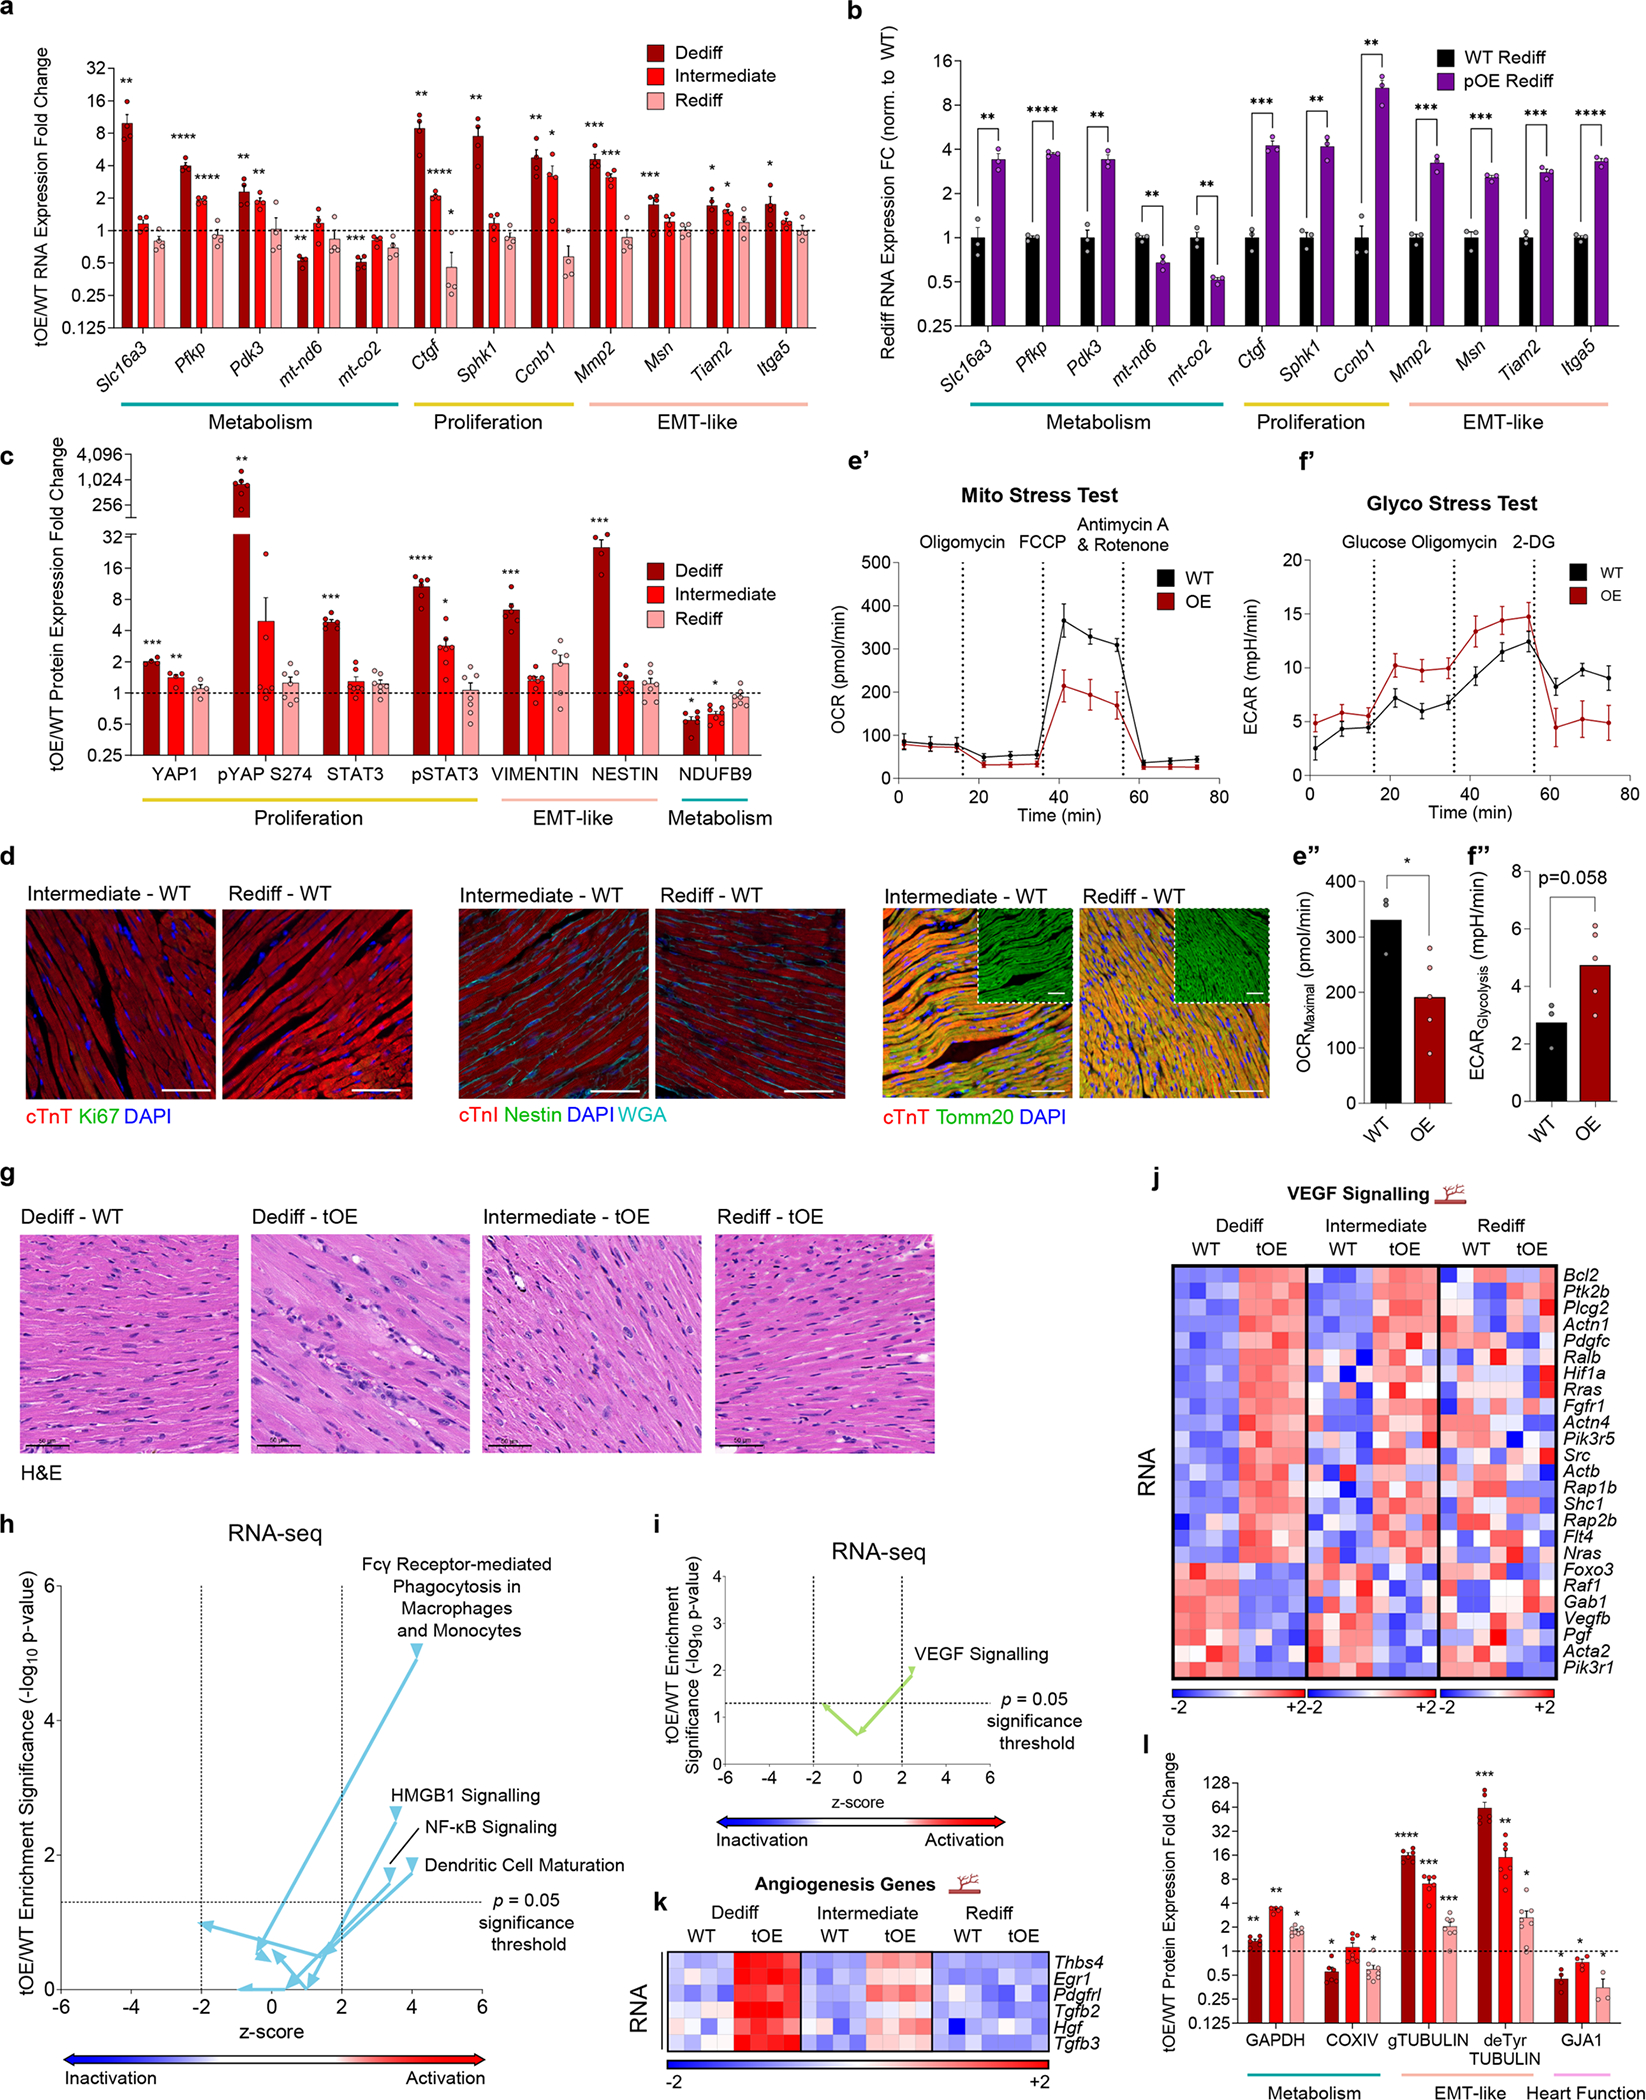
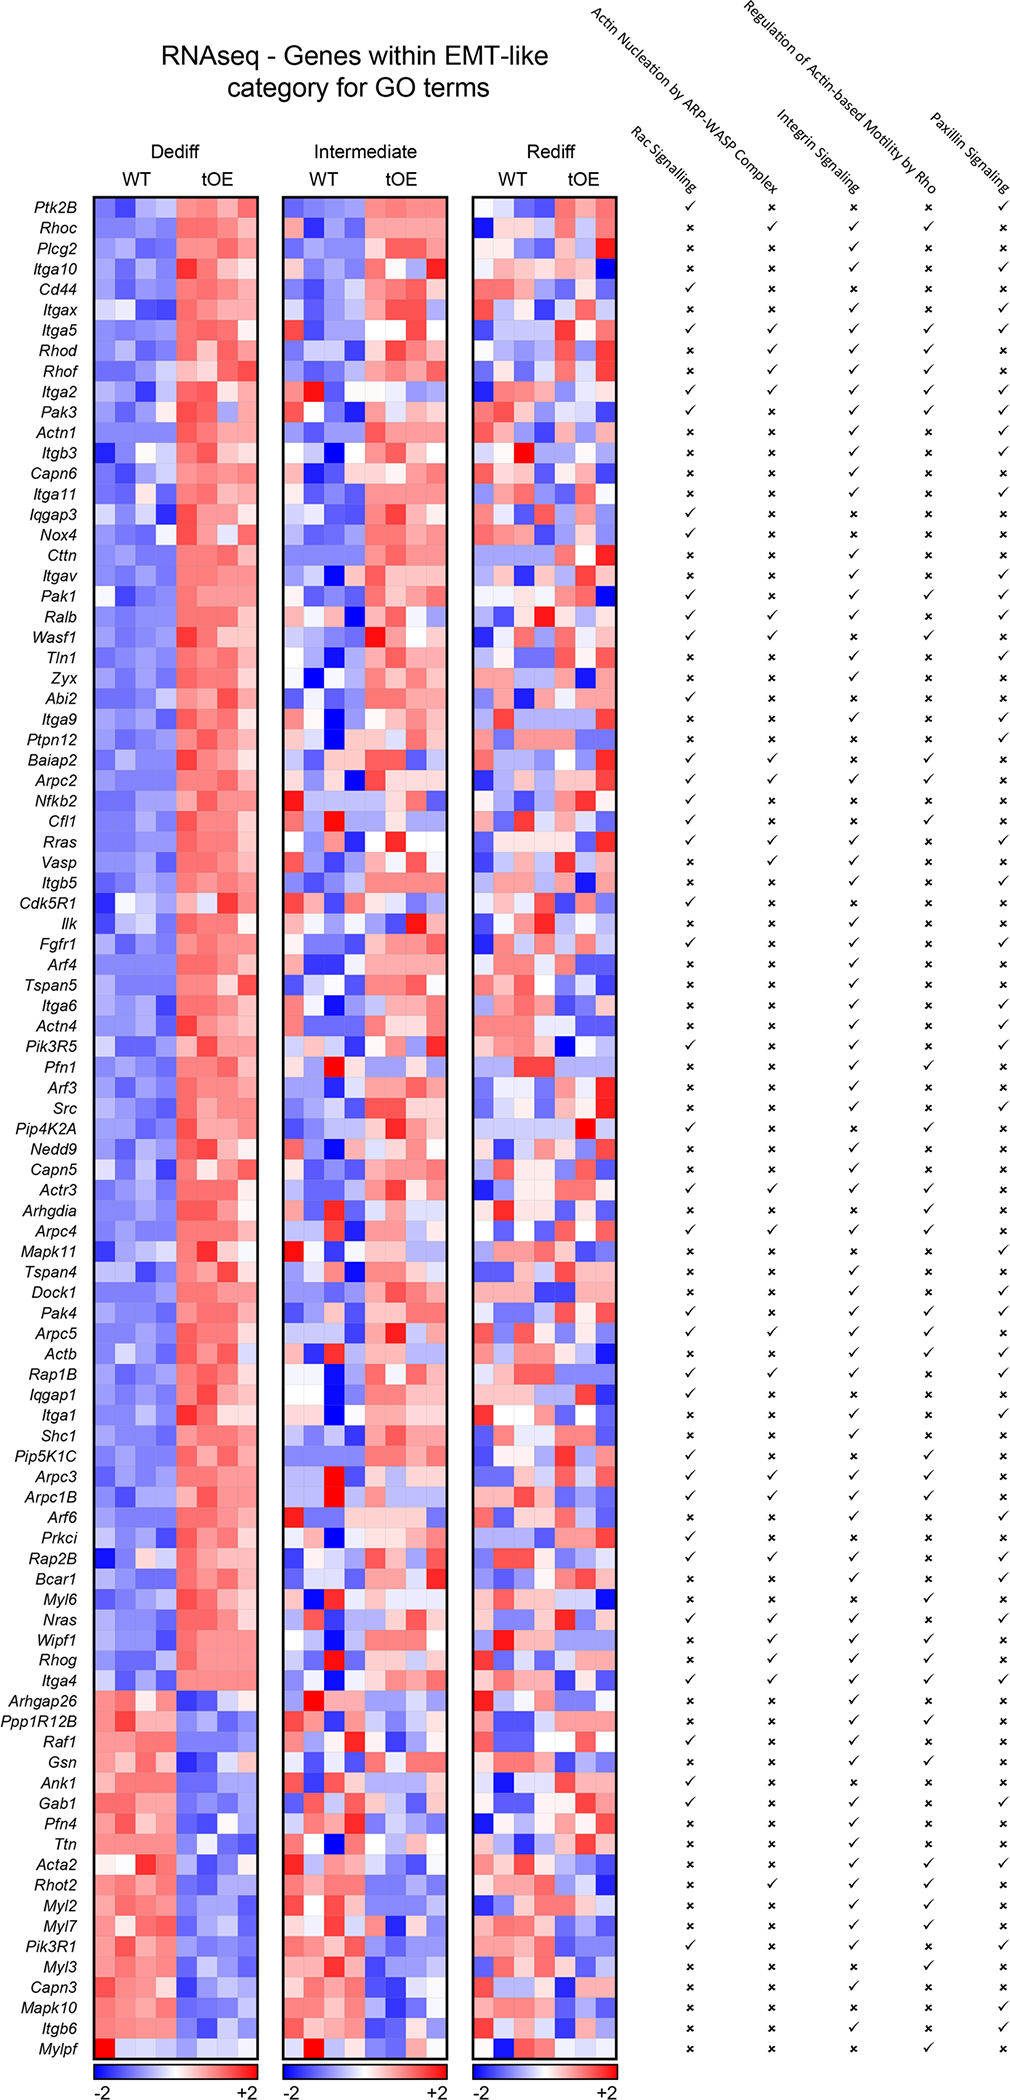
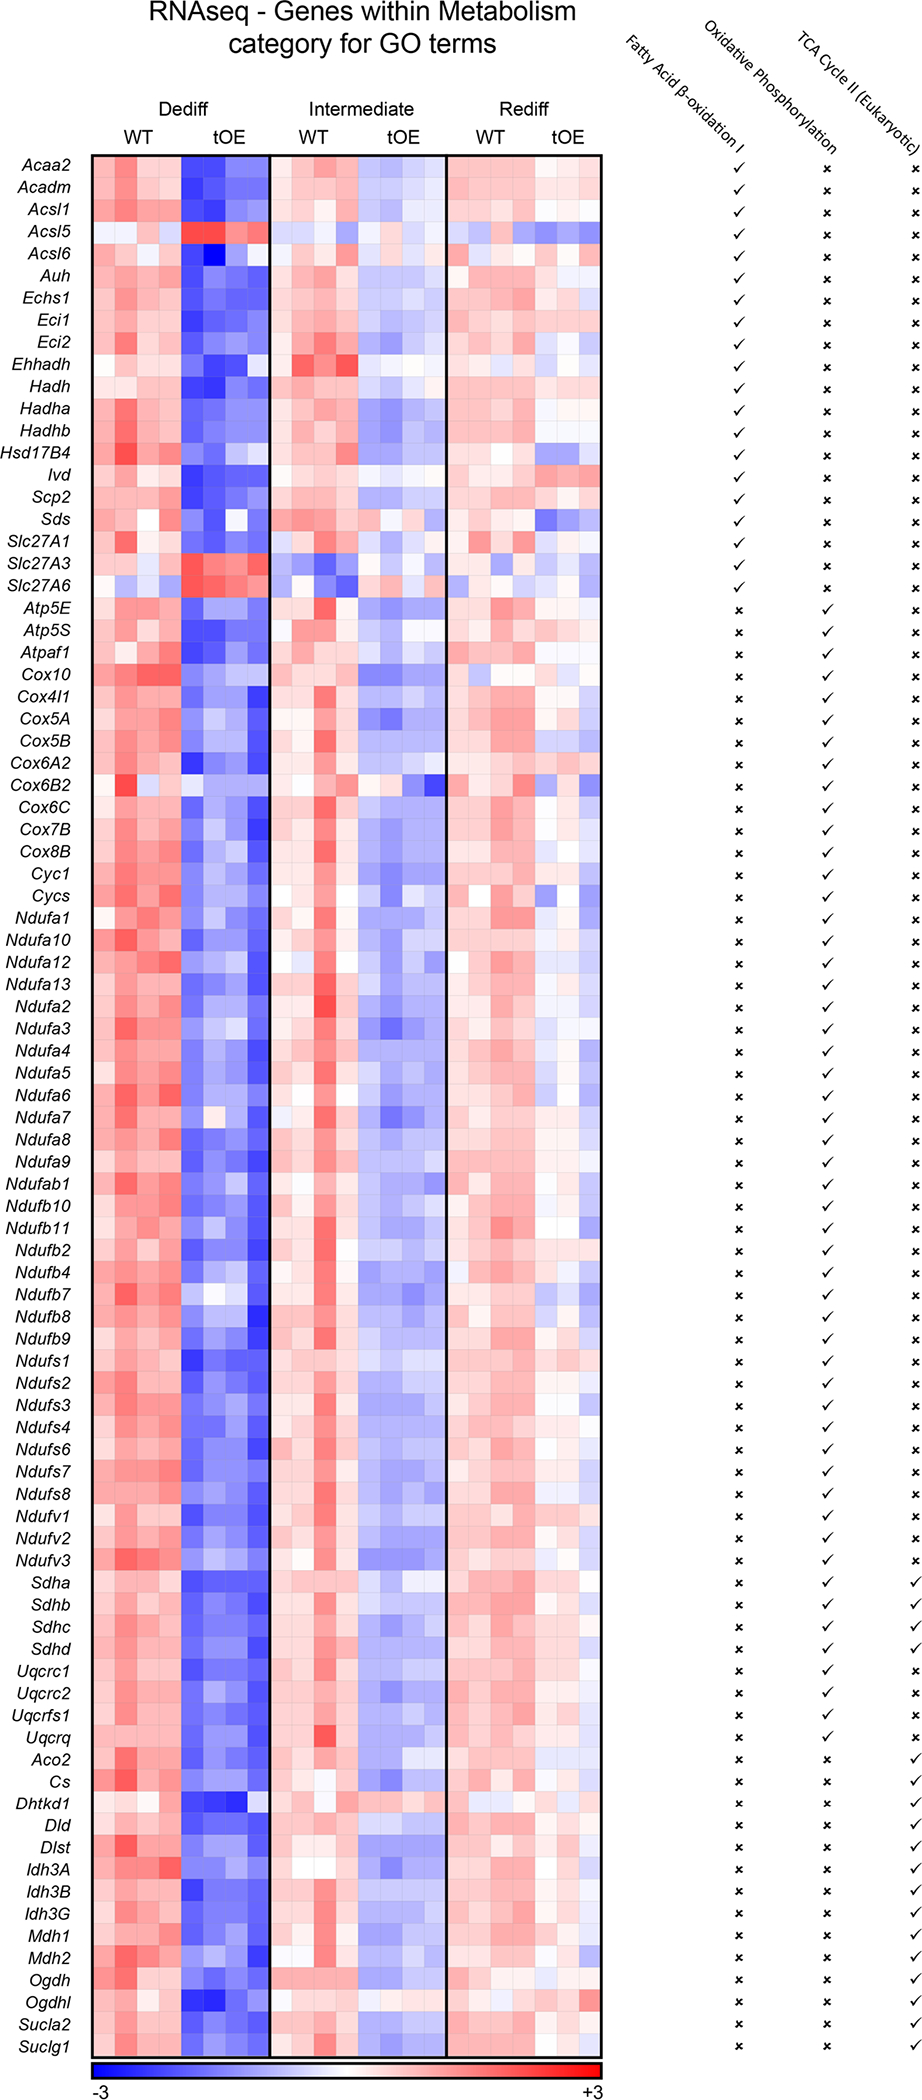
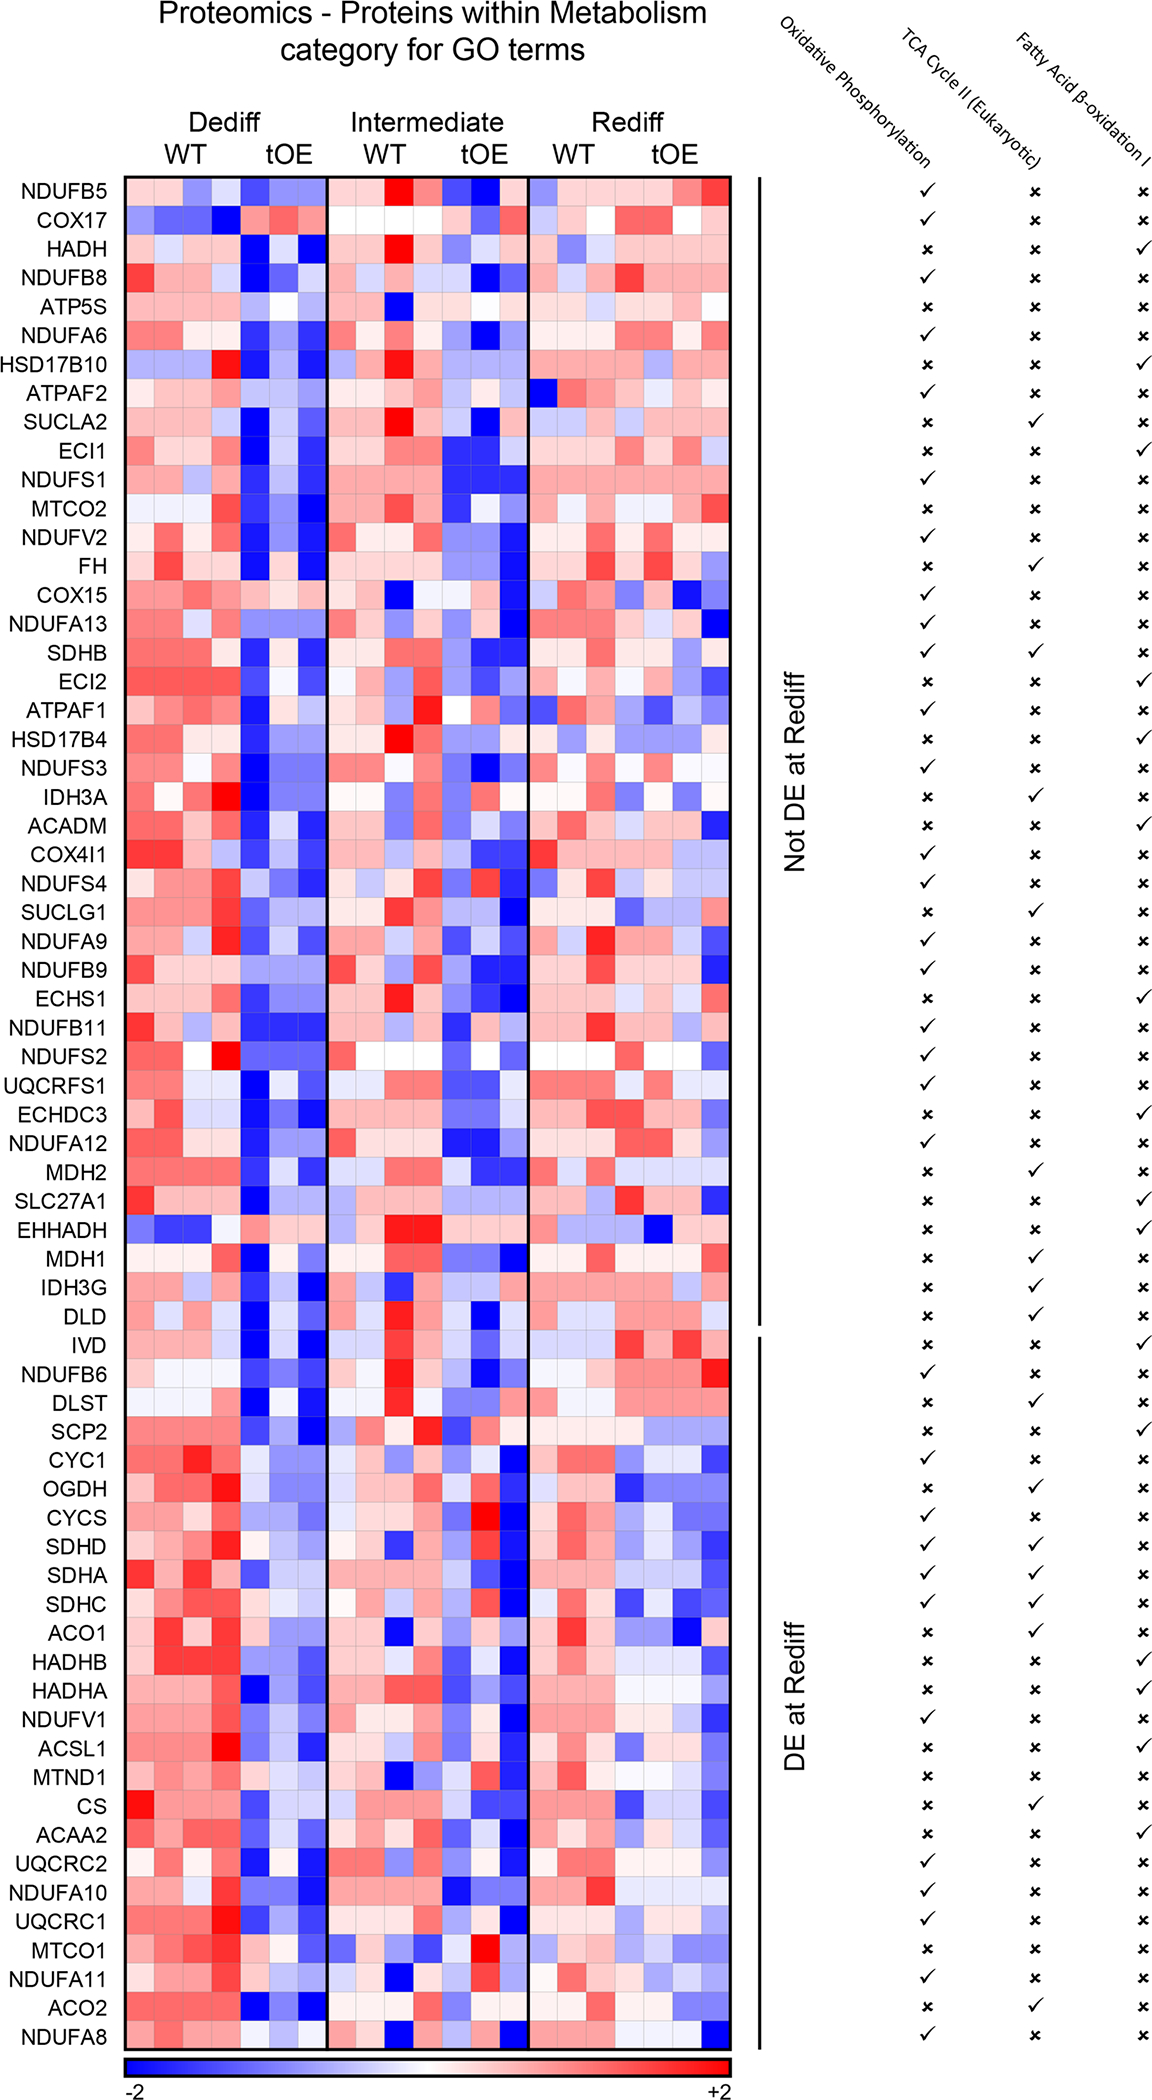
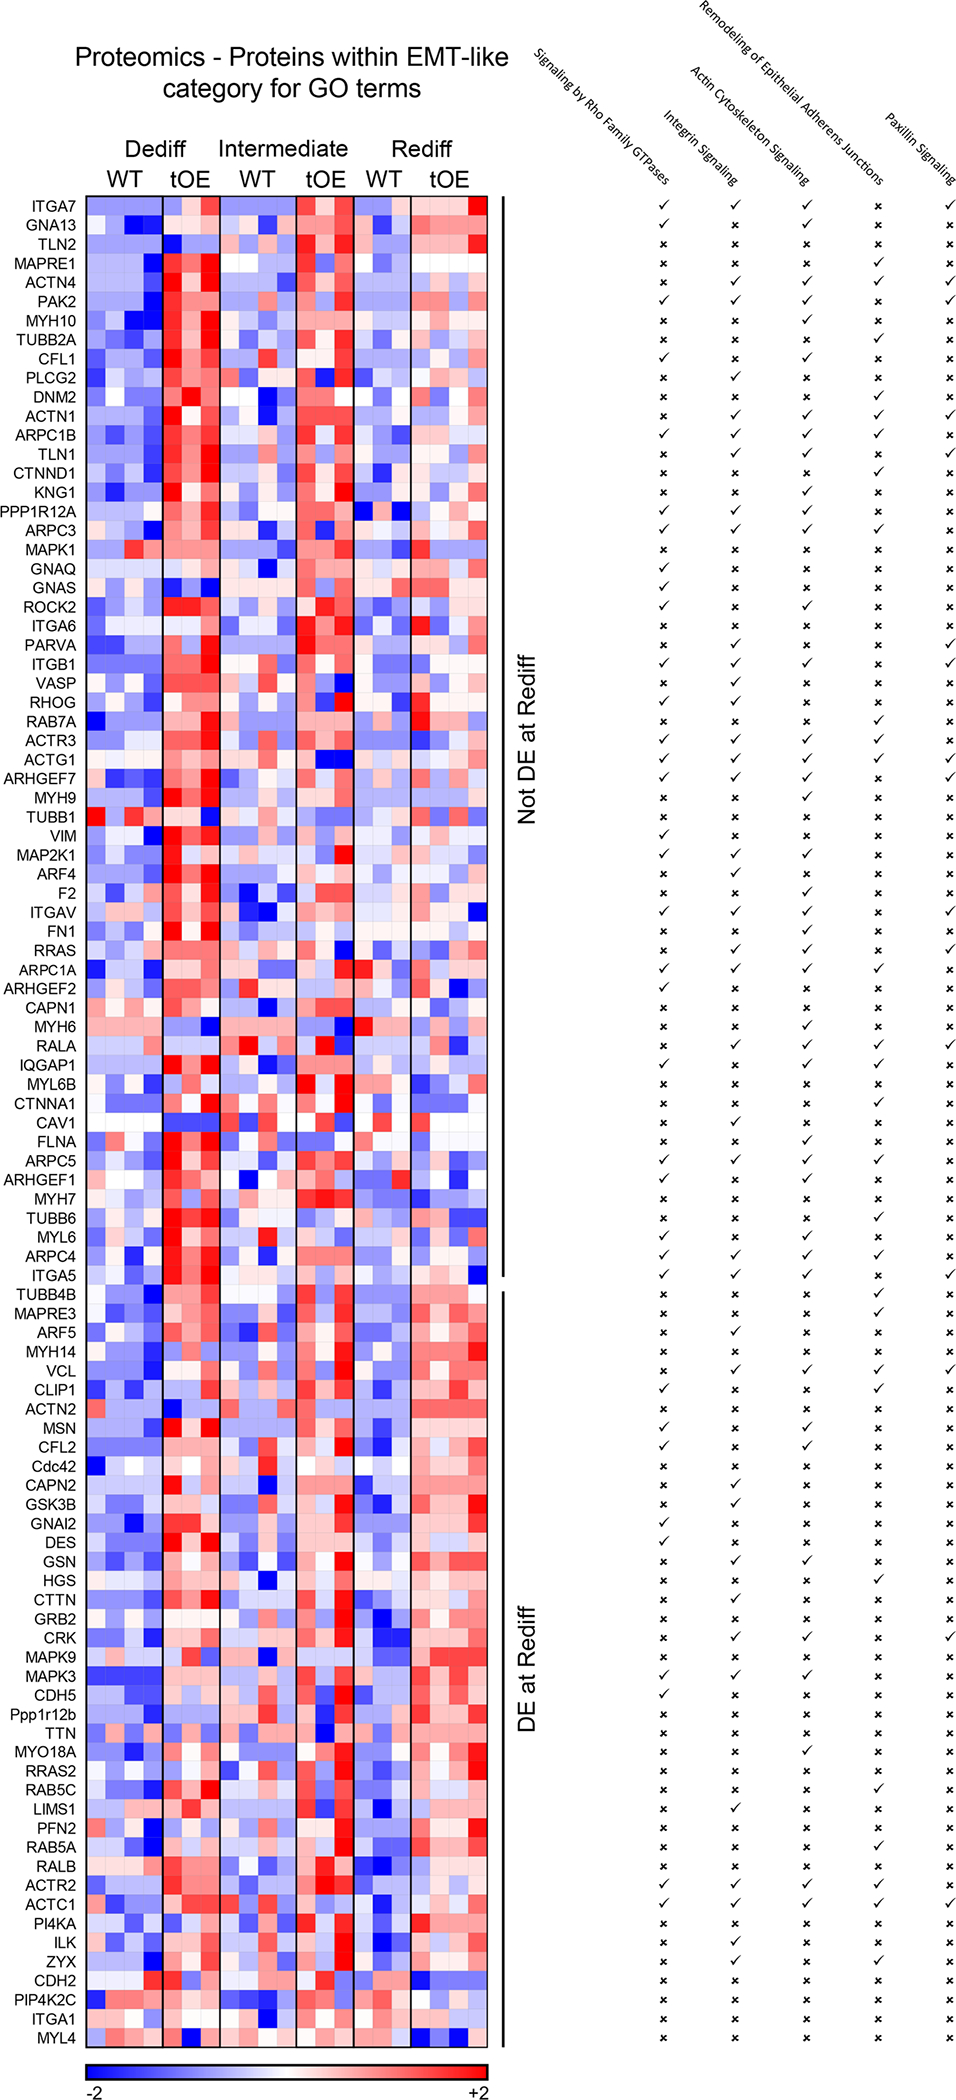
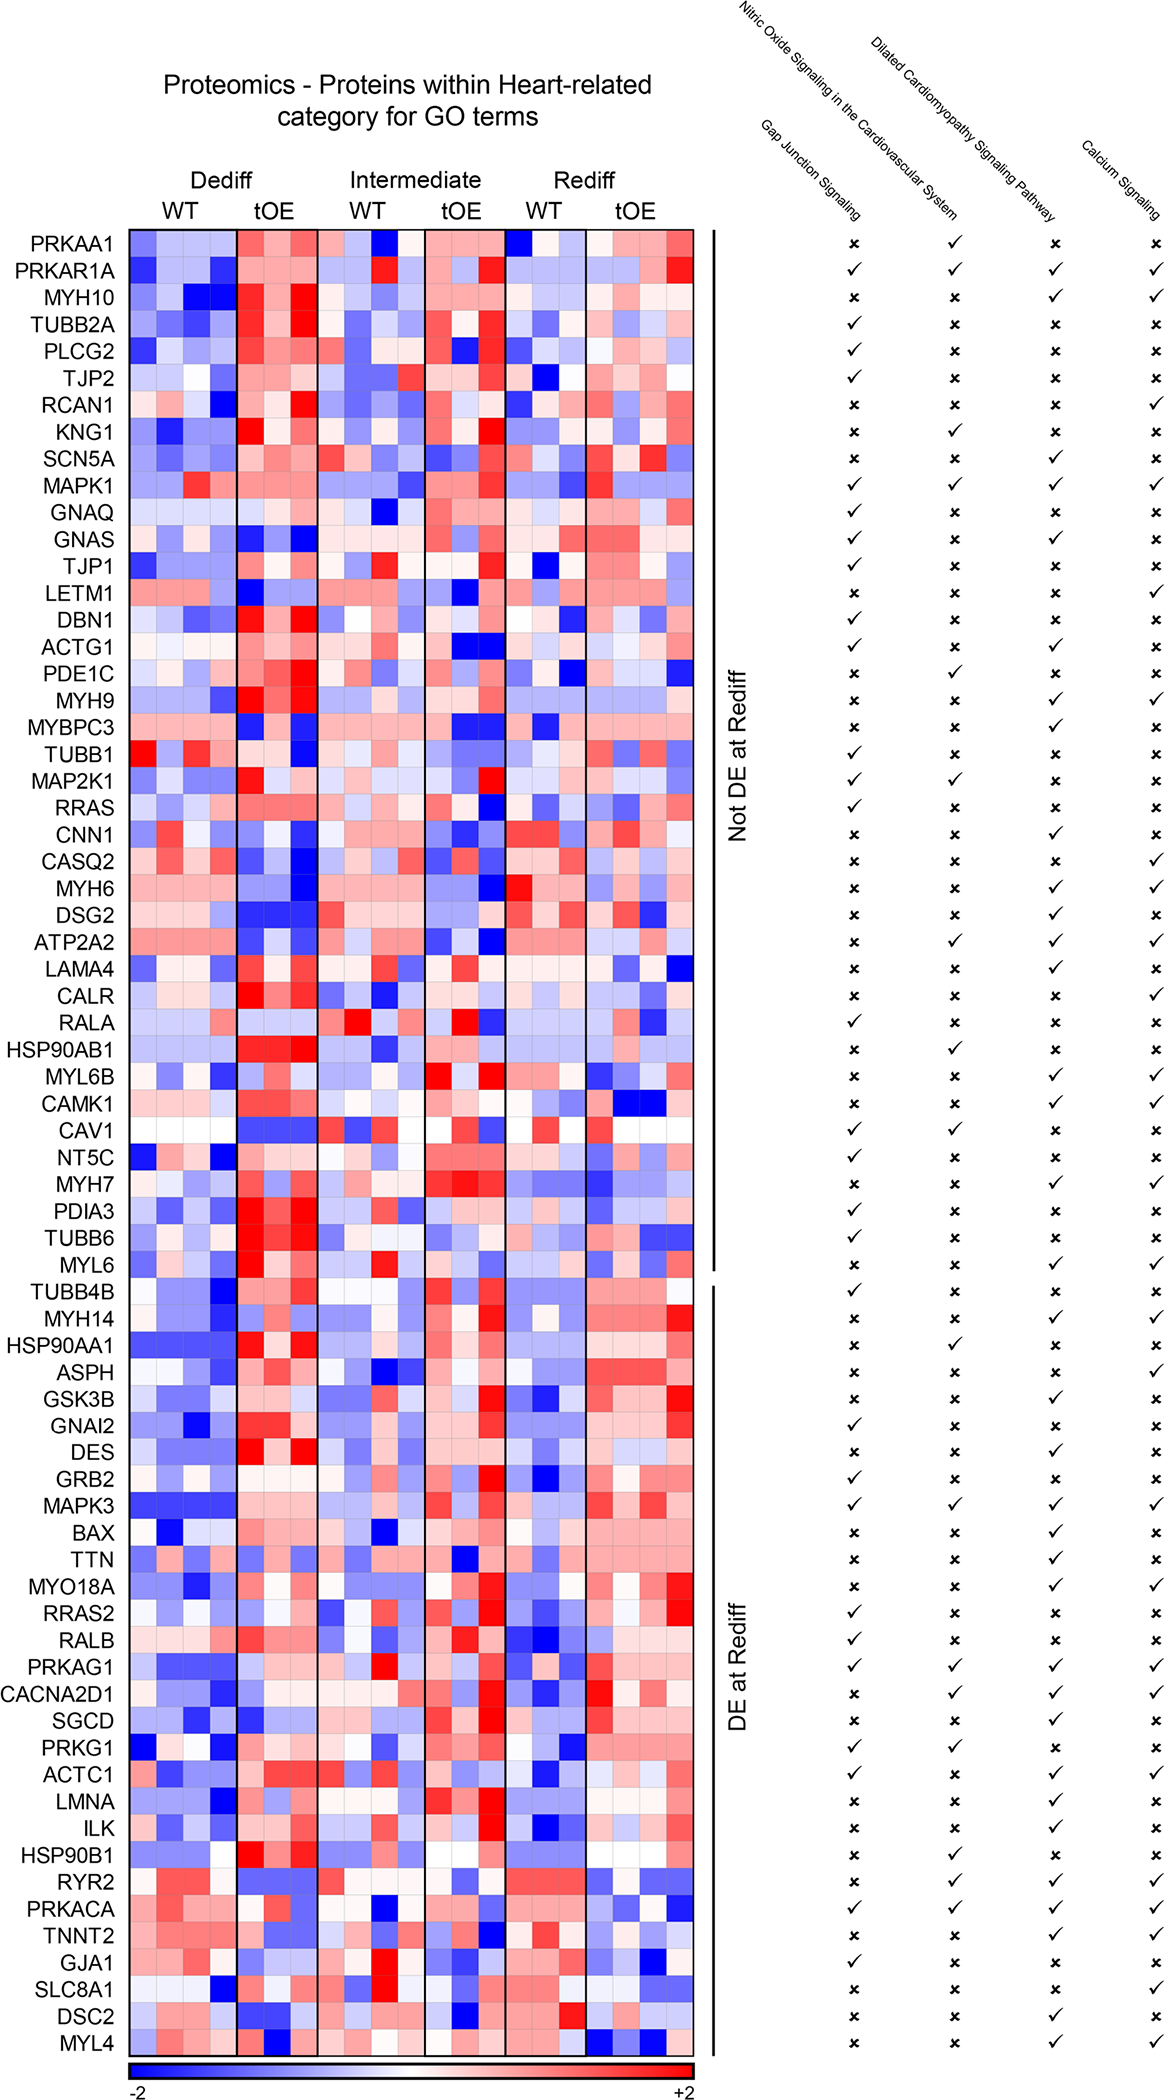
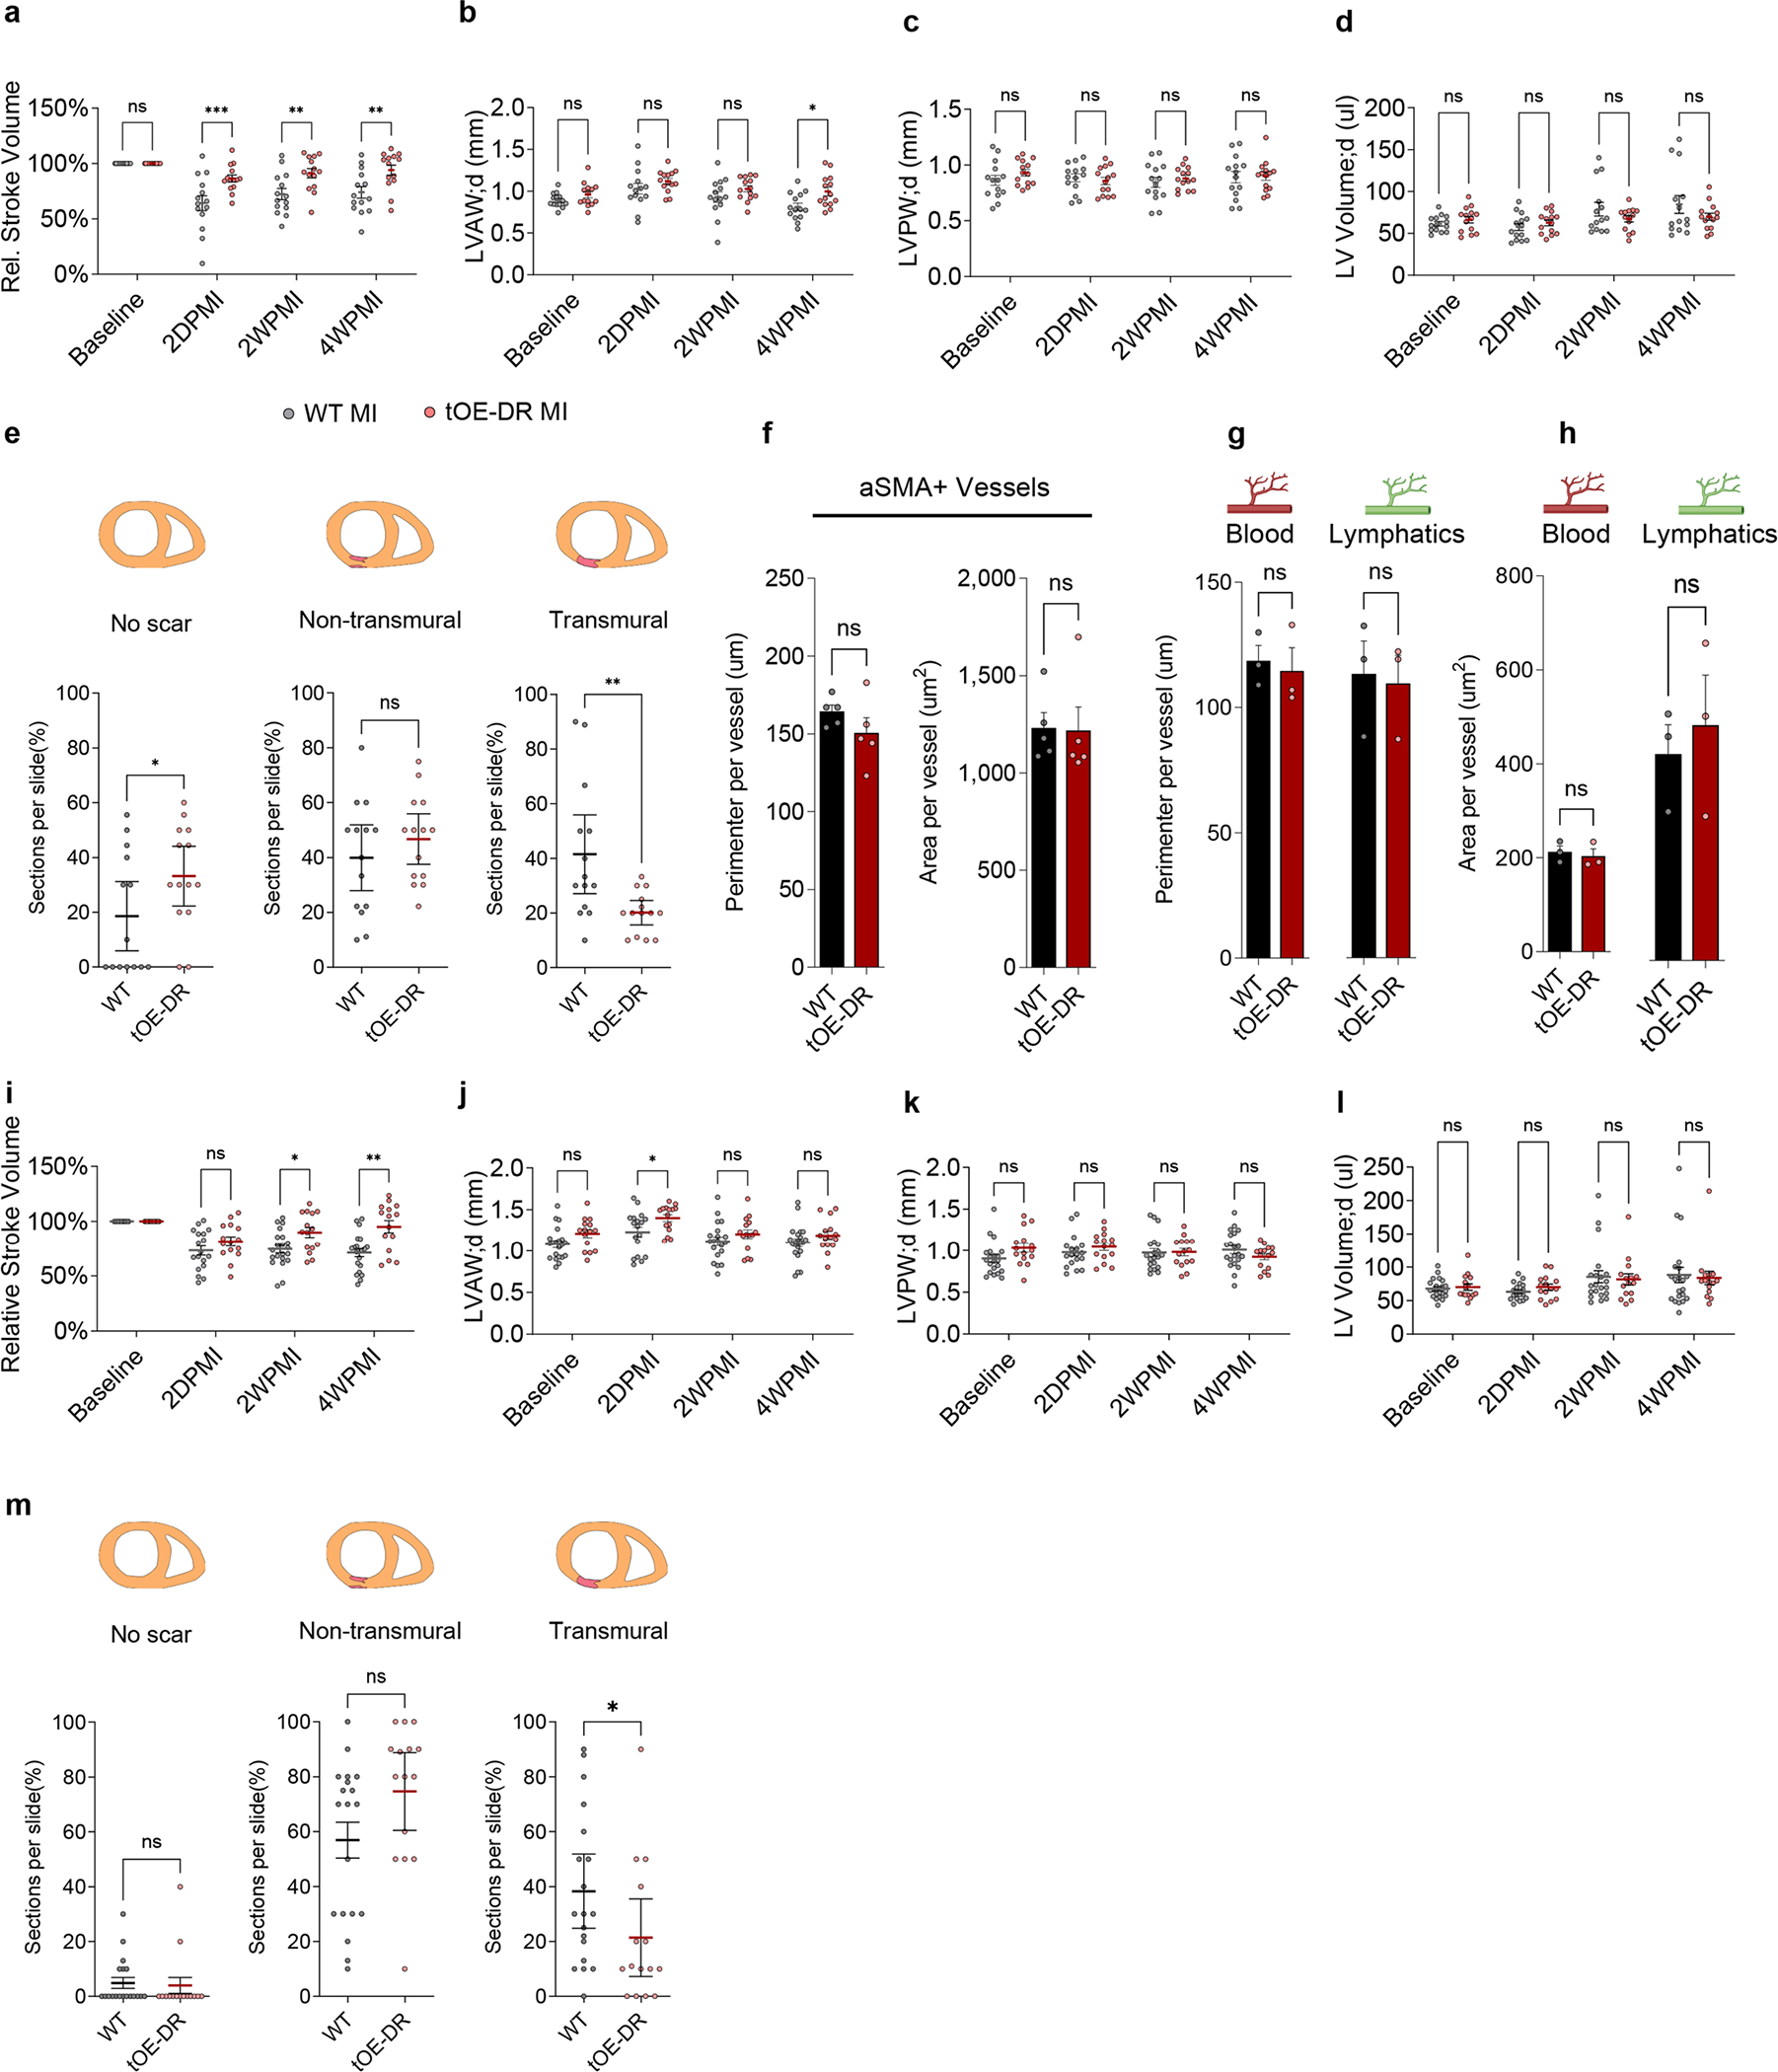
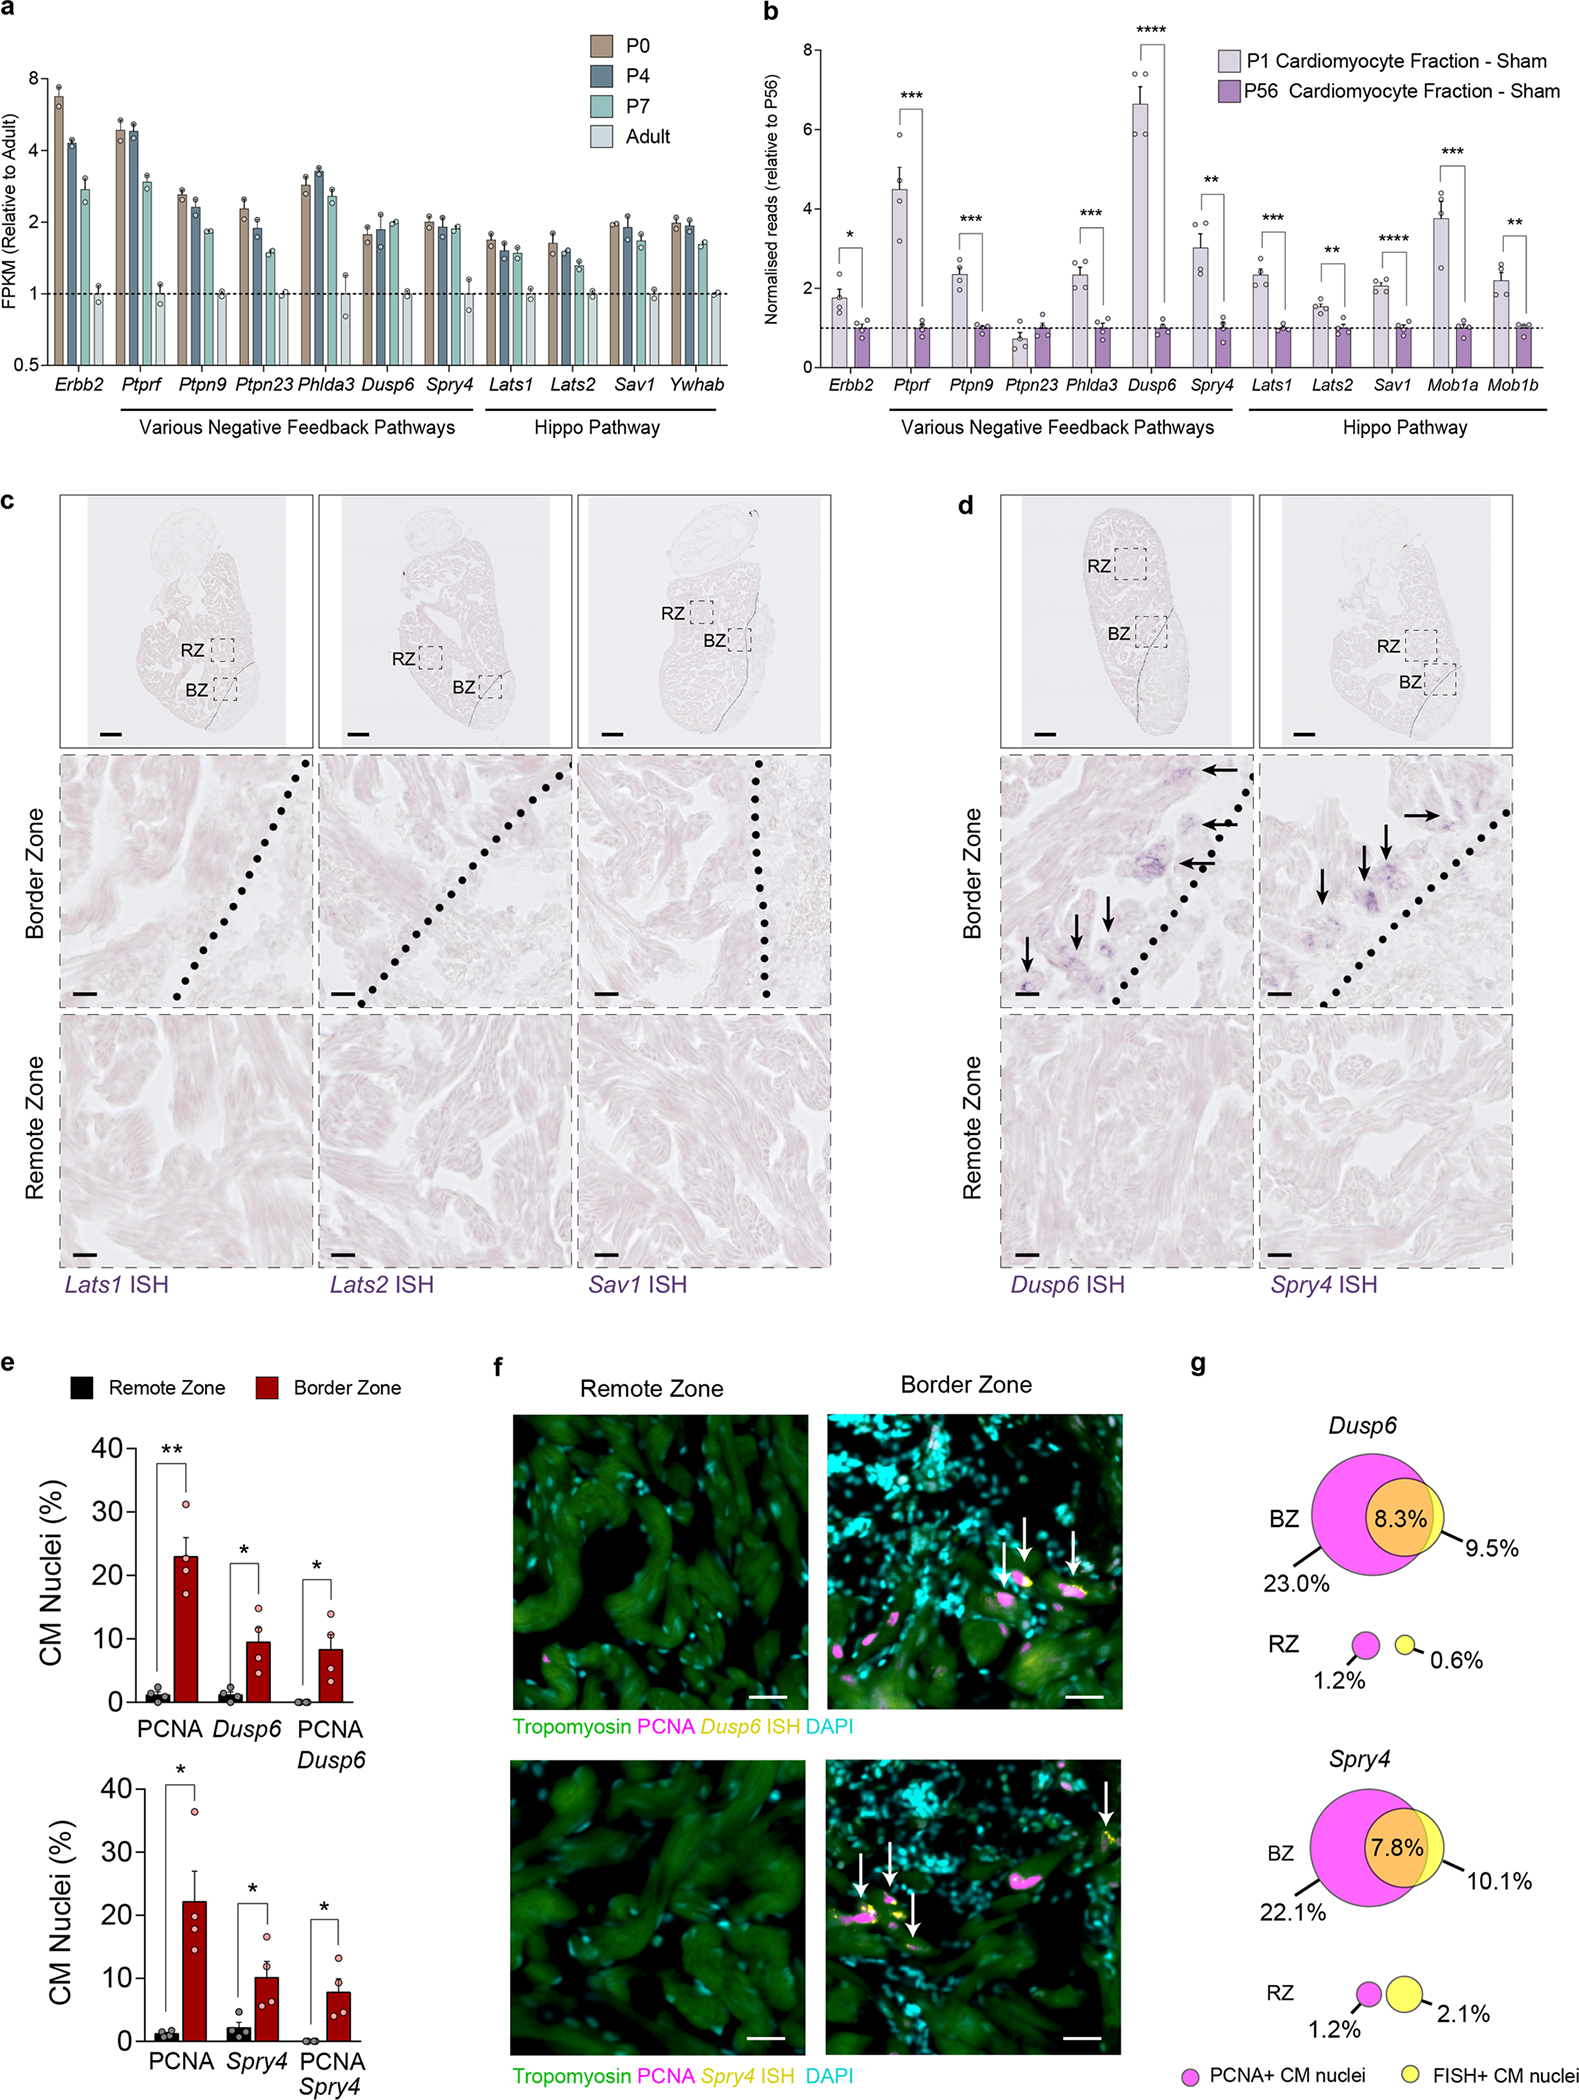
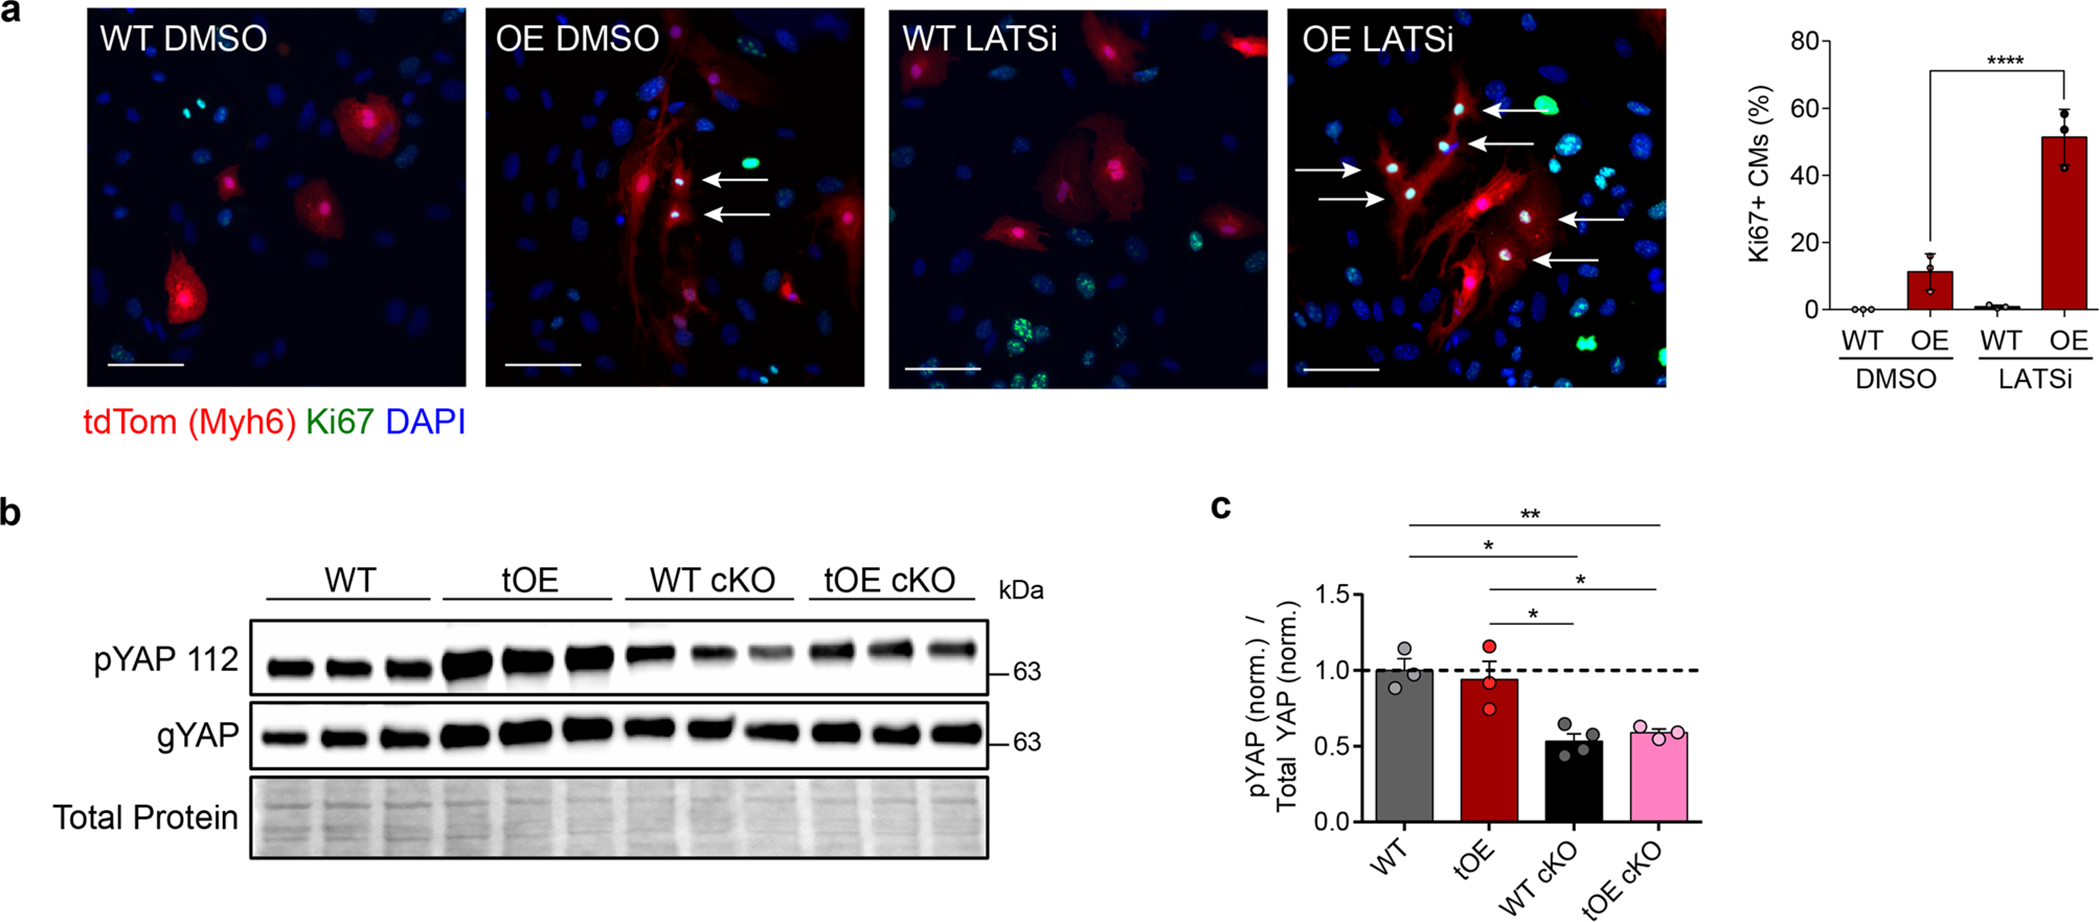
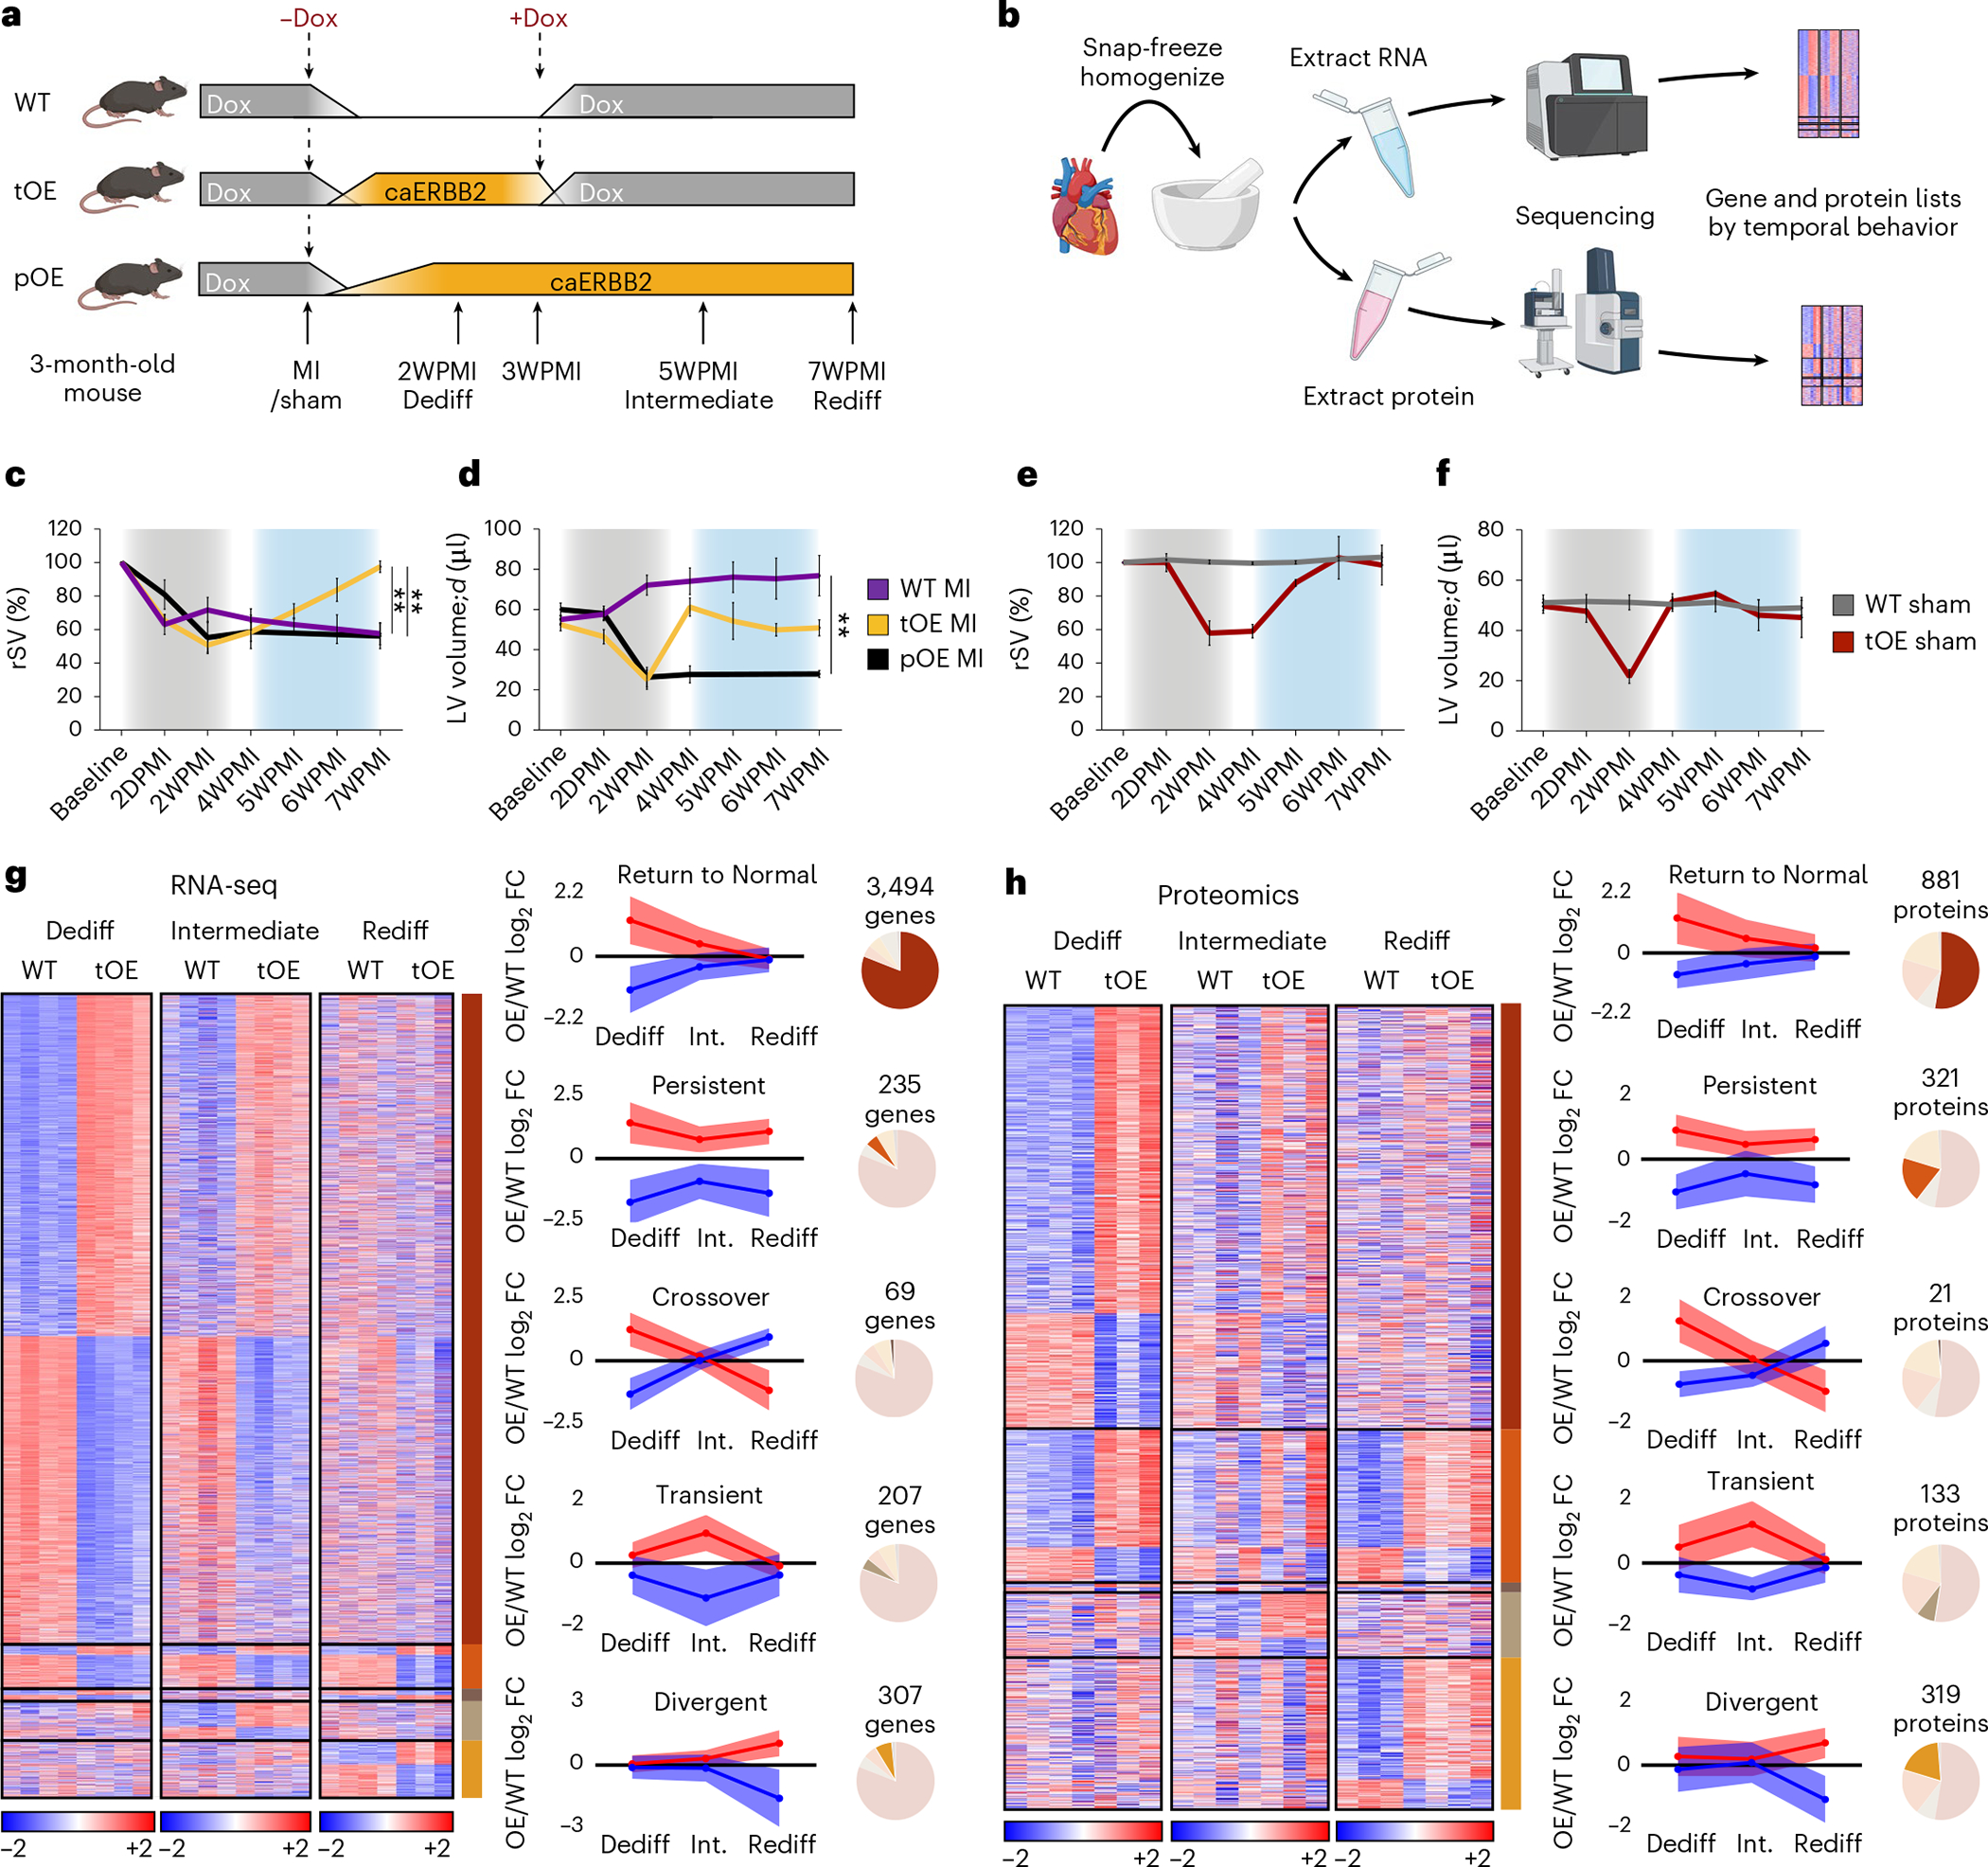
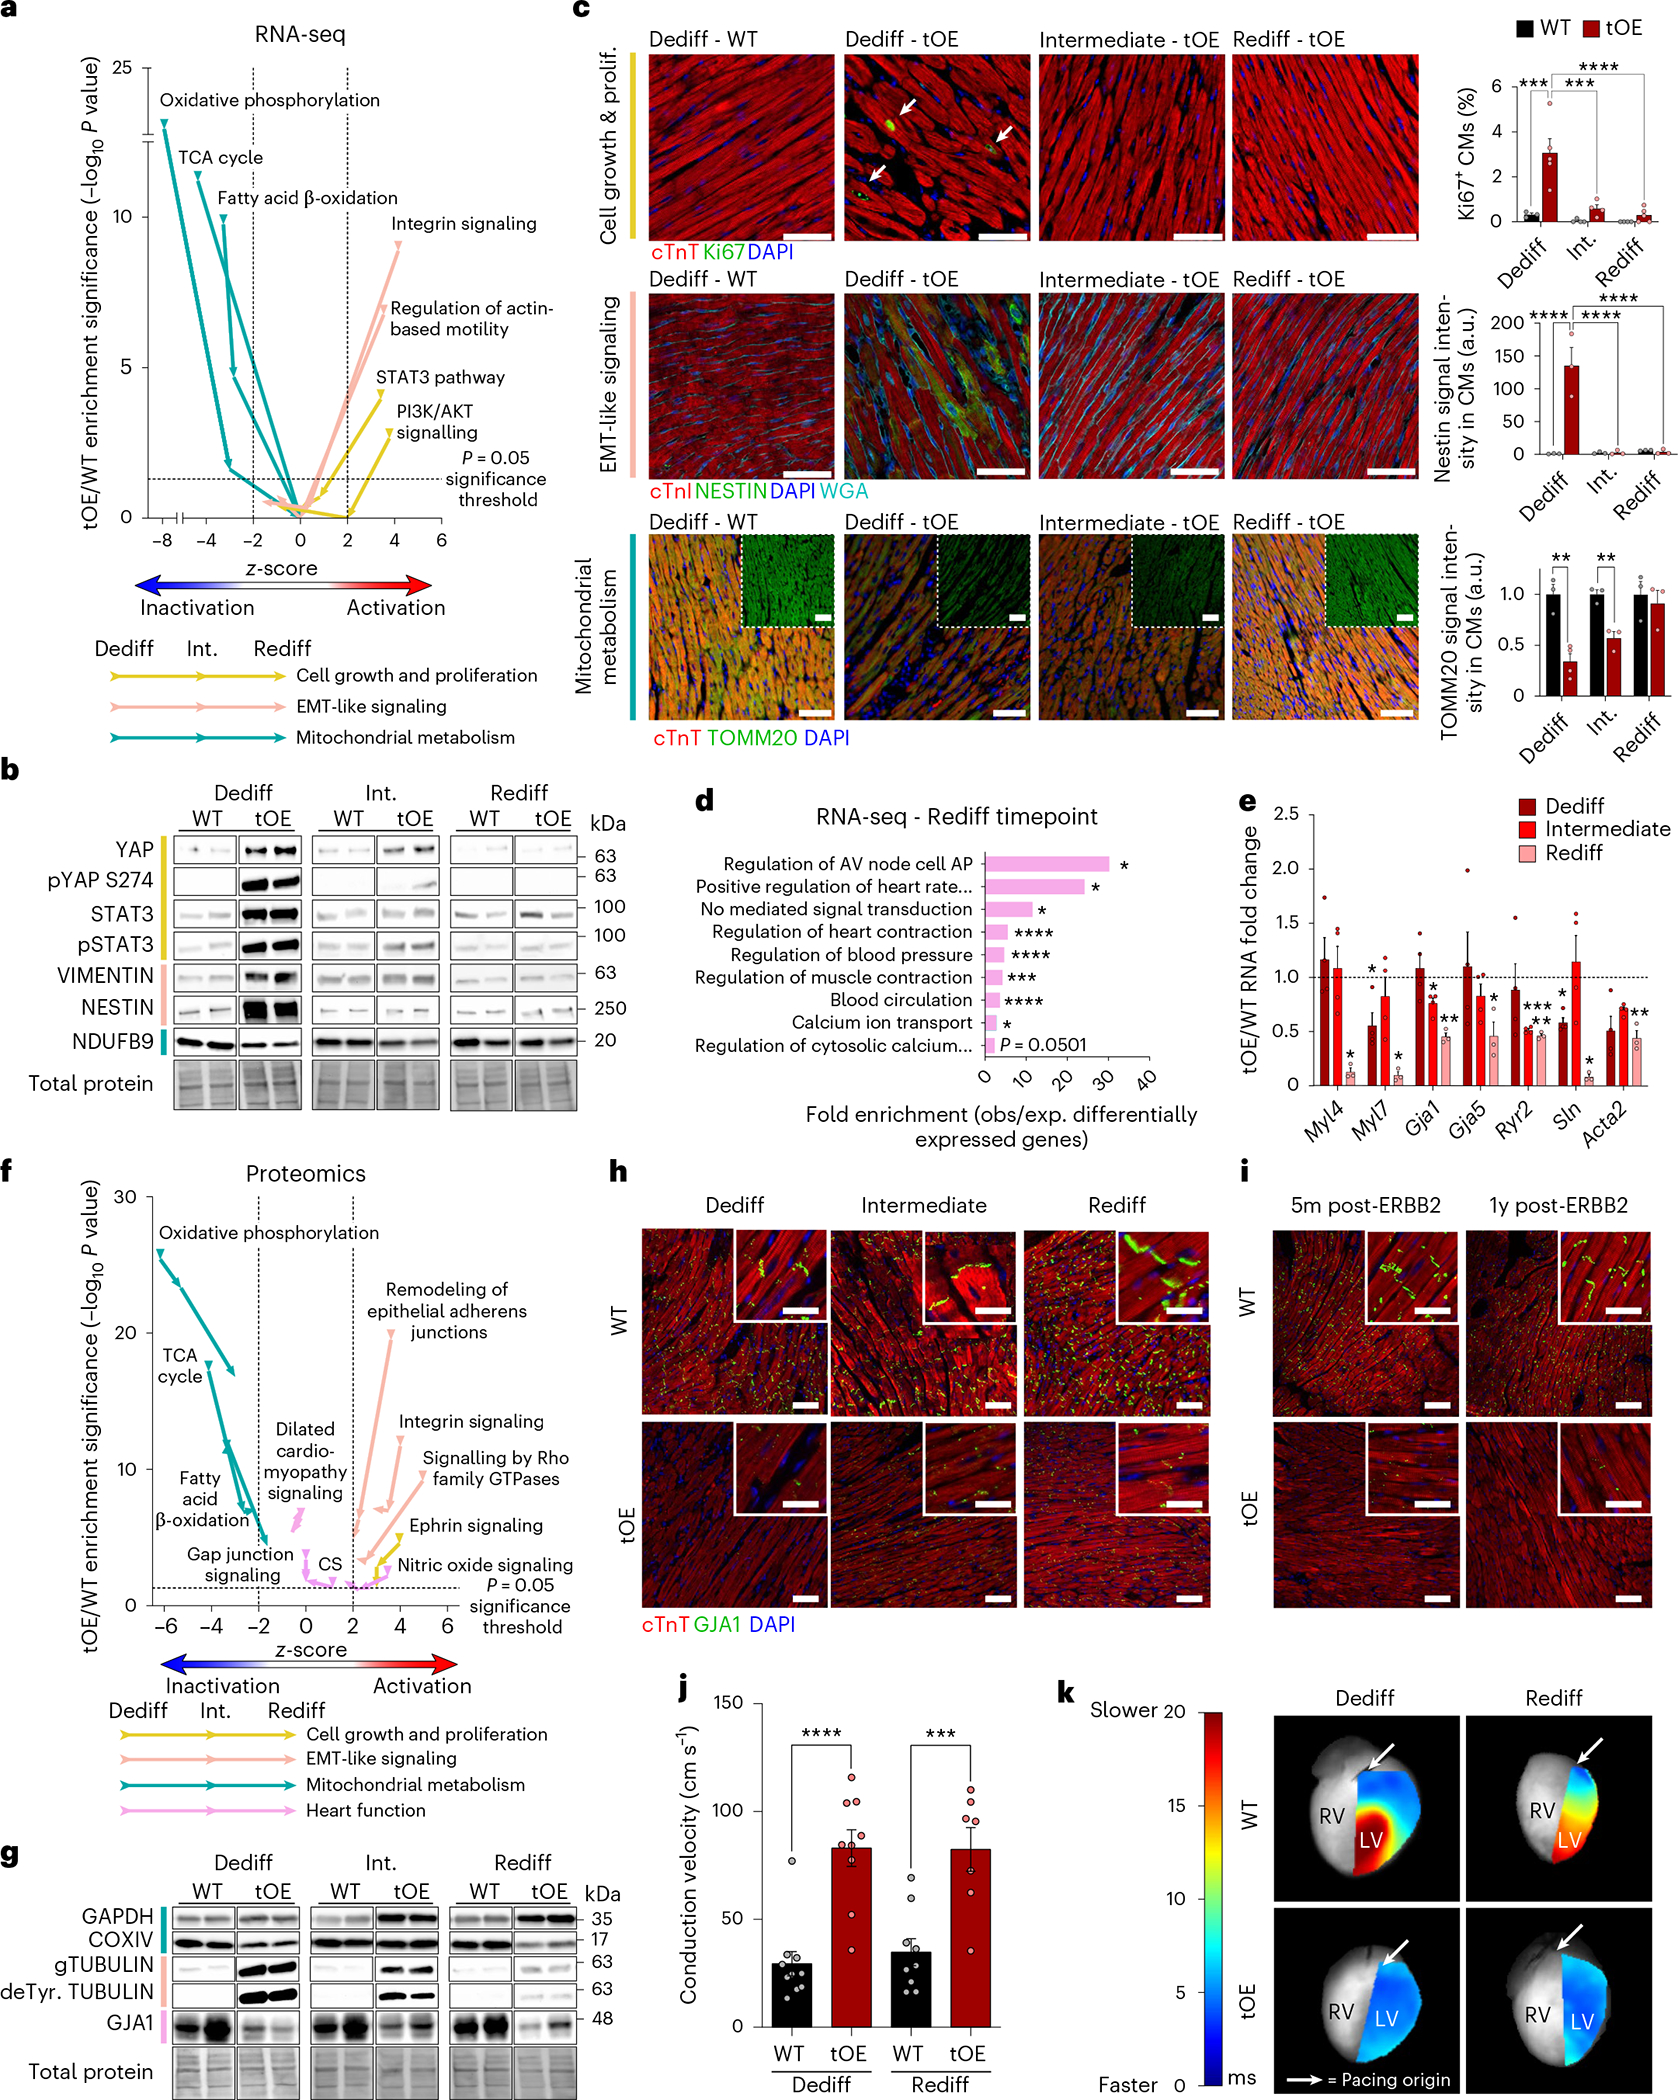
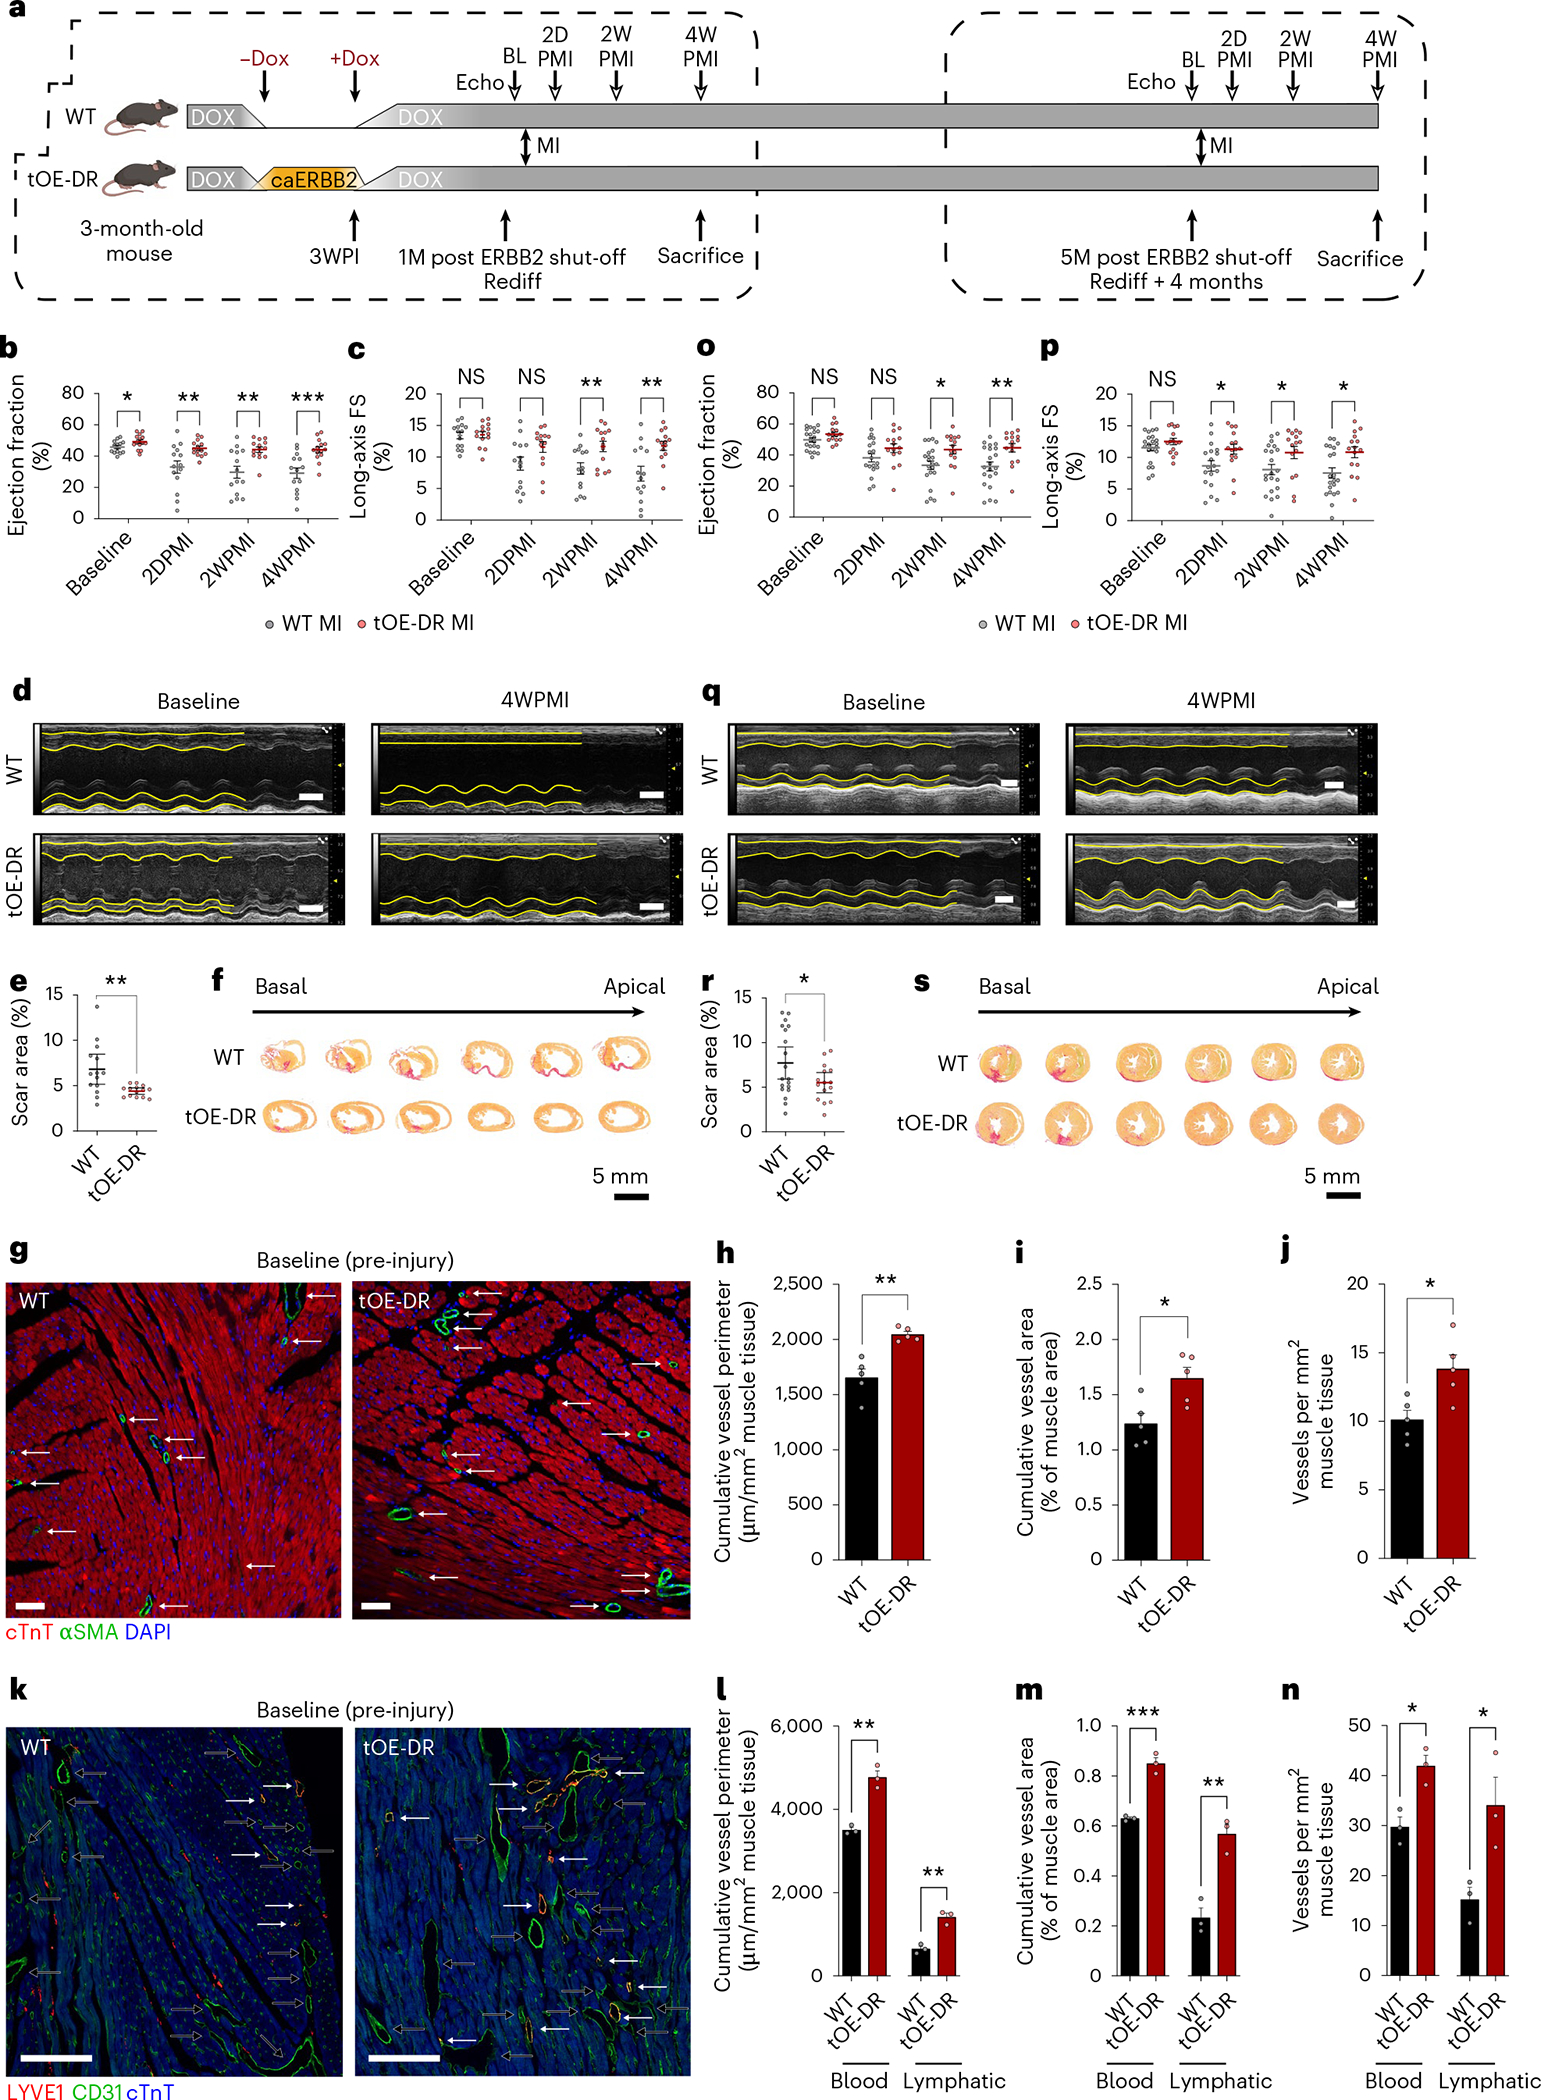
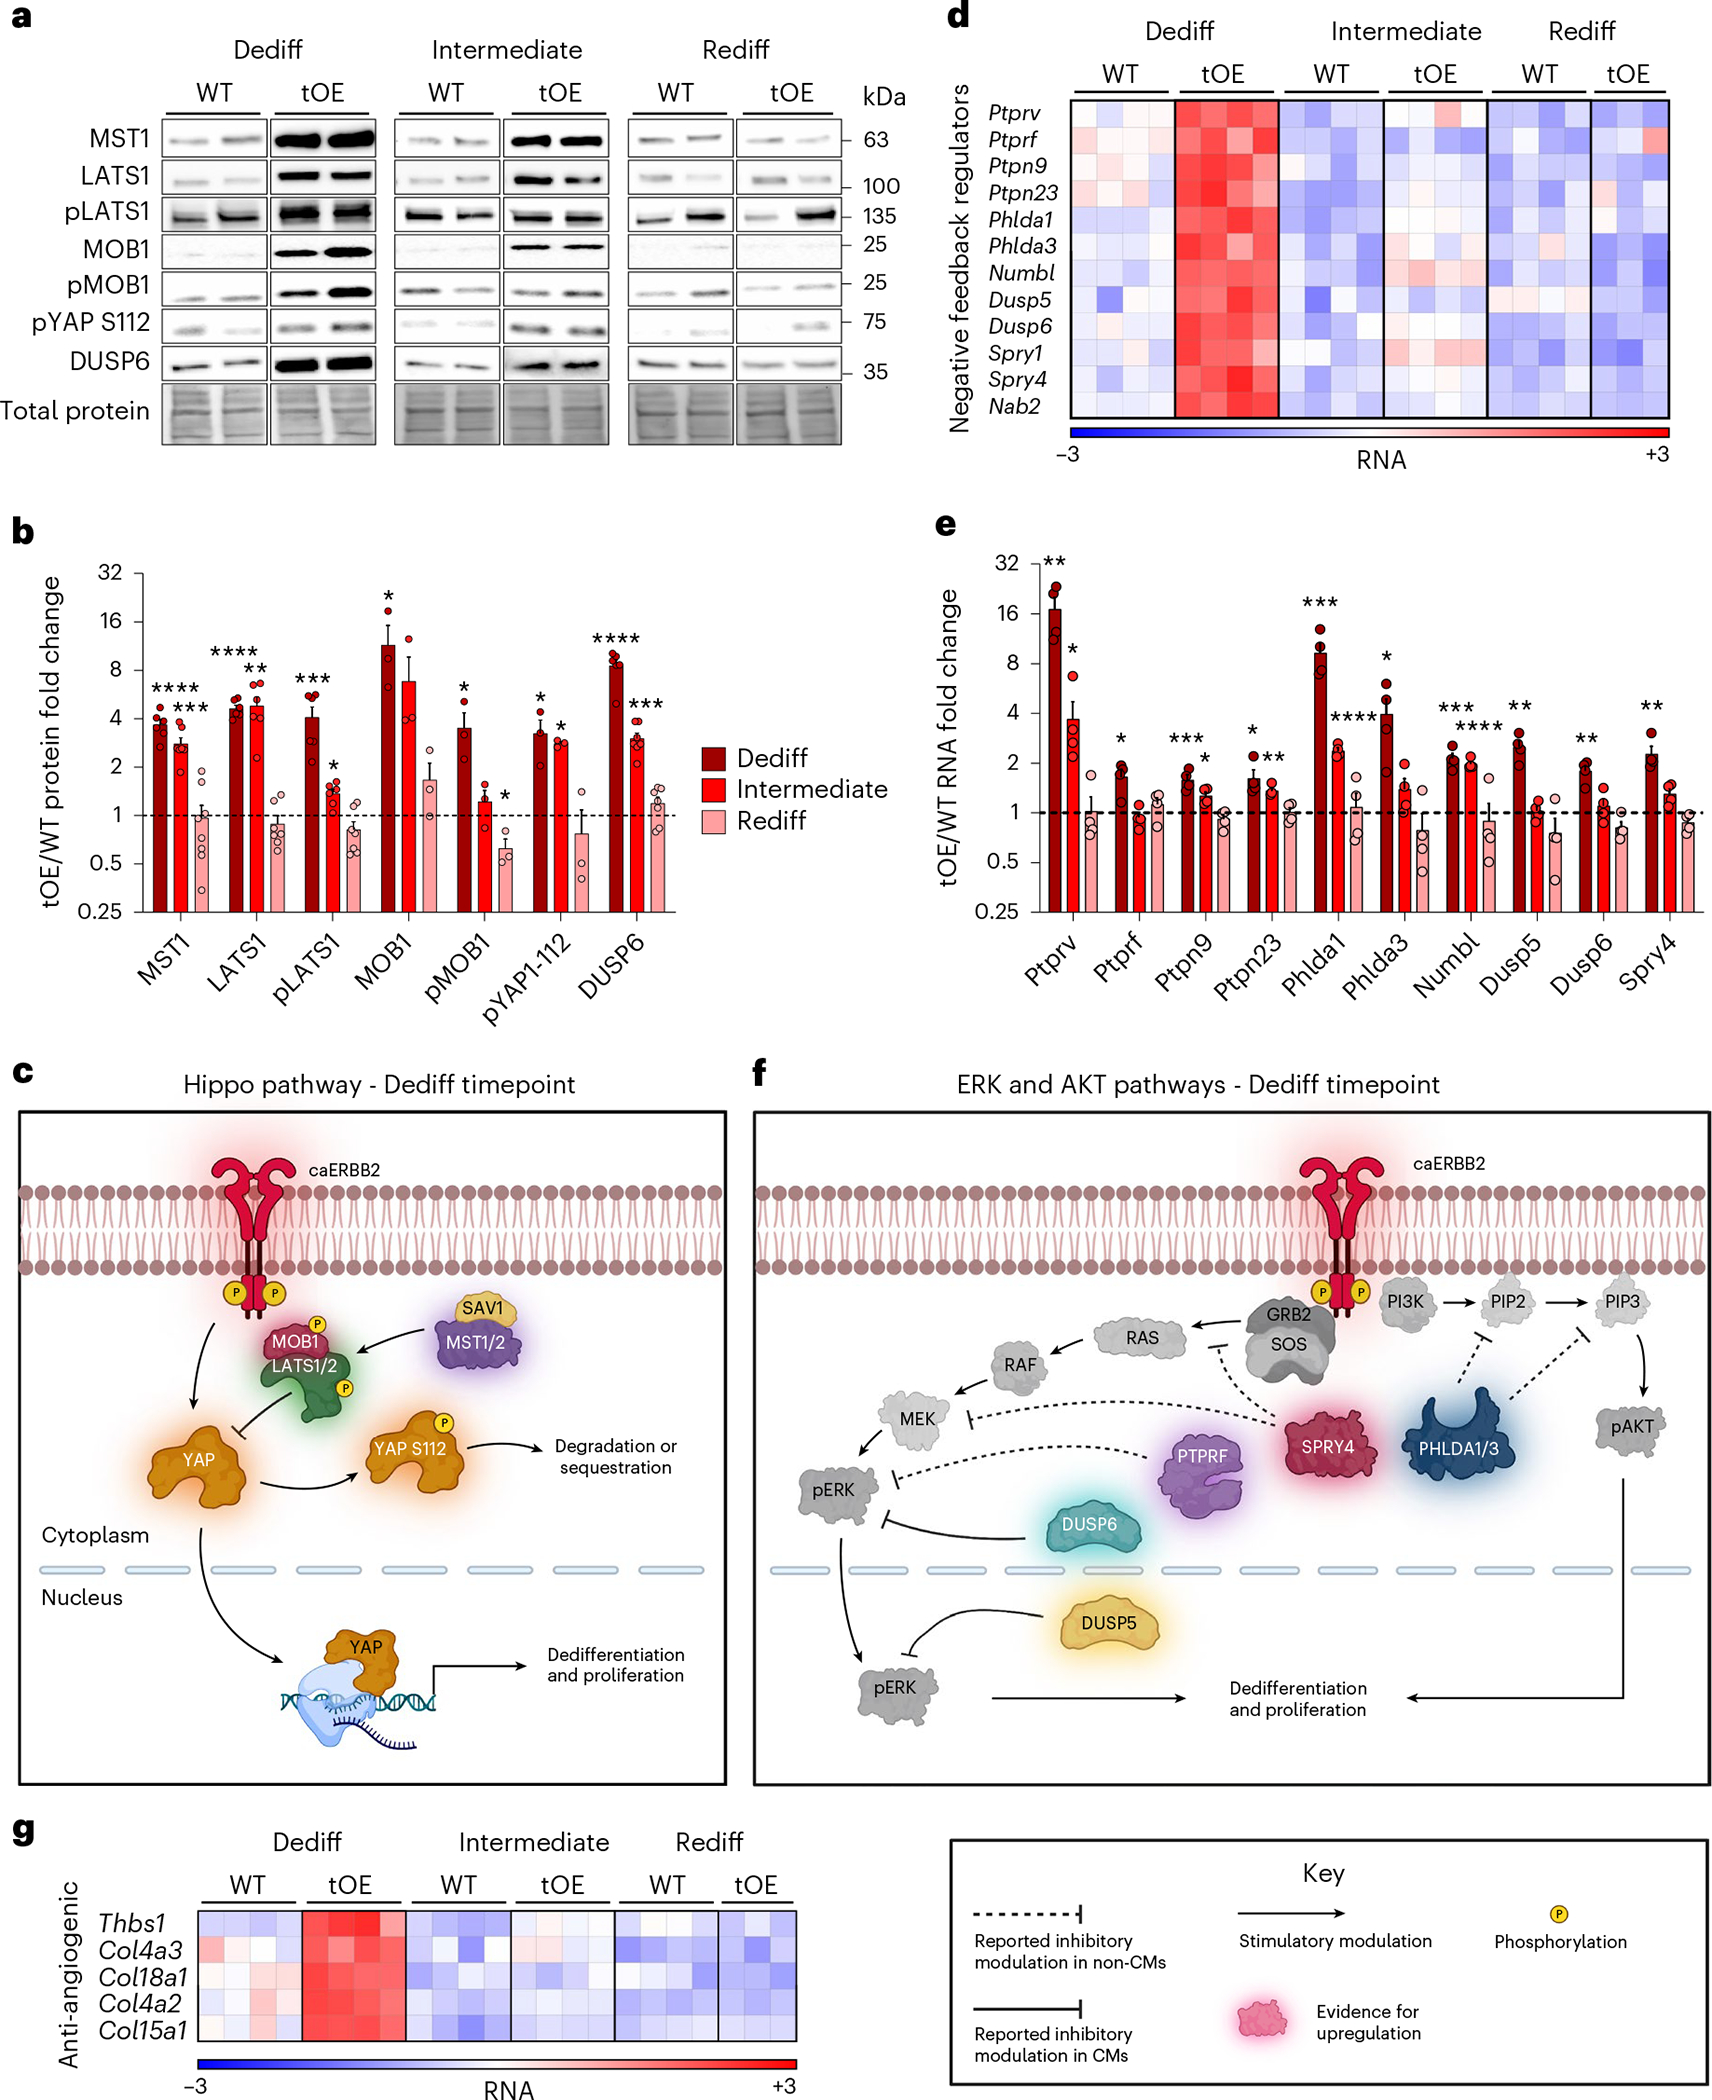
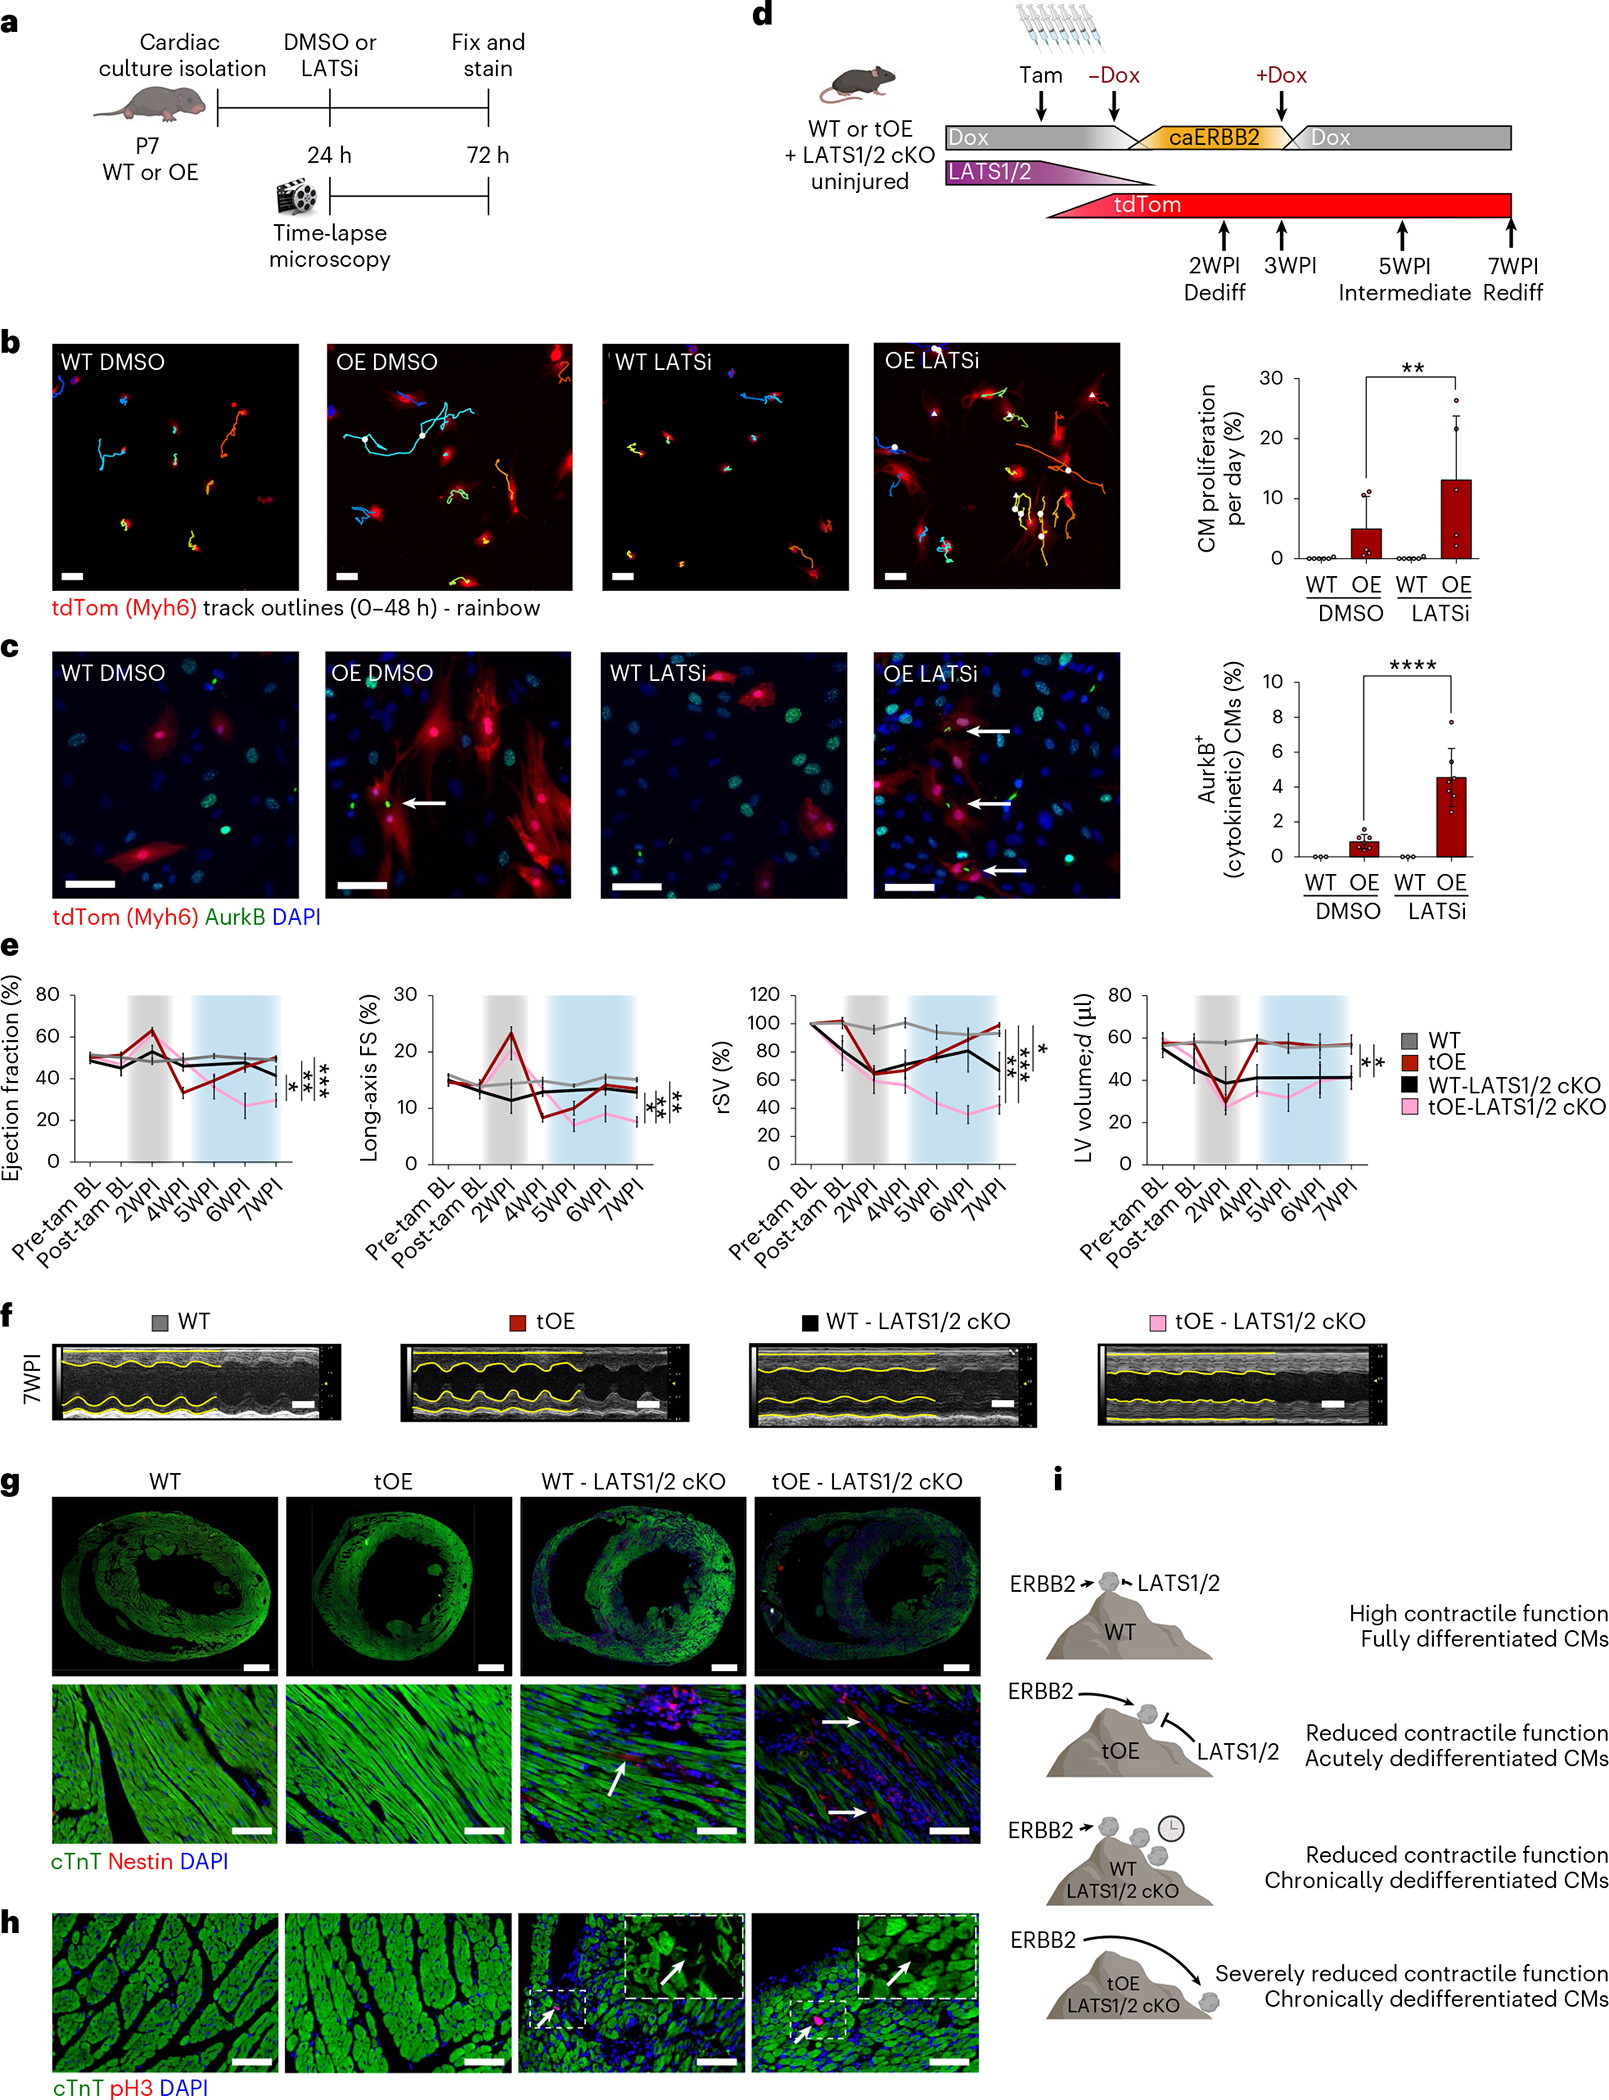
Cardiomyocyte proliferation and dedifferentiation have fueled the field of regenerative cardiology in recent years, whereas the reverse process of redifferentiation remains largely unexplored. Redifferentiation is characterized by the restoration of function lost during dedifferentiation. Previously, we showed that ERBB2-mediated heart regeneration has these two distinct phases: transient dedifferentiation and redifferentiation. Here we survey the temporal transcriptomic and proteomic landscape of dedifferentiation-redifferentiation in adult mouse hearts and reveal that well-characterized dedifferentiation features largely return to normal, although elements of residual dedifferentiation remain, even after the contractile function is restored. These hearts appear rejuvenated and show robust resistance to ischemic injury, even 5 months after redifferentiation initiation. Cardiomyocyte redifferentiation is driven by negative feedback signaling and requires LATS1/2 Hippo pathway activity. Our data reveal the importance of cardiomyocyte redifferentiation in functional restoration during regeneration but also protection against future insult, in what could lead to a potential prophylactic treatment against ischemic heart disease for at-risk patients.


Conflict of interest statement

Competing interests The authors declare no competing interests.

Figures

Extended Data Fig. 1 |
Extended Data Fig. 1 |. Hundreds of genes and proteins show differential expression after redifferentiation.
ah, Left Ventricular Posterior Diastolic Wall thickness (LVPW;d) (a,f), Left Ventricular Anterior Diastolic Wall thickness (LVAW;d) (b,e), Ejection Fraction (c,g), and long-axis Fractional Shortening (d,h) of WT MI, tOE MI, pOE MI, WT Sham and tOE Sham mice, measured by echocardiography. Gray shaded area represents time period of caERBB2 activation (dedifferentiation). Blue shaded area represents the redifferentiation phase. Overall, n = 3 – 8 per group. For (a), WT MI vs pOE MI p = 0.0002, tOE MI vs pOE MI p = 0.0005, for (b), WT MI vs pOE MI p = 0.0018, tOE MI vs pOE MI p = 0.0461, for (c), WT MI vs pOE MI p = <0.0001, tOE MI vs pOE MI p = 0.0161, WT MI vs tOE MI p = 0.0001, for (d), WT MI vs pOE MI p = <0.0001, tOE MI vs pOE MI p = 0.0003, WT MI vs tOE MI p = 0.0005. i, RT-qPCR analysis of Erbb2 from sham WT and tOE adult heart lysates for each time point. All values are normalized to their in-time point average WT value (black dashed line). All groups had minimum n = 3. For WT vs tOE, Dediff p = 0.004606, Intermediate p = 0.016849. j, Western blot quantification of tOE/WT FC of ERBB2 and pERBB2 (Tyr-1248) protein. All values are normalised to their in-time point average WT value (black dashed line). n = 4 – 8 per group. For WT vs tOE for ERBB2, Dediff p = 0.00189, Intermediate p = 0.00551, for pERBB2, Dediff p = 0.00016. k, Representative western blot images of data from (j). l,m, Heatmaps of differentially expressed genes (l) and proteins (m) from MI-injured samples, compiled as described in Fig. 1g,h. n–q, Principal component analysis and dendrograms of sham RNAseq (n,o), and sham proteomics groups (p,q). In all panels numerical data are presented as mean ± SEM; statistical significance was calculated using one-way ANOVA with Sidak’s multiple comparison test at the 7WPMI time point in (ah), two-tailed unpaired Student’s t-test between tOE and WT of each time point in (i,j). *p ≤ 0.05, **p < 0.01, ***p < 0.001, ****p < 0.0001. Uncropped blots for (k) are provided in supplementary source data.
Extended Data Fig. 2 |
Extended Data Fig. 2 |. Dedifferentiated phenotypes are largely reversed in functionally redifferentiated hearts.
a,b, tOE/WT at all timepoints (a) and pOE/WT at Rediff (b) RNA expression fold change of ‘return to normal’ genes, involved in metabolism, proliferation and EMT-like features, determined by RT-qPCR. All values are normalised to their in-time point average WT value (black dashed line). n = 3 – 4 mice per group. c, Western blot quantification for data in Fig. 2b in order to validate the ‘return to normal’ behaviour of proteins involved in proliferation, EMT-like features and metabolism. n = 4 – 7 mice per group. d, Representative immunofluorescence images of isotype controls (WT) for the tOE hearts at Int. and Rediff timepoints shown in Fig. 2c, stained for Ki67, Nestin and Tomm20. Full quantification is provided in Fig. 2c. Scale bars = 50μm for Ki67 and NESTIN, 100μm for TOMM20. e’–f”, Metabolic analysis of cultured P7 WT (n = 3) and OE (n = 5) CMs using an XFe96 Seahorse analyser. OCR (oxygen consumption rate) during the Cell Mito Stress Test (e’) and ECAR (extracellular acidification rate (glycolysis proxy)) during the Glycolysis Stress Test (f’). Maximal respiration/OCR (e”) and Glycolysis (f”). For (e”) WT vs OE p = 0.0320. g, H&E-stained histological sections of WT Dediff and tOE Dediff, Int. and Rediff hearts. Images were acquired in the remote zones of MI injured hearts as a proxy for sham injury. Scale bars = 50μm. n = 3 for each group. h,i, Scatter plot of immune-related (h) and angiogenesis-related (i) GO term z-scores against enrichment significance (log10 p-value) for tOE/WT across all timepoints, based on Ingenuity Canonical Pathway Analysis of RNAseq data using a threshold fold change (FC) ≥ 1.5; adjusted p ≤ 0.05. Arrows on each line indicate the direction of the GO term from Dediff to Int. to Rediff. Z-scores below −2 are predictive of pathway inactivation and above +2 are predictive of pathway activation. Values above the horizontal dashed black line represent statistically significant enrichment. j,k, Heatmaps of differentially expressed genes corresponding to the IPA analysis in (i), (j) and an independently curated list of angiogenesis genes (k), compiled as described in Fig. 1g. l, Western blot quantification for data in Fig. 2g in order to validate the proteins involved in metabolism, cytoskeletal signalling and heart function that remain differentially expressed at Rediff. In all panels numerical data are presented as mean ± SEM statistical significance was calculated using two-tailed unpaired Student’s t-test in (a–c,e”,f”,l) between the in-time point WT and tOE values. *p ≤ 0.05, **p < 0.01, ***p < 0.001, ****p < 0.0001.
Extended Data Fig. 3 |
Extended Data Fig. 3 |. Expanded RNAseq evidence of effects for EMT-like GO terms that ‘return to normal’.
Heatmaps based on log2 transformed normalised counts from Sham RNAseq data of differentially expressed genes that appear within at least one of the listed EMT-like category GO terms (indicated by a tick). Rows represent genes. Columns represent each biological sample. Colour bars represent z-score for each timepoint.
Extended Data Fig. 4 |
Extended Data Fig. 4 |. Expanded RNAseq evidence of effects for mitochondrial metabolism GO terms that ‘return to normal’.
Heatmaps based on log2 transformed normalised counts from Sham RNAseq data of differentially expressed genes that appear within at least one of the listed mitochondrial metabolism GO terms (indicated by a tick). Rows represent genes. Columns represent each biological sample. Colour bars represent z-score for all timepoints.
Extended Data Fig. 5 |
Extended Data Fig. 5 |. Expanded proteomics evidence of effects for mitochondrial metabolism GO terms that partially ‘return to normal’.
Heat maps based on log10 transformed intensity values from Sham proteomics data of differentially expressed proteins that appear within at least one of the listed mitochondrial metabolism GO terms (indicated by a tick). Rows represent proteins. Columns represent each biological sample. Colour bars represent z-score for each row across all timepoints.
Extended Data Fig. 6 |
Extended Data Fig. 6 |. Expanded proteomics evidence of effects for EMT-like category GO terms that partially ‘return to normal’.
Heat maps based on log10 transformed intensity values from Sham proteomics data of differentially expressed proteins that appear within at least one of the listed EMT-like category GO terms (indicated by a tick). Rows represent proteins. Columns represent each biological sample. Colour bars represent z-score for each row across all timepoints.
Extended Data Fig. 7 |
Extended Data Fig. 7 |. Expanded proteomics evidence of effects for heart related category GO terms that partially ‘return to normal’.
Heat maps based on log10 transformed intensity values from Sham proteomics data of differentially expressed proteins that appear within at least one of the listed heart related category GO terms (indicated by a tick). Rows represent proteins. Columns represent each biological sample. Colour bars represent z-score for each row across all timepoints.
Extended Data Fig. 8 |
Extended Data Fig. 8 |. Dedifferentiation-Redifferentiation cycle confers robust protection against ischaemic injury.
a-d, Relative stroke volume (a), Left Ventricular Anterior Diastolic Wall thickness (LVAW;d) (b), Left Ventricular Posterior Diastolic Wall thickness (LVPW;d) (c) and Left ventricular diastolic volume (LV Volume;d) (d) of WT and tOE-DR, measured by echocardiography. n = 14 for each group. For WT vs tOE-DR in (a), 2DPMI p = 0.000369, 2WPMI p = 0.002282, 4WPMI p = 0.00133. For WT vs tOE-DR in (b), 4WPMI p = 0.010216. e, Scar classification quantification for WT and tOE-DR mice. n = 14 for each group. For WT vs tOE-DR, No Scar p = 0.0442, Transmural scar p = 0.0051. f, Average perimeter and area per aSMA+ vessel. n = 5 for each group. g,h, Average perimeter (g) and area (h) per blood and lymphatic vessel, as measured by CD31 and LYVE1 immunofluorescence. n = 3 for each group. i-l, rSV (i), LVAW;d (j), LVPW;d (k) and LV Volume;d (l) of WT and tOE-DR 5 months after ERBB2 shut-off, measured by echocardiography. n = 21 for WT, n = 16 for tOE-DR. For WT vs tOE-DR in (i), 2WPMI p = 0.013785, 4WPMI p = 0.001556, (j), 2DPMI p = 0.021647. m, Scar classification quantification for WT and tOE-DR mice, 5 months after ERBB2 shut-off. n = 19 for WT, n = 15 for tOE-DR. Data are presented as mean ± SEM; statistical significance was calculated using a one-tailed Mann-Whitney test in (e) and (m) for ‘No scar’, a two-tailed Mann-Whitney test in (m) for transmural scar, and a two-tailed unpaired Student’s t-test in (e) for ‘non-transmural’ and ‘transmural’ scar and (m) for ‘non-transmural’ scar counts and (f to h). *p ≤ 0.05, **p < 0.01, ***p < 0.001, ****p < 0.0001
Extended Data Fig. 9 |
Extended Data Fig. 9 |. ERBB2 signalling promotes a multi-faceted negative feedback response.
a, RNAseq FPKM values for negative feedback regulators from ventricular lysate of various ages. Data re-analysed from O’meara et al.. b, RNAseq normalised counts for negative feedback regulators from bulk-RNAseq of purified CMs from sham injured P1 and P56 mice. Data re-analysed from Quaife-Ryan et al.. c,d, In situ hybridisation for Hippo pathway genes Lats1, Lats2 and Sav1 (c) and ERK negative feedback regulators Dusp6 & Spry4 (d) mRNA in 7DPI (days post injury) adult zebrafish hearts. RZ = Remote Zone. BZ = Border Zone. Zones are delineated by the black dotted lines. Middle and bottom panels show higher magnification images of the corresponding dashed black boxes in the top panel. Black arrows highlight the presence of detected mRNA. Scale bar in top panels represent 100 μm, scale bars in middle and bottom panels represent 10 μm. n = 3 for each group. e, Quantification of combined FISH and immunofluorescence staining for PCNA and either Dusp6 (top panel) or Spry4 (bottom panel) positive CM nuclei in RZ and BZ of 7DPI adult zebrafish hearts (n = 4). For Dusp6 Border zone vs Remote zone, PCNA + CMs p = 0.0033, Dusp6+ CMs p = 0.0371, PCNA + /Dusp6+ CMs p = 0.0421. For Spry4 Border zone vs Remote zone, PCNA + CMs p = 0.0241, Dusp6+ CMs p = 0.0240, PCNA + /Dusp6+ CMs p = 0.0369. f, Representative images of remote and border zones for Dusp6 (upper) and Spry4 (lower) stained sections in (e). White arrows indicate doublepositive CM nuclei. Scale bars represent 20μm. g, To-scale Venn diagram for Dusp6 (upper) and Spry4 (lower) positive nuclei overlapping with PCNA positive nuclei between the RZ and BZ. In all graph panels numerical data are presented as mean ± SEM; statistical significance was calculated using a two-tailed unpaired Student’s t-test in (b) between the P1 and P56 values, and in (e) between the corresponding RZ and BZ values. *p ≤ 0.05, **p < 0.01, ***p < 0.001, ****p < 0.0001.
Extended Data Fig. 10 |
Extended Data Fig. 10 |. LATS1/2 negative feedback signalling is required for redifferentiation.
a, Representative immunofluorescence images of Ki67 in LATSi or DMSO treated WT and OE P7 cardiac cultures, with full quantification. All groups had minimum n = 3. Scale bars = 50μm. b,c, Representative western blot of whole-heart lysates for general Yap (gYAP) and pYAP S112 (a target residue of LATS1/2) from WT, tOE, WT LATS1/2 cKO and tOE LATS1/2 cKO mice (b), with quantification, normalised to the average WT value (c). WT n = 3, tOE n = 3, WT cKO n = 4, OE cKO n = 3. In all panels numerical data are presented as mean ± SEM; statistical significance was calculated using a paired two-way ANOVA followed by Sidak’s test in (a) and a one-way ANOVA followed by Tukey’s test in (c). *p ≤ 0.05, **p < 0.01, ***p < 0.001, ****p < 0.0001. Uncropped blots for (b) are provided in supplementary source data.
Fig. 1 |
Fig. 1 |. Hundreds of genes and proteins show differential expression after redifferentiation.
a, Schematic of inducible caERBB2 expression system in adult mouse CMs. ±Dox represents the respective removal and reintroduction of Dox to the diet to temporarily induce caERBB2 expression. b, Workflow of extracting RNA and protein from whole hearts before sequencing. cf, rSV (c,e) and left ventricular diastolic volume (LV volume;d) (d,f) of hearts from the indicated mice measured by echocardiography. For c, WT MI versus tOE MI P = 0.0030, pOE MI versus tOE MI P = 0.0039; for d, WT MI versus pOE MI P = 0.0041. Gray shaded area represents the period of caERBB2 activation (dedifferentiation). Blue shaded area represents the redifferentiation phase. Overall, n = 3–8 per group. Data are represented as mean ± s.e.m. Statistical significance was calculated by one-way ANOVA with Sidak’s multiple comparison test at the 7WPMI (Rediff) timepoint. *P ≤ 0.05, **P < 0.01, ***P < 0.001, ****P < 0.0001. D/WPMI = days/weeks post MI. g,h, Heat maps based on log2-transformed normalized counts for sham RNA-seq and log10-transformed intensity values for sham proteomics. Rows represent genes/proteins. Columns represent each biological sample. Color bars represent z-score for each row within each timepoint. Temporal gene/protein expression pattern was defined as follows: ‘Return to Normal’: differentially expressed (DE) at Dediff, not DE at Rediff; ‘Persistent’: DE at Dediff, DE in the same direction at Rediff; ‘Crossover’: DE at Dediff, DE at Rediff in opposite direction; ‘Transient’: DE only at Intermediate; and ‘Divergent’: not DE at Dediff, DE at Rediff. Graphs show the average tOE/WT log2 fold change for genes (g) and proteins (h) for each group (represented as mean ± s.d. as error band). Genes/proteins that were downregulated when first DE are shown in blue, and those that were upregulated when first DE are shown in red. Pie charts show the relative proportion of genes/proteins in each temporal group (out of the total number of DE genes/proteins). FC, fold change.
Fig. 2 |
Fig. 2 |. Dedifferentiated phenotypes are largely reversed in functionally redifferentiated hearts.
a, Scatter plot of GO term z-score against enrichment significance (log10 P value) for tOE/WT across all timepoints, based on Ingenuity Pathway Analysis of RNA-seq data using a threshold FC ≥ 1.5, adjusted P ≤ 0.05. Arrows on each line indicate the temporal direction of the GO term from Dediff to Rediff. z-scores below −2 are predictive of pathway inactivation and above +2 are predictive of pathway activation. Values above the horizontal dashed black line represent statistically significant enrichment. b, Representative western blot of ‘Return to Normal’ proteins from WT and tOE adult heart lysates. n = 4–7 per group. STAT3 samples were normalized based on total protein from a gel run in parallel. c, Representative immunofluorescence images with full quantification. Images were acquired in the remote zones of MI-injured hearts as a proxy for sham injury. White arrows highlight Ki67+ CMs. For Ki67+ CM quantification, Dediff: WT n = 1,922 (CMs) from 14 images across three hearts, OE n = 2,964 from 34 images across five hearts; Intermediate: WT n = 2,165 from 19 images across four hearts, OE n = 2,155 from 20 images across four hearts; Rediff: WT n = 2,241 from 19 images across four hearts, OE n = 2,953 from 29 images across five hearts. For NESTIN fluorescence intensity within CMs, Dediff: WT n = 3 (hearts) from 22 fields, OE n = 3 from 27 fields; Intermediate: WT n = 3 from 32 fields, OE n = 3 from 34 fields; Rediff: WT n = 3 from 32 fields, OE n = 3 from 26 fields. For TOMM20 fluorescence intensity within CMs, Dediff: WT n = 3 (hearts) from 24 fields, OE n = 4 from 63 fields; Intermediate: WT n = 3 from 18 fields, OE n = 3 from 27 fields; Rediff: WT n = 3 from 22 fields, OE n = 3 from 27 fields. All images from each biological repeat were taken from at least three sections. Scale bars, 50 μm for Ki67 and NESTIN, 100 μm for TOMM20. d, PANTHER overrepresentation results for tOE/WT differentially expressed (DE) genes at Rediff. e, RT–qPCR analysis of heart-function-related genes that are DE at Rediff from WT and tOE adult heart lysates for each timepoint. n = 3–4 per group. Each data point is normalized to the average WT value of its corresponding timepoint. f, Equivalent scatter plot to a, based on proteomic data, using a threshold FC ≥ 1.1, P ≤ 0.05. CS, calcium signaling. g, Representative western blot for WT and tOE adult heart lysates at each timepoint for proteins that were DE at Rediff. n = 3–8 per group. h,i, Representative immunofluorescence images of GJA1 in adult WT and tOE hearts (h) plus additional timepoints of 5 months and 1 year after ERBB2 shut-off (i), n = 3 per group. Main scale bar, 100 μm; inset, 10 μm. j, Conduction velocity across the left ventricle of Langendorff perfused hearts, paced from the base every 200 ms. n = 7–10 per group. Dediff WT versus tOE P < 0.0001, Rediff WT versus tOE P = 0.000986. k, Representative heat maps of conduction velocity. Each pixel is colored according to the amount of time taken (ms) for the action potential (originating at the pacing electrode) to reach it, overlaid onto a grayscale image of the heart. LV, left ventricle; RV, right ventricle. In all panels, numerical data are presented as mean ± s.e.m. Statistical significance was calculated using a right-tailed Fisher’s exact test with Benjamini–Hochberg false discovery rate correction for multiple testing in a, d and f; two-way ANOVA followed by Tukey’s test in c for Ki67 and NESTIN and in j; two-tailed unpaired Student’s t-test in c for TOMM20 and e for WT to tOE comparison within each timepoint. *P ≤ 0.05, **P < 0.01, ***P < 0.001, ****P < 0.0001. Uncropped blots for b and g are provided in Supplementary Source Data. 1yr, 1 year; 5m, 5 months; a.u., arbitrary units.
Fig. 3 |
Fig. 3 |. DR cycle confers robust protection against ischemic injury.
a, Schematic of experimental layout. MIs performed on WT and tOE-DR mice at the Rediff timepoint and Rediff + 4 months timepoint. 1M, 1 month; 2D, 2 days; 2W, 2 weeks; 4W, 4 weeks; 5M, 5 months; BL, baseline; PI, post induction (of caERBB2). White arrowheads represent timepoints for echocardiography. b,c, Ejection fraction (b) and long-axis FS (c) of WT and tOE-DR mice, measured by echocardiography. n = 14 mice for each group. For WT versus tOE-DR in b, baseline P = 0.044046, 2DPMI P = 0.00776, 2WPMI P = 0.001946, 4WPMI P = 0.000643. For WT versus tOE-DR in c, baseline P = 0.875220, 2DPMI P = 0.06279, 2WPMI P = 0.008703, 4WPMI P = 0.003645. d, Representative M-mode images. Yellow lines trace wall contractility. Top wall: anterior; bottom wall: posterior. Scale bars, 2 mm. e,f, Scar area quantification (e) and sequential Sirius Red-stained sections (f) from representative WT and tOE-DR hearts at 4WPMI. n = 14 mice for each group. For WT versus tOE-DR in e, P = 0.0050. gj, Representative ɑSMA-stained sections highlighting vessel density and size (g), scale bars, 100 μm, cumulative vessel perimeter (h) and area (i) and vessel density (j) for WT (27.5 mm2 tissue quantified across n = 5 mice) and tOE-DR (29.3 mm2 tissue quantified across n = 5 mice). kn, Representative CD31- and LYVE1-stained sections highlighting density and size, of blood (black arrows) and lymphatic vessels (white arrows) (k), scale bars, 100 μm, cumulative vessel perimeter (l) and area (m) and vessel density (n) for WT (blood vessels = 8.4 mm2 and lymphatic vessels = 47.0 mm2 tissue quantified across n = 3 mice) and tOE-DR (blood vessels = 10.6 mm2 and lymphatic vessels = 47.2 mm2 tissue quantified across n = 3 mice). o,p, Ejection fraction (o) and long-axis FS (p) of WT and tOE-DR mice 5 months after ERBB2 shut-off, measured by echocardiography. n = 21 mice for WT, n = 16 mice for tOE-DR. For WT versus tOE-DR in o, baseline P = 0.083128, 2DPMI P = 0.12091, 2WPMI P = 0.017416, 4WPMI P = 0.006137. For WT versus tOE-DR in p, baseline P = 0.191669, 2DPMI P = 0.029568, 2WPMI P = 0.040849, 4WPMI P = 0.010612. q, Representative M-mode images. Scale bars, 2 mm. r,s, Scar area quantification (r) and sequential Sirius Red sections (s) from representative WT and tOE-DR (5 months after ERBB2 shut-off) hearts at 4WPMI. n = 19 mice for WT, n = 15 mice for tOE-DR. In all panels, numerical data are presented as mean ± s.e.m. Statistical significance was calculated using two-tailed unpaired Student’s t-test in b, c, e, hj, lp and r between the in-timepoint WT and tOE values. *P ≤ 0.05, **P < 0.01, ***P < 0.001, ****P < 0.0001.
Fig. 4 |
Fig. 4 |. ERBB2 signaling promotes a multifaceted negative feedback response.
a,b, Representative western blot (a) and quantification (b) of whole heart lysates for Hippo pathway components and DUSP6 for WT and tOE adult heart lysates for each timepoint. n = 3–8 per group. c, Schematic of the Hippo pathway, incorporating western blot data from the Dediff timepoint. d, Heat map of negative feedback regulators, based on log2-transformed normalized counts from RNA-seq data. Rows represent genes. Columns represent each biological sample. Color bars represent z-score for each row across all timepoints. e, qRT–PCR from whole heart lysates for negative feedback regulators. Each value is normalized to the WT value of its corresponding timepoint. n = 4 per group. f, Schematic of ERK and AKT pathways, incorporating RNA-seq and RT–qPCR data from the Dediff timepoint. g, Heat map of anti-angiogenic regulators, generated in the same way as d. In all graph panels, numerical data are presented as mean ± s.e.m. Statistical significance was calculated using a two-tailed paired Student’s t-test in b and e between WT and tOE groups. *P ≤ 0.05, **P < 0.01, ***P < 0.001, ****P < 0.0001. Uncropped blots for a are provided in Supplementary Source Data.
Fig. 5 |
Fig. 5 |. LATS1/2 negative feedback signaling is required for redifferentiation.
a, Schematic of experimental layout. b, Representative still images from first frame of 48-hour time-lapse movies of LATSi- or DMSO-treated WT and OE P7 CMs, with full quantification (n = 5–7 for each group). White triangles indicate mitosis without cytokinesis, and white circles indicate mitosis with cytokinesis. Colored tracks outline CM displacement. Scale bars, 100 μm. OE DMSO versus OE LATSi P = 0.0025. c, Representative immunofluorescence images for AurkB of groups stated in b with full quantification. All groups had minimum n = 3. Scale bars, 50 μm. OE DMSO versus OE LATSi P < 0.0001. d, Schematic of inducible caERBB2 expression system in adult mice with tamoxifen-inducible LATS1/2 cKO and tdTomato expression. e, Panels from left to right show ejection fraction, long-axis FS, rSV and left ventricular diastolic volume (LV volume, d) of WT, tOE, WT LATS1/2 cKO and tOE LATS1/2 cKO uninjured mice, measured by echocardiography. Gray shaded area represents the time period of caERBB2 activation. Blue shaded area represents the redifferentiation phase. n = 3–8 for each group. f, Representative M-mode images of the left ventricle in diastole and systole for WT, tOE, WT cKO and OE cKO uninjured mice at Rediff (7WPI). Yellow lines trace wall contractility. Scale bars, 2 mm. g,h, Representative immunofluorescence images of WT, tOE, WT cKO and tOE cKO uninjured hearts at Rediff for Nestin (g) and pH3 (h). For g, upper panel scale bars, 1 mm. For lower panel and h, scale bars, 50 μm. Arrows highlight CMs positive for either Nestin or pH3. n = 3 per group. i, Metaphorical model for the role of negative feedback signaling in redifferentiation. In all panels, numerical data are presented as mean ± s.e.m. Statistical significance was calculated using a paired two-way ANOVA followed by Sidak’s test in b and c; a one-way ANOVA followed by Tukey’s test in the three left-most panels of e; and Bonferroni’s test for the following hypotheses: tOE versus WT cKO and tOE versus tOE cKO in the right-most panel of e. *P ≤ 0.05, **P < 0.01, ***P < 0.001, ****P < 0.0001. 7WPI, 7 weeks post induction; tam, tamoxifen.

References

    1. Ali H, Braga L & Giacca M Cardiac regeneration and remodelling of the cardiomyocyte cytoarchitecture. FEBS J. 287, 417–438 (2019). - PubMed
    1. Gemberling M, Karra R, Dickson AL & Poss KD Nrg1 is an injury-induced cardiomyocyte mitogen for the endogenous heart regeneration program in zebrafish. eLife 4, e05871 (2015). - PMC - PubMed
    1. D’Uva G et al. ERBB2 triggers mammalian heart regeneration by promoting cardiomyocyte dedifferentiation and proliferation. Nat. Cell Biol. 17, 627–638 (2015). - PubMed
    1. Monroe TO et al. YAP partially reprograms chromatin accessibility to directly induce adult cardiogenesis in vivo. Dev. Cell 48, 765–779 (2019). - PMC - PubMed
    1. Chen Y et al. Reversible reprogramming of cardiomyocytes to a fetal state drives heart regeneration in mice. Science 373, 1537–1540 (2021). - PubMed

LinkOut - more resources