. 2023 Dec 12;11(6):e0057523.
doi: 10.1128/spectrum.00575-23. Epub 2023 Nov 17.

The phylogeny of Acetobacteraceae: photosynthetic traits and deranged respiratory enzymes

Affiliations

The phylogeny of Acetobacteraceae: photosynthetic traits and deranged respiratory enzymes

Mauro Degli Esposti et al. Microbiol Spectr. .

Abstract

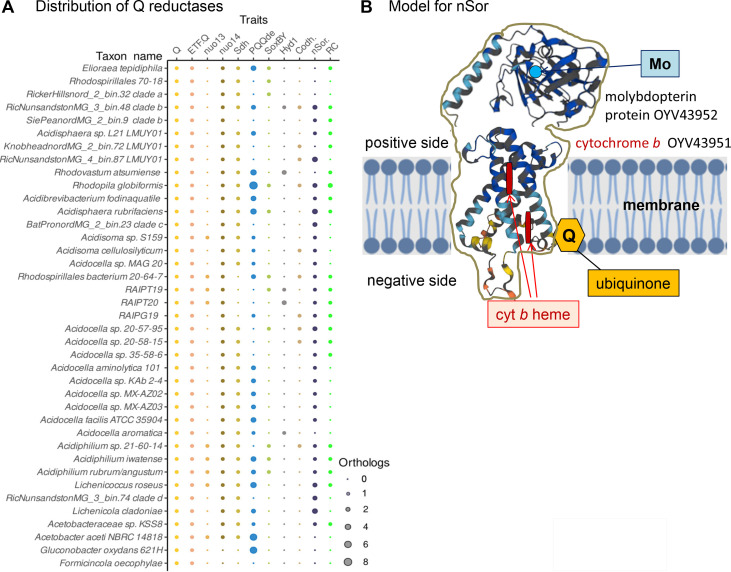
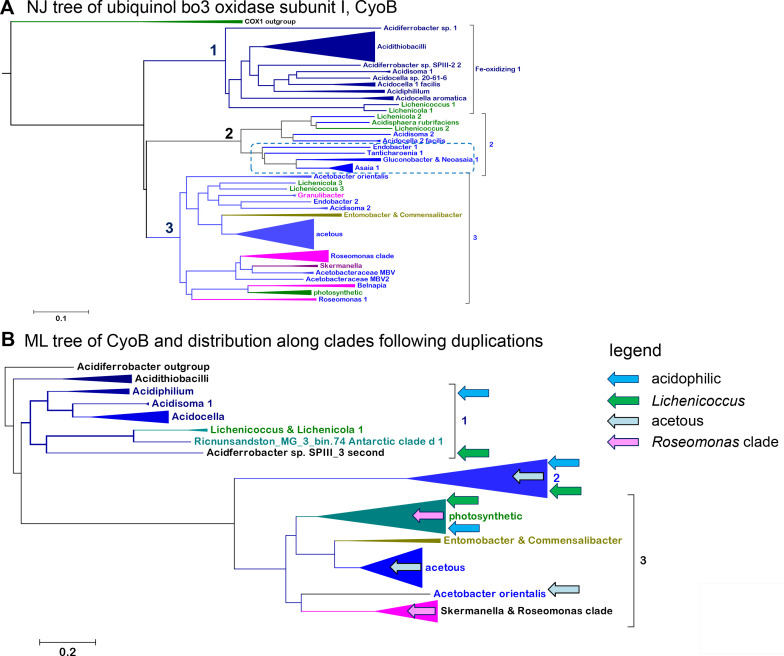
Acetobacteraceae are one of the best known and most extensively studied groups of bacteria, which nowadays encompasses a variety of taxa that are very different from the vinegar-producing species defining the family. Our paper presents the most detailed phylogeny of all current taxa classified as Acetobacteraceae, for which we propose a taxonomic revision. Several of such taxa inhabit some of the most extreme environments on the planet, from the deserts of Antarctica to the Sinai desert, as well as acidic niches in volcanic sites like the one we have been studying in Patagonia. Our work documents the progressive variation of the respiratory chain in early branching Acetobacteraceae into the different respiratory chains of acidophilic taxa such as Acidocella and acetous taxa such as Acetobacter. Remarkably, several genomes retain remnants of ancestral photosynthetic traits and functional bc 1 complexes. Thus, we propose that the common ancestor of Acetobacteraceae was photosynthetic.

Keywords: Acetobacteraceae; bacterial phylogeny; energy metabolism; phylogenomics.


Conflict of interest statement

The authors declare no conflict of interest.

Figures

Fig 1
Fig 1
Phylogeny of Acetobacteraceae with concatenated alignments of ribosomal proteins. (A) The ML tree was reconstructed with IQ-Tree (38) from a concatenated alignment of 15 ribosomal proteins (L2-6, L10, L14-16, L22, L24, S3, S8, S10, S17, and S19) of 70 taxa encompassing most of those presented in Table 1; Tables S1 and S2. Taxa that had less than 12 complete sequences of the above ribosomal proteins were excluded from the analysis (see Extended Datasheet 2 in the online repository https://osf.io/y6gxt/ for further details). The tree was reconstructed with the best-fit model (39) LG plus gamma = 4, and using an alignment of 2,405 amino acid sites, 40.7% of which were constant. See Fig. S1D for a similar ML tree obtained with an enlarged alignment of 32 concatenated core proteins. The bar quantifies the fractional change per position. The blue triangles indicate taxa re-classified in this study. (B) Summary of the results obtained as in panel A using different taxonomic samplings of Acetobacteraceae and also a reduced set of ribosomal proteins (L2-L6 only); these results are compared with those reported in the indicated references, obtained with different combinations of concatenated core proteins including various ribosomal ones. The number of acetous taxa considered in previous studies was much larger than that used in this work, which is focused on other clades of the Acetobacteraceae family.
Fig 2
Fig 2
Phylogenetic profile of Acetobacteraceae with different conserved markers. (A) An alignment of AtpD, the beta subunit of the F1F0 ATP synthase, was first built using ClustalW and then refined manually as described earlier (34, 35) to reconstruct the ML tree with the IQ-Tree program and the best-fit model LG and gamma = 4 (39). The alignment had 122 sequences, including those representing various clades of Antarctic MAGs (Table 2) and most Acidocella MAGs listed in Table S1, with a total of 498 amino acid sites, 49.8% of which were constant. The bar quantifies the fractional change per position as in Fig. 1A. Note that the position of Granulibacter is shifted from its most common placement at the base of the acetous clade (cf. Fig. 1A), most likely due to the highly divergent nature of its AtpD protein. The blue round symbols indicate the nodes for the sister acidophilic and acetous clades plus their subtending taxa. (B) Simplified scheme for the aerobic respiratory chain of Rhodovastum, which is representative of other photosynthetic taxa of Acetobacteraceae, including those of the Elioraea genus and the Roseomonas clade. (C) Simplified scheme for the respiratory chain of acetous taxa, in which the bc 1 complex, when present, is fundamentally inactive (see text).
Fig 3
Fig 3
(A) Phylogenetic tree of Acetobacteraceae NuoD. The ML tree was reconstructed using the NuoD subunit of Complex I, which has a strong phylogenetic signal (34). NuoD trees can be rooted in homologs that preserve vestigial ligands such as those of MarineAlpha9 MAGs (34) used here as the outgroup. The alignment was extended to representative NuoD homologs from Antarctic MAGs (21) and MAGs from Patagonia (Table 2; Table S1), as shown in Fig. 2A; it had 110 sequences with 429 amino acid sites, 28.4% of which were constant. The tree was reconstructed with the EX_EHO mixture model and was representative of various ML trees obtained with different taxonomic samplings and substitution models. Only the species or strain name is indicated for each protein.orThe letter a indicates the acidophilic clade with Acidocella as in Fig. 1A. The blue round symbols indicate the nodes for the sister clades of acidophilic and acetous plus their subtending taxa. Photosynthesis, indicated by the symbols shown in the legend at the bottom, was deduced from the presence or absence of PufML genes as well as those of Form I Rubisco (43). (B) The distribution of photosynthetic traits along the phylogeny of Acetobacteraceae was sketched over a compressed version of the ML tree in panel A. The distribution was assessed by the presence/absence analysis of key photosynthetic traits (Table S2; Fig. S4). White triangles within clades represent taxa without photosynthetic traits like Rhodospirillales 70–18. The green rhomboid symbol indicates anaerobic photosynthesis as in panel A. (C) The distribution of the major cytochrome oxidase, A1 type COX operon subtype b (20), was sketched over a compressed version of the tree in panel A.
Fig 4
Fig 4
Phylogenetic trees of photosynthetic marker proteins. (A) The phylogenetic NJ tree of PufM, the large subunit of the photosynthetic reaction center (RC), was rendered with the program MEGA5 (34). The tree was obtained directly from PSI-BLAST1000 of WP_138324303 PufM of Lichenicoccus against the whole nr database (accessed on 13 September 2022). Over 96% of the hits included proteins from alpha-, beta-, and gammaproteobacteria; the few proteins from other classes were removed for building the tree. The outgroup formed by Caenispirillum salinarum PufM was cut off from the graphical presentation (see Fig. S3A for an expansion of the top part of this tree containing also the outgroup). The clade comprising all the anoxygenic aerobic phototrophs of Acetobacteraceae is early branching, rather distant from the clade comprising Rhodovastum and Rhodopila, which cluster with photosynthetic Magnetospirillum and Rhodoplanes spp. that also have the rare trait of rhodoquinone (22, 52). These proteins are embedded in a large clade dominated by photosynthetic gammaproteobacteria of the Chromatiales order, in partial agreement with previous phylogenies (40). The large gray clade containing later diverging PufM proteins is cut off at its middle. (B) The ML tree was constructed using an alignment of 50 PufM sequences that combined most representatives of the clade of photosynthetic Acetobacteraceae in panel A with non-redundant homologs of environmental MAGs from Antarctica (21) and Patagonia (this work). The alignment had 344 amino acid sites (34% of which were constant), and the tree was reconstructed with the best-fit model (39) LG. Very similar results were obtained with the mixture model EX_EHO. Rhodopila was used as the outgroup, given its different photosynthetic character shared with Rhodovastum (panel A). (C) Combinations of photosynthetic and carbon fixation traits define the major physiology of acidophilic Acetobacteraceae. The table presents an extract of the data shown in Fig. S4 and Table S2. The type of major physiology was taken from microbiology and biochemical data (45, 49, 52) or deduced from the combined traits of photosynthesis (RC) and Form I Rubisco [cf. references (26, 43)].
Fig 5
Fig 5
(A) The distribution of traits for ubiquinone (Q) reduction among representative members of the Acetobacteraceae family was rendered in dot plot format (19). The presence of multiple orthologs for the proteins defining each trait is shown by dots of different sizes as indicated in the legend at the bottom. The nuo13 and nuo14 operons of Complex I were in separate columns as in Table S2. The two forms of aerobic carbon monoxide dehydrogenase (Codh#) were identified from sequence signatures and genomic clusters (63). (B) Model for the transmembrane di-heme cytochrome b OYV43951 related to E. coli YdhU that could reduce Q in the novel Sulfoxide-Q oxidoreductase (nSor in panel A)—with AlphaFold (64, 65) and the addition of hemes, Q and the membrane. This enzyme is the sole member of the sulfite oxidase sub-family (61) with associated membrane cytochrome b in Acidocella (see text).
Fig 6
Fig 6
Phylogeny and distribution of cytochrome bo 3 ubiquinol oxidases. (A) NJ tree of 145 representative CyoB proteins retrieved from a wide BLAST search of Asaia CyoB1 (59) WP_062164020 against all alphaproteobacteria. Three paralog COX1 proteins were used as the outgroup. The dashed box indicates the subclade of acetous taxa with a second CyoB included in clade 3. (B) Compressed view of an ML tree reconstructed with 128 CyoB sequences containing 730 amino acid sites and the EX_EHO model. The arrows indicate the duplication of proteins from major clades. The arrow of Lichenicoccus includes also Lichenicola. Figure S7 shows an expanded similar tree with annotated support values.
Fig 7
Fig 7
Derangement of the bc 1 complex operon and proteins. (A) Schematic representation of the petABC operon. The lack of conserved ligands for metal centers in the proteins is represented by gray squares. The pale bluish color of the long ISP of acetous taxa indicates the lower redox potential that these proteins likely have (see text and Fig. S9). The pale blue symbol with a dashed contour indicates that the petA gene is separate from the rest of the operon. Fully functional cytochrome b is indicated by the bright red petB symbols, while the cytochrome b of acetous taxa is indicated by the dark red petB symbol. The cytochrome b of members of the Lichenicoccus group is indicated by an orangey petB symbol because of the presence of unusual amino acid substitutions in key regions of the proteins. (B) Distribution of the various forms of key proteins of the bc 1 complex: PetA, Rieske ISP, and PetB, cytochrome b. The background phylogenetic tree of Acetobacteraceae was taken from Fig. 3A. The large arrow indicates the likely origin of the long form of ISP present in acetous taxa, which seems to be part of a massive LGT wave from gamma- and related betaproteobacteria, as discussed earlier (34, 70, 72). (C) The phylogenetic ML tree of cytochrome b was obtained with the best-fit LG model and gamma = 4 (39) using an alignment of 128 sequences expanded from that used for the tree in Fig. S1C. The different forms of the cytochrome b protein with partial or complete loss of the His ligands of cyt b H (Fig. S1B) are indicated by symbols as in panel A.
Fig 8
Fig 8
Distribution of ferrotrophy and its role in the respiratory chain of Acetobacteraceae. (A) Phylogeny and distribution of outer membrane Cyc2 among Acetobacteraceae. The ML tree was obtained from an alignment of 34 homologs of Cyc2B ACK78881 of Acidithiobacillus ferrooxidans involved in the reduction of extracellular ferric iron (19, 77), which were retrieved from a PSI-BLAST search against some acidithiobacilli, Acidiferrobacter spp., and all Acetobacteraceae. The alignment was manually refined and contained 574 amino acid sites, 15% of which were constant and included the CxxCH motif near the N-terminus for heme binding (78). The tree was reconstructed with the best-fit model (39) LG and gamma = 4. (B) Detailed illustration of the central part of the respiratory chain of acidophilic Acetobacteraceae. The illustration presents the possible connection of the oxidoreduction of extracellular iron (Fe) to the electron wire pivoting on Cyc2 (75). The different pathways of electron flow are indicated by the differently colored arrows. The 3D structure of the RC surrounded by the light-harvesting (LH) annulus of Rhodopila was modified from a figure in reference (56), while those of the dimeric form of the Paracoccus bc 1 complex (81) and of Paracoccus COX (82) have been rendered with iCn3D Structure Viewer. Q represents the reduced form of Q, ubiquinol. The C-terminal part of the PufM protein sticking out in the periplasmic space close to the PufC protein (Fig. S5) is shown on the left.

References

    1. Rai A, Jagadeeshwari U, Deepshikha G, Smita N, Sasikala C, Ramana CV. 2021. Phylotaxogenomics for the reappraisal of the genus Roseomonas with the creation of six new genera. Front Microbiol 12:677842. doi:10.3389/fmicb.2021.677842 - DOI - PMC - PubMed
    1. Komagata K, Lino T, Yamada Y. 2014. The family Acetobacteraceae, p 3–78. In Rosenberg E, DeLong EF, Lory S, Stackebrandt E, Thompson F (ed), The prokaryotes: alphaproteobacteria and betaproteobacteria. Springer Berlin Heidelberg.
    1. Hördt A, López MG, Meier-Kolthoff JP, Schleuning M, Weinhold LM, Tindall BJ, Gronow S, Kyrpides NC, Woyke T, Göker M. 2020. Analysis of 1,000+ type-strain genomes substantially improves taxonomic classification of Alphaproteobacteria Front Microbiol 11:468. doi:10.3389/fmicb.2020.00468 - DOI - PMC - PubMed
    1. Guzman J, Vilcinskas A. 2022. Genome analysis suggests the bacterial family Acetobacteraceae is a source of undiscovered specialized metabolites. Antonie Van Leeuwenhoek 115:41–58. doi:10.1007/s10482-021-01676-7 - DOI - PMC - PubMed
    1. Dziuba MV, Paulus A, Schramm L, Awal RP, Pósfai M, Monteil CL, Fouteau S, Uebe R, Schüler D. 2022. Silent gene clusters encode magnetic organelle biosynthesis in a non-magnetotactic phototrophic bacterium. ISME J 17:326–339. doi:10.1038/s41396-022-01348-y - DOI - PMC - PubMed

LinkOut - more resources