

kGWASflow: a modular, flexible, and reproducible Snakemake workflow for k-mers-based GWAS
- PMID: 37976215
- PMCID: PMC10755180
- DOI: 10.1093/g3journal/jkad246
kGWASflow: a modular, flexible, and reproducible Snakemake workflow for k-mers-based GWAS
Abstract
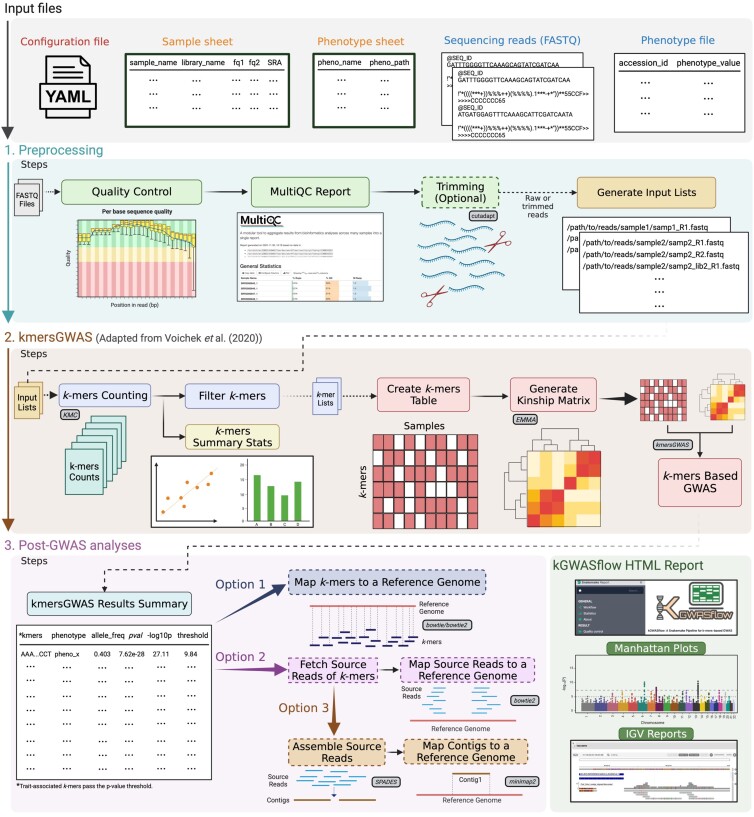
Genome-wide association studies (GWAS) have been widely used to identify genetic variation associated with complex traits. Despite its success and popularity, the traditional GWAS approach comes with a variety of limitations. For this reason, newer methods for GWAS have been developed, including the use of pan-genomes instead of a reference genome and the utilization of markers beyond single-nucleotide polymorphisms, such as structural variations and k-mers. The k-mers-based GWAS approach has especially gained attention from researchers in recent years. However, these new methodologies can be complicated and challenging to implement. Here, we present kGWASflow, a modular, user-friendly, and scalable workflow to perform GWAS using k-mers. We adopted an existing kmersGWAS method into an easier and more accessible workflow using management tools like Snakemake and Conda and eliminated the challenges caused by missing dependencies and version conflicts. kGWASflow increases the reproducibility of the kmersGWAS method by automating each step with Snakemake and using containerization tools like Docker. The workflow encompasses supplemental components such as quality control, read-trimming procedures, and generating summary statistics. kGWASflow also offers post-GWAS analysis options to identify the genomic location and context of trait-associated k-mers. kGWASflow can be applied to any organism and requires minimal programming skills. kGWASflow is freely available on GitHub (https://github.com/akcorut/kGWASflow) and Bioconda (https://anaconda.org/bioconda/kgwasflow).
Keywords: GWAS; bioinformatics tool; k-mers; pipeline; snakemake.
© The Author(s) 2023. Published by Oxford University Press on behalf of The Genetics Society of America.
Conflict of interest statement
Conflicts of interest The authors declare no conflicts of interest.
Figures


Similar articles
-
RASflow: an RNA-Seq analysis workflow with Snakemake.BMC Bioinformatics. 2020 Mar 18;21(1):110. doi: 10.1186/s12859-020-3433-x. BMC Bioinformatics. 2020. PMID: 32183729 Free PMC article.
-
Natrix: a Snakemake-based workflow for processing, clustering, and taxonomically assigning amplicon sequencing reads.BMC Bioinformatics. 2020 Nov 16;21(1):526. doi: 10.1186/s12859-020-03852-4. BMC Bioinformatics. 2020. PMID: 33198651 Free PMC article.
-
The GenoPred pipeline: a comprehensive and scalable pipeline for polygenic scoring.Bioinformatics. 2024 Oct 1;40(10):btae551. doi: 10.1093/bioinformatics/btae551. Bioinformatics. 2024. PMID: 39292536 Free PMC article.
-
MosaiCatcher v2: a single-cell structural variations detection and analysis reference framework based on Strand-seq.Bioinformatics. 2023 Nov 1;39(11):btad633. doi: 10.1093/bioinformatics/btad633. Bioinformatics. 2023. PMID: 37851409 Free PMC article.
-
k-mer-Based Genome-Wide Association Studies in Plants: Advances, Challenges, and Perspectives.Genes (Basel). 2023 Jul 13;14(7):1439. doi: 10.3390/genes14071439. Genes (Basel). 2023. PMID: 37510343 Free PMC article. Review.
References
-
- Andrews S. 2010. FastQC: A Quality Control Tool for High Throughput Sequence Data. Cambridge (UK): Babraham Bioinformatics, Babraham Institute.
Publication types
MeSH terms
Grants and funding
LinkOut - more resources
Full Text Sources