. 2023 Nov 17;8(89):eadj5097.
doi: 10.1126/sciimmunol.adj5097. Epub 2023 Nov 17.

Cancer immunotherapy via synergistic coactivation of myeloid receptors CD40 and Dectin-1

Affiliations

Cancer immunotherapy via synergistic coactivation of myeloid receptors CD40 and Dectin-1

Max M Wattenberg et al. Sci Immunol. .

Abstract

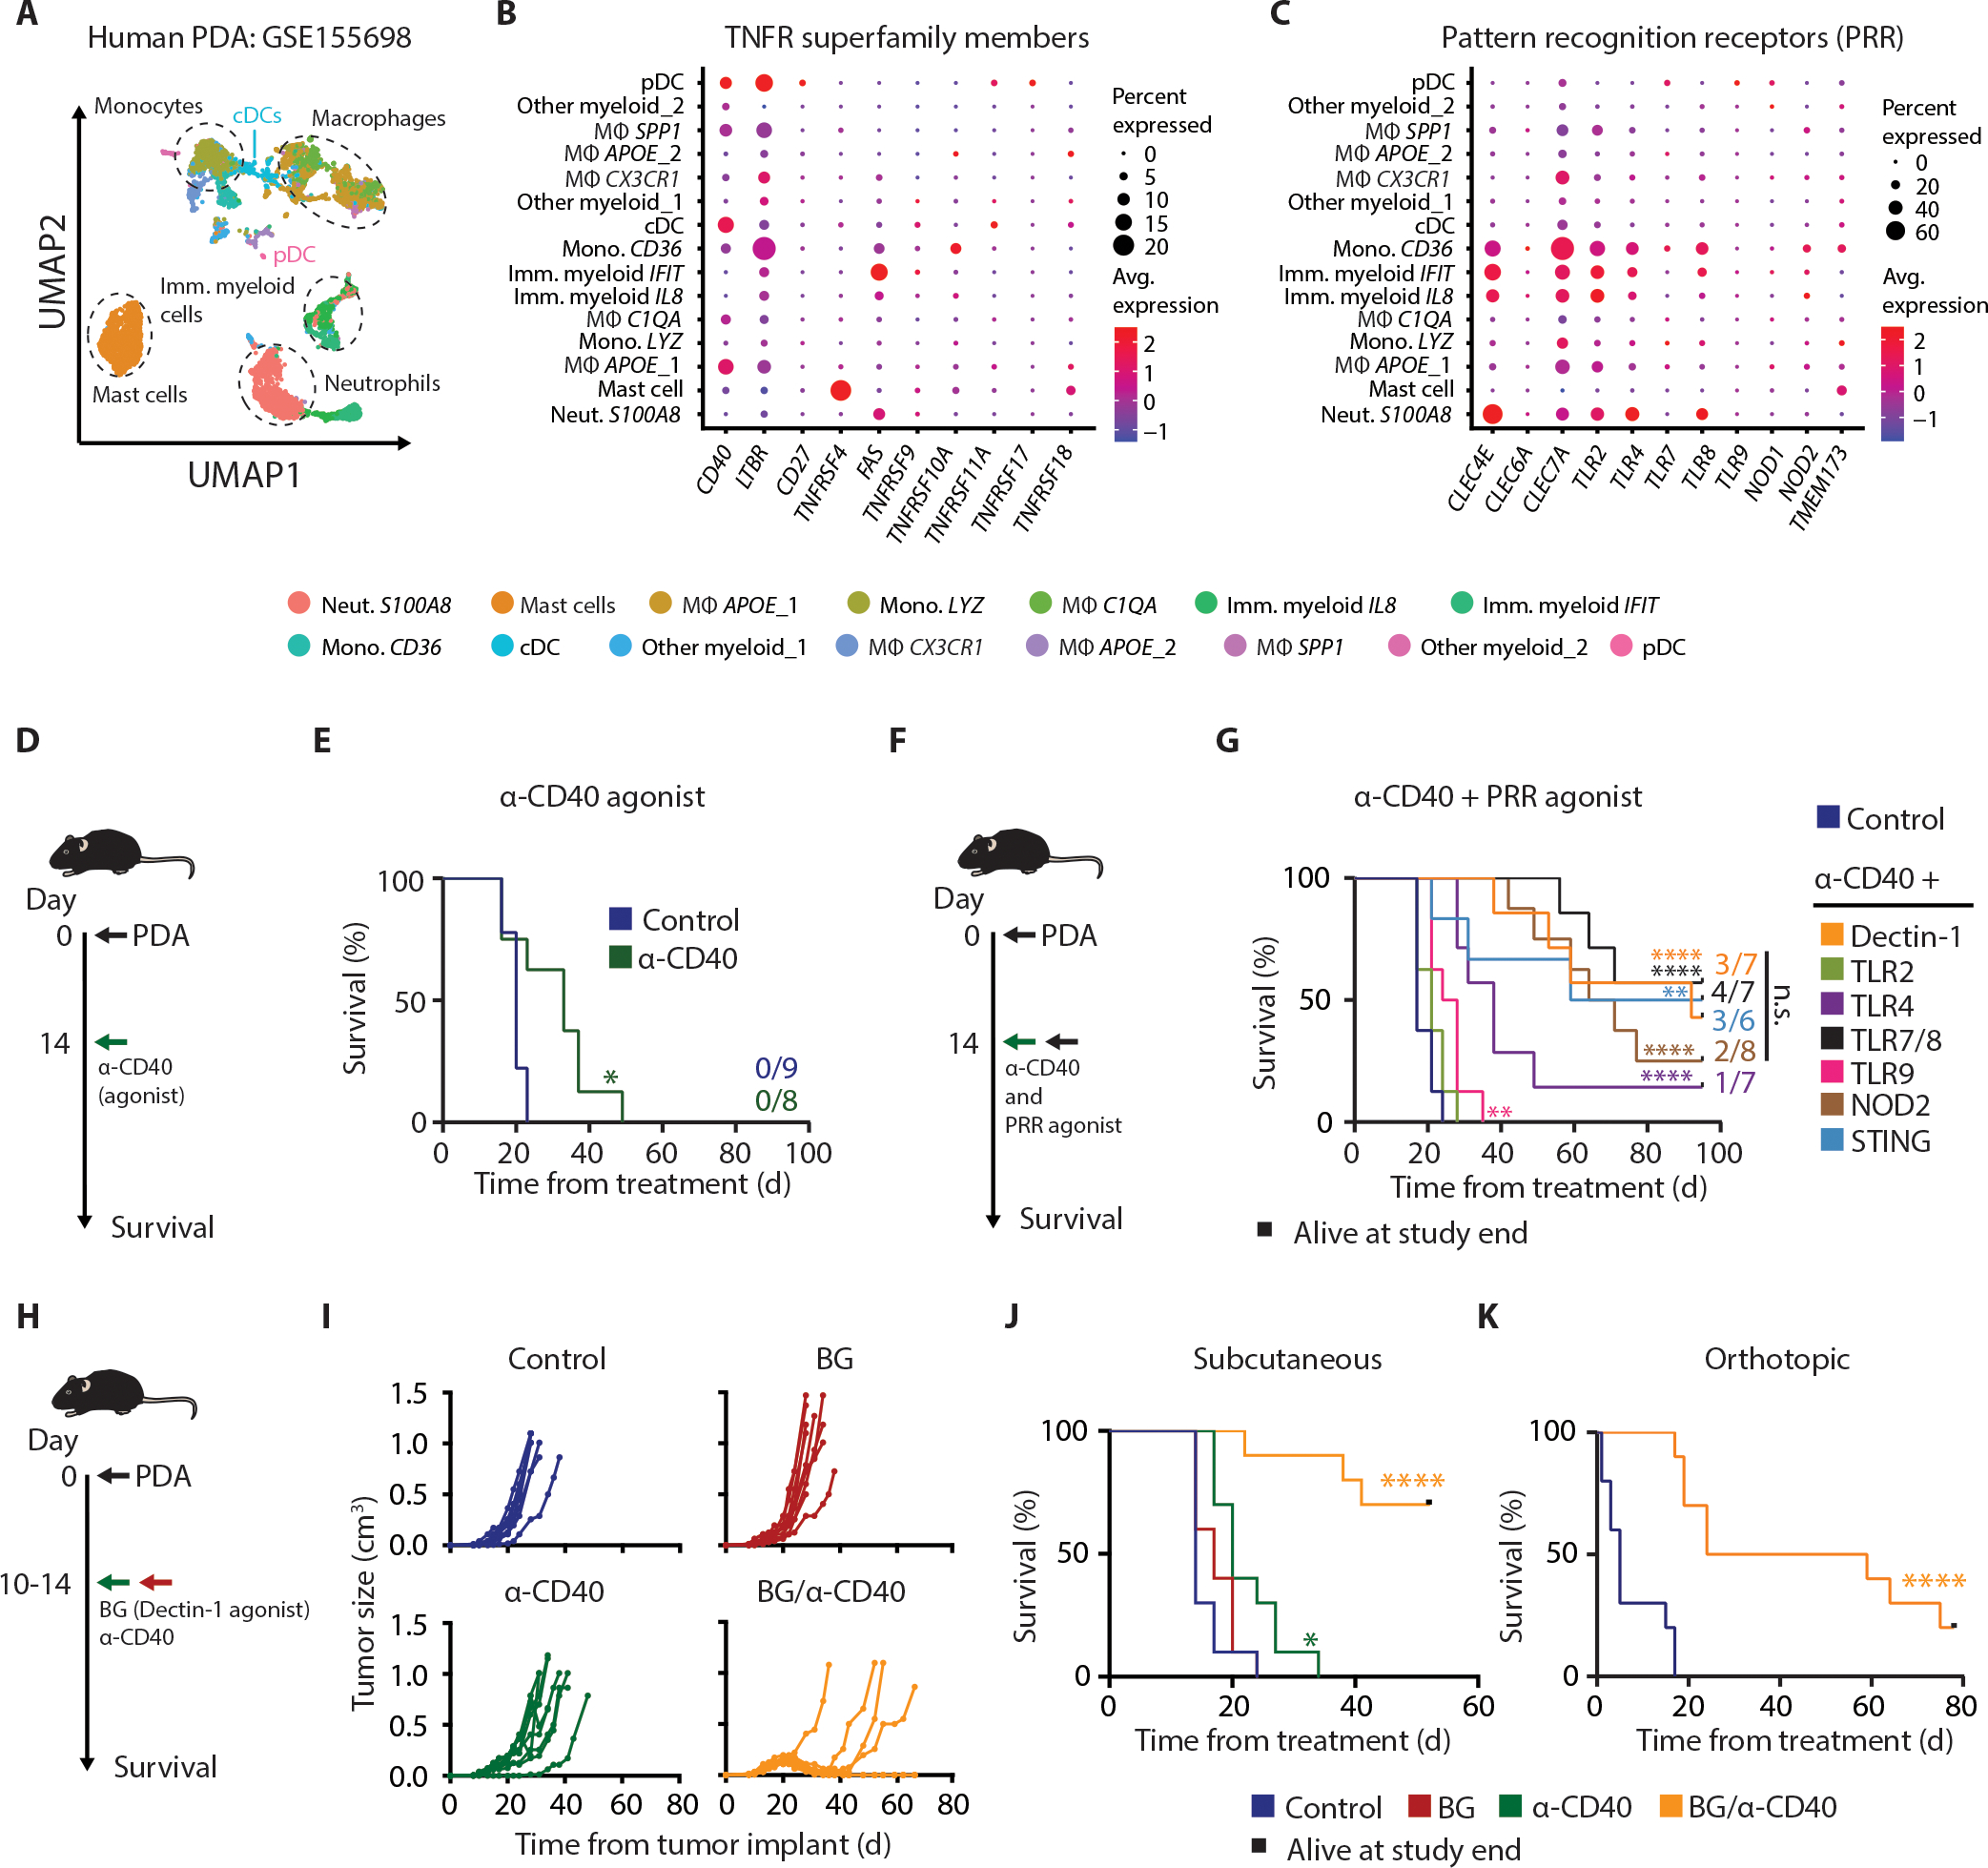
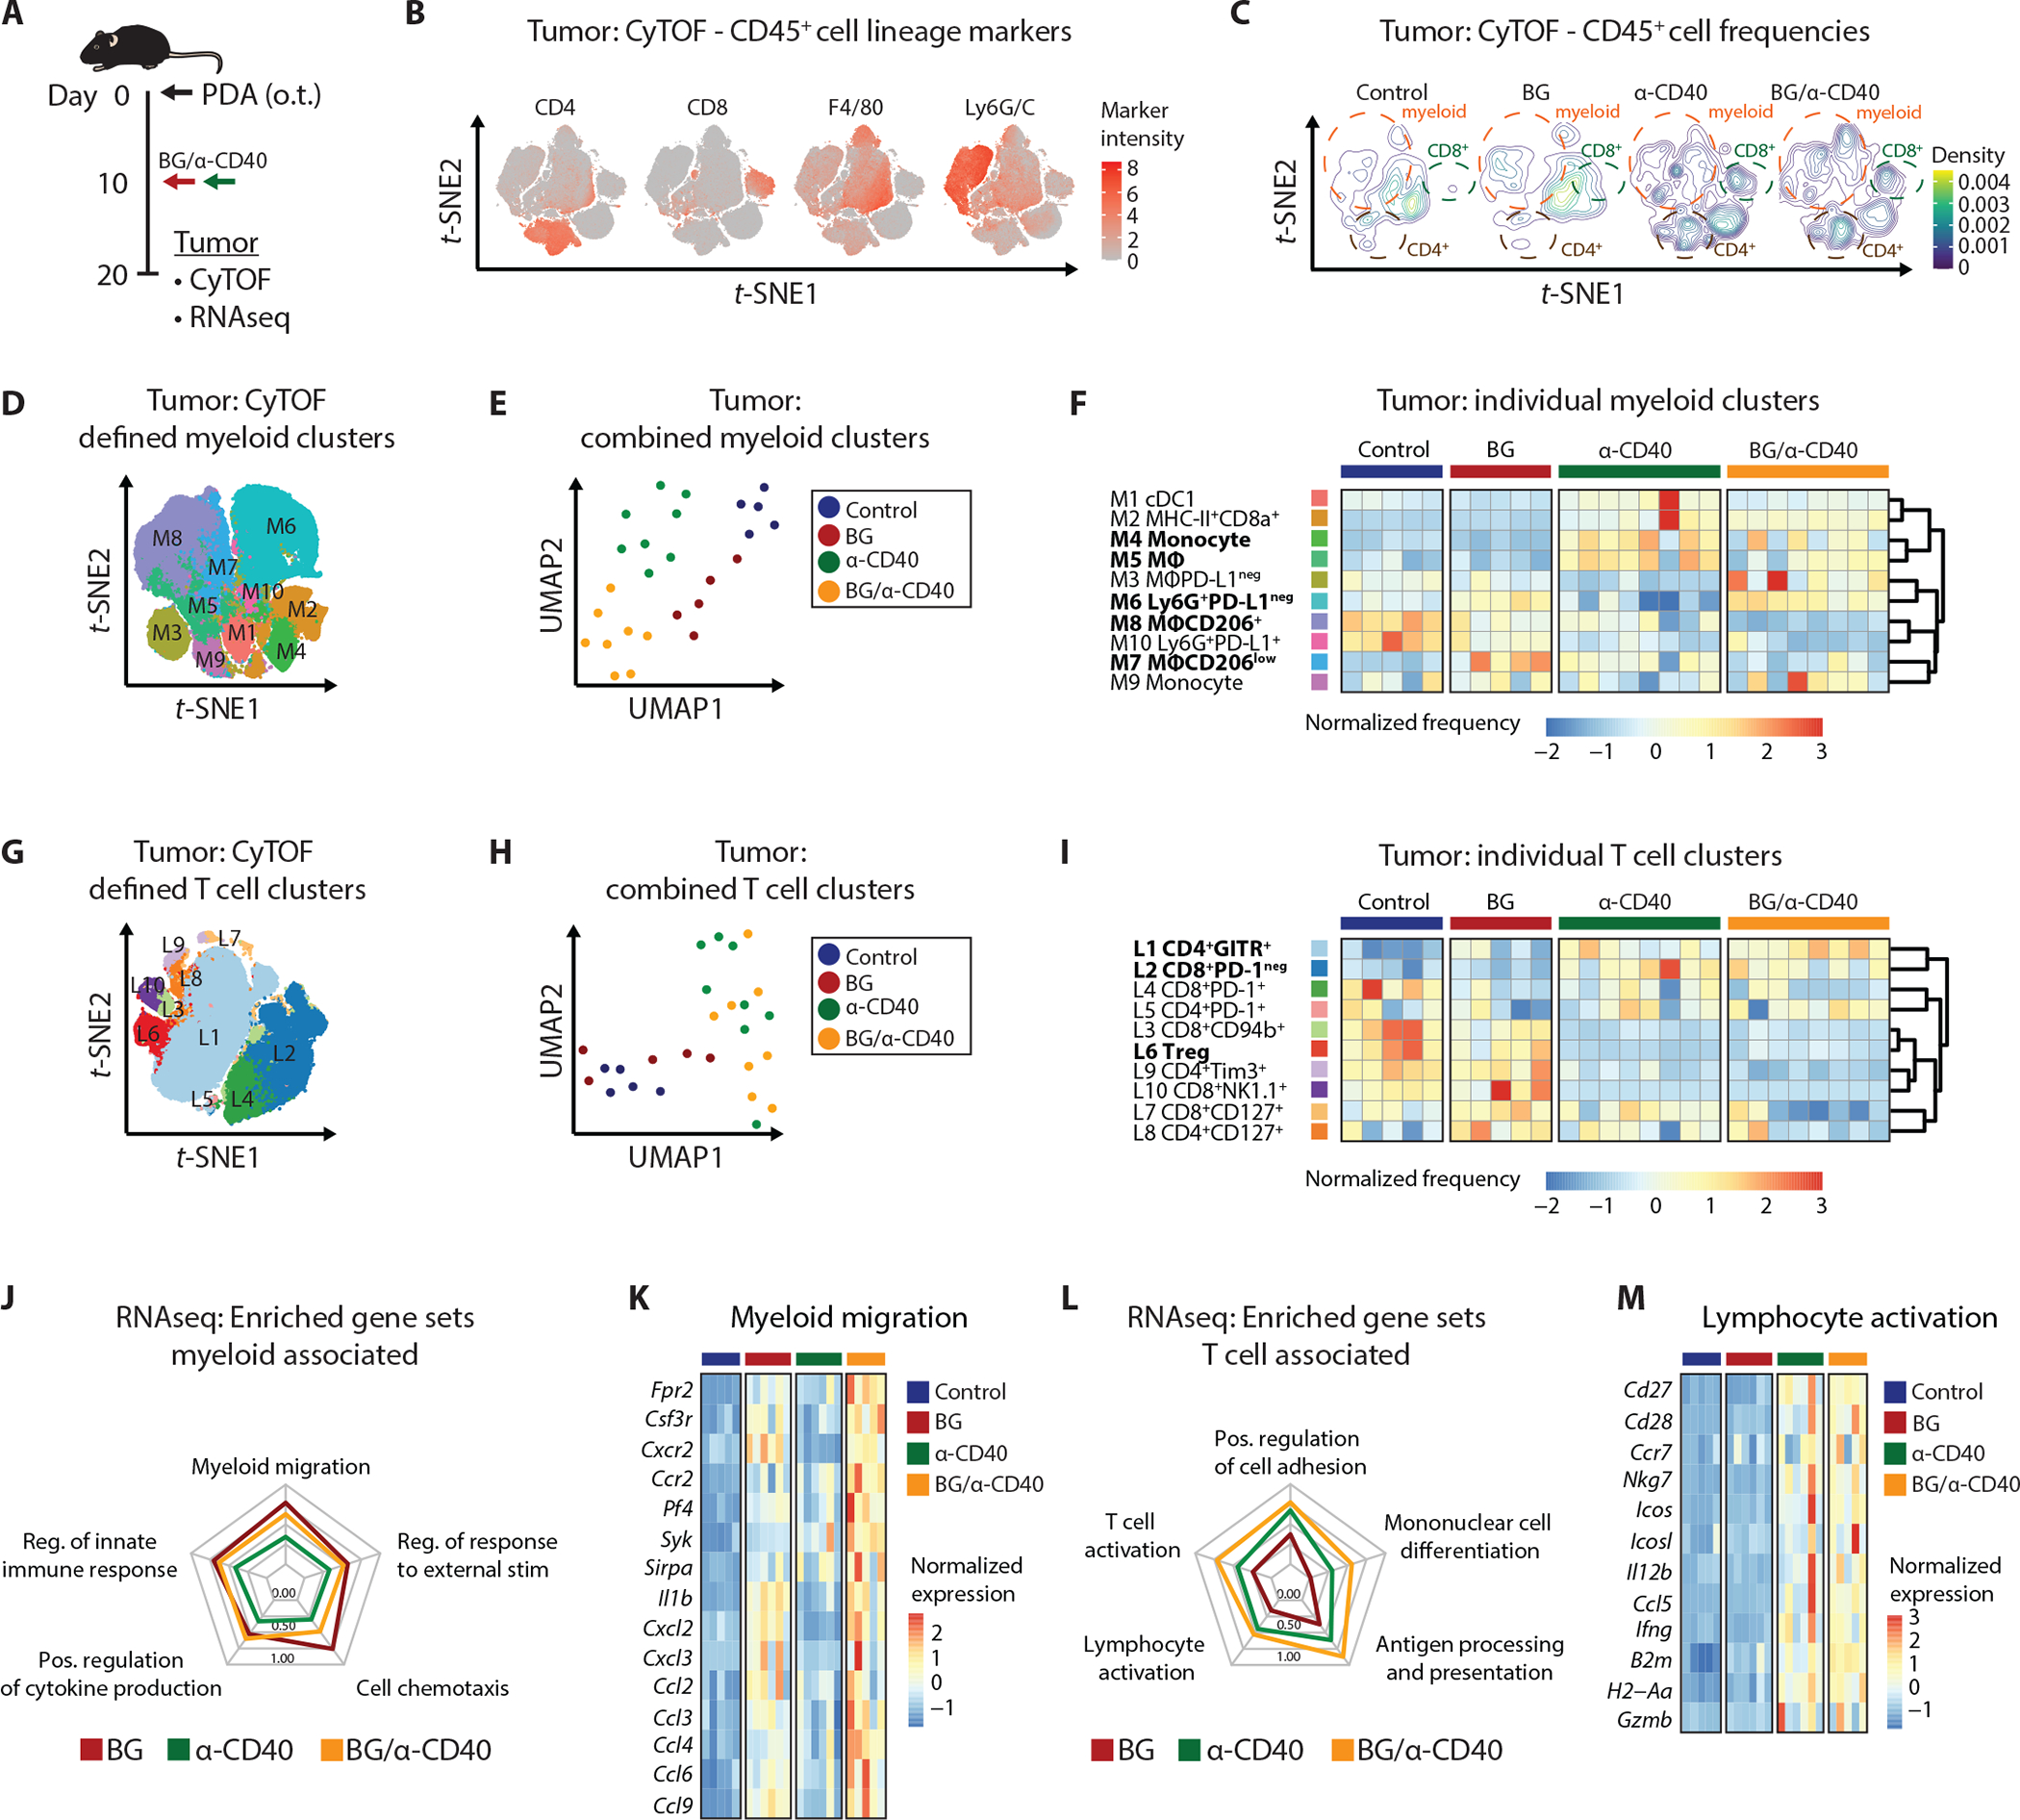
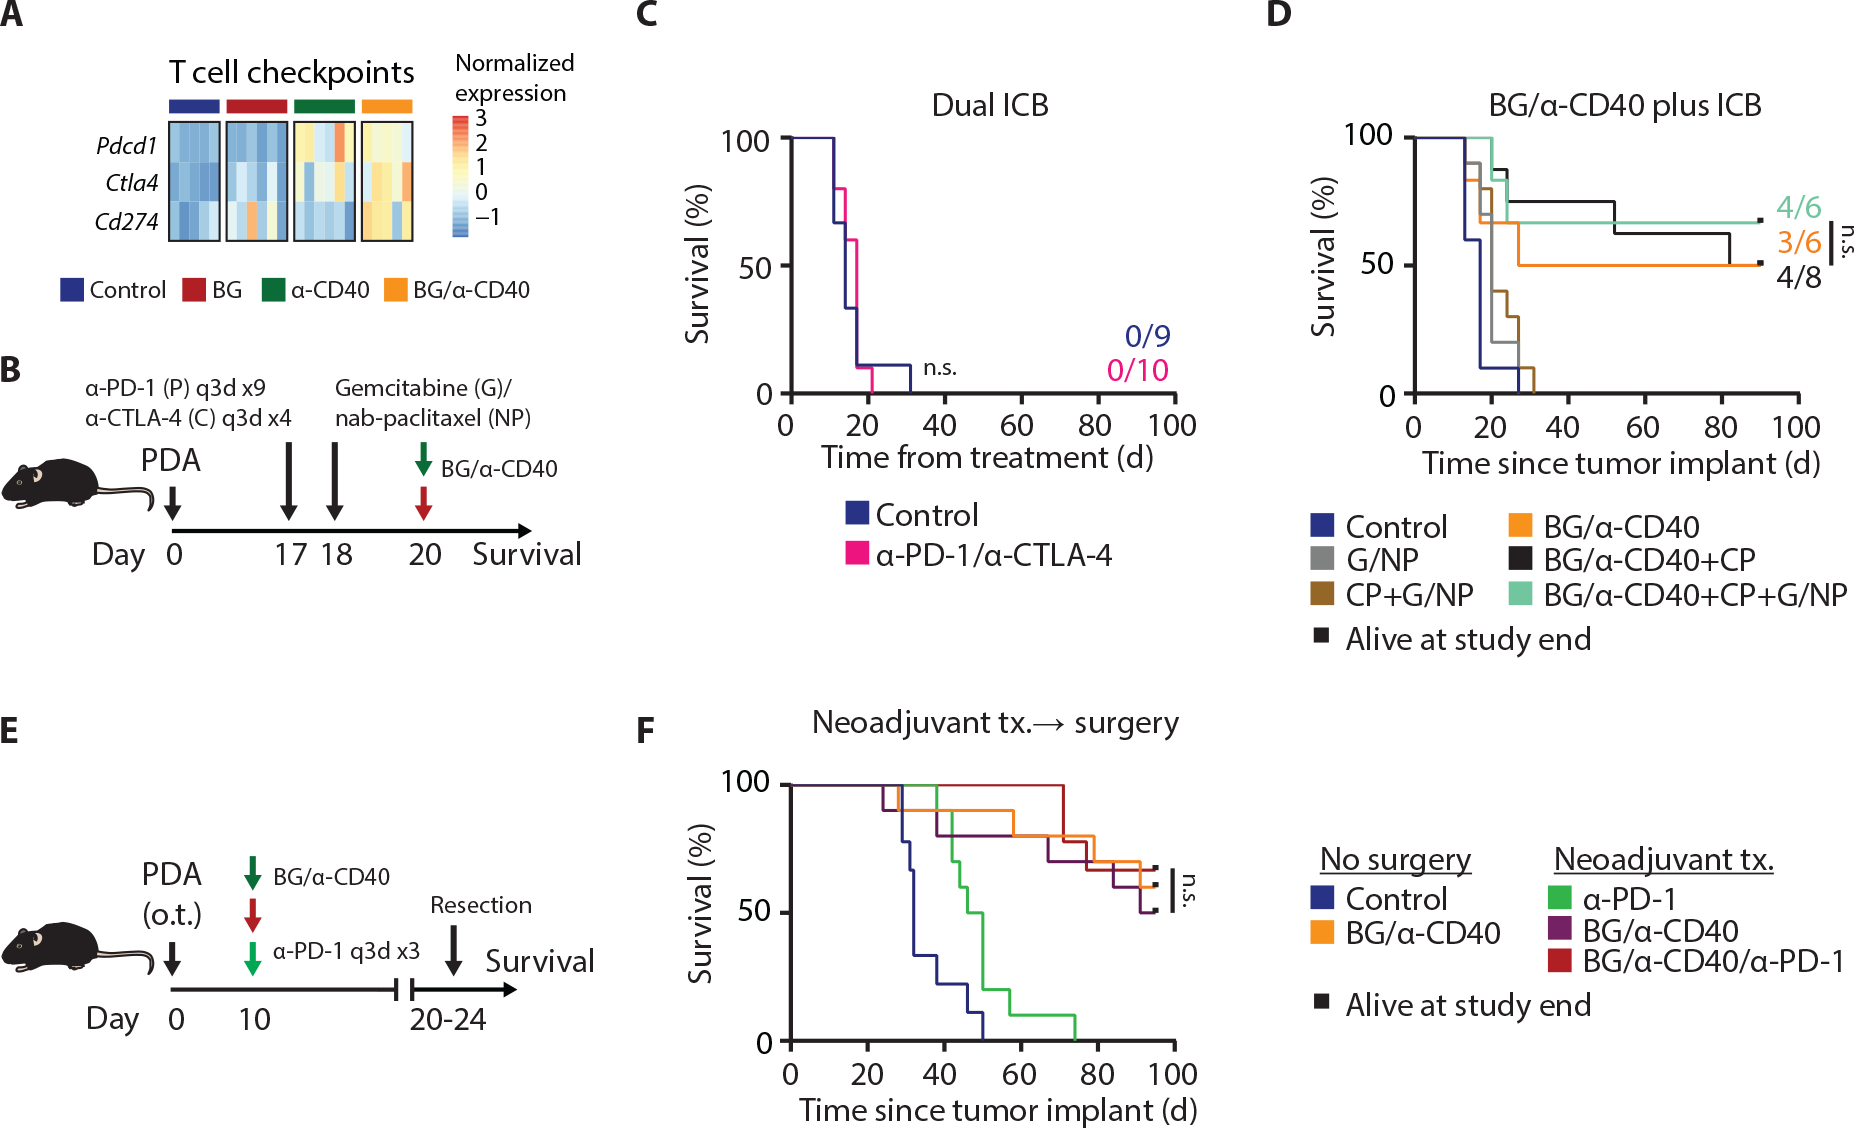
Myeloid cells facilitate T cell immune evasion in cancer yet are pliable and have antitumor potential. Here, by cotargeting myeloid activation molecules, we leveraged the myeloid compartment as a therapeutic vulnerability in mouse models of pancreatic cancer. Myeloid cells in solid tumors expressed activation receptors including the pattern recognition receptor Dectin-1 and the TNF receptor superfamily member CD40. In mouse models of checkpoint inhibitor-resistant pancreatic cancer, coactivation of Dectin-1, via systemic β-glucan therapy, and CD40, with agonist antibody treatment, eradicated established tumors and induced immunological memory. Antitumor activity was dependent on cDC1s and T cells but did not require classical T cell-mediated cytotoxicity or blockade of checkpoint molecules. Rather, targeting CD40 drove T cell-mediated IFN-γ signaling, which converged with Dectin-1 activation to program distinct macrophage subsets to facilitate tumor responses. Thus, productive cancer immune surveillance in pancreatic tumors resistant to checkpoint inhibition can be invoked by coactivation of complementary myeloid signaling pathways.


Conflict of interest statement

Competing interests:

M.M.W. reports prior or active roles as a consultant for Nanology. G.L.B. reports prior or active roles as a consultant/advisory board member for Adicet Bio, Aduro Biotech, Alligator Biosciences, AstraZeneca, BiolineRx, BioMarin Pharmaceuticals, Boehinger Ingelheim, Bristol-Myers Squibb, Cantargia, Cour Pharmaceuticals, Genmab, HotSpot Therapeutics, Incyte, Janssen, Legend Biotech, Merck, Molecular Partners, Monopteros, Nano Ghosts, Opsona, Pancreatic Cancer Action Network, Seagen, Shattuck Laboratories, and Verastem; reports receiving commercial research grants from Alligator Biosciences, Gilead Sciences, Incyte, Bristol-Myers Squibb, Verastem, Halozyme, Biothera, Hibercell, Newlink, Novartis, Arcus, and Janssen. G.L.B. is an inventor of intellectual property (U.S. patent numbers 10,640,569 and 10,577,417) and recipient of royalties related to CAR T cells that is licensed by the University of Pennsylvania to Novartis and Tmunity Therapeutics. N.B. is an employee of and owns stock in Hibercell, Inc. V.M.H. is a current employee of GlaxoSmithKline. M.M.W, G.L.B and N.B. are inventors on patent application number 63/505,892 held by HiberCell Inc. that covers methods of treating cancer using soluble beta glucans and CD40 agonistic monoclonal antibodies.

Figures

Figure 1.
Figure 1.. Combined activation of myeloid receptors promotes synergistic cancer therapy in pancreatic ductal adenocarcinoma.
(A) UMAP plot of myeloid cells in human PDA (n = 16). (B) Dotplot of Tumor Necrosis Factor Receptor (TNFR) superfamily member and (C) Pattern Recognition Receptor (PRR) gene expression in myeloid cells from human PDA (n = 16). CLEC7A encodes for Dectin-1. (D) Study schema showing mice (n = 8–9/grp) injected s.c. with PDA.7940B and treated with aCD40. (E) Kaplan-Meier survival analysis of (D). Numbers indicate mice remaining alive at study end. (F) Study schema showing mice (n = 6–8/grp) injected s.c. with PDA.7940B and treated with aCD40 plus systemic administration of the indicated PRR agonist. (G) Kaplan-Meier survival analysis of (F). Numbers indicate mice remaining alive at study end. (H) Study schema showing mice injected s.c. or o.t. with PDA.7940B and treated with aCD40 (0.1 mg i.p.), β-glucan (1.2 mg i.v.) or the combination. (I) Tumor volume over time. (J) Kaplan-Meier survival analysis of mice (n = 10/grp) treated as in (H). (K) Kaplan-Meier survival analysis of mice (n = 10/grp) with o.t. pancreas tumors. Log-rank tests were used (E, G, J and K) for pairwise comparison among all groups. Asterix represents significance testing compared to control. BG, β-glucan; o.t., orthotopic tumor; i.p., intra-peritoneal; i.v., intravenous; *, p < 0.05; **, p < 0.01; ****, p < 0.0001. (E to K) is representative of two independent experiments.
Figure 2.
Figure 2.. Myeloid targeting therapy drives distinct tumor immune landscapes.
(A) Study schema. (B) t-SNE plots of selected lineage markers. (C) Density plots. (D) t-SNE showing FlowSOM defined myeloid clusters. (E) UMAP projection. Each dot is an individual mouse tumor defined by the relative frequencies of n = 10 CyTOF defined myeloid cell clusters in control (n = 5) mice and mice treated with BG (n = 5), aCD40 (n = 8) and BG/aCD40 (n = 8). (F) Heatmap of myeloid clusters. Bolded text indicates selected clusters significantly altered by BG, aCD40 or BG/aCD40 treatment as compared to control. Significance testing performed using one-way ANOVA with Tukey’s and displayed in Supplementary Fig. S3E. Columns represent biological replicates. (G) t-SNE of FlowSOM defined T cell clusters. (H) UMAP projection. Each dot is an individual mouse tumor defined by the relative frequencies of n = 10 CyTOF defined T cell clusters in control (n = 5) mice and mice treated with BG (n = 5), aCD40 (n = 8) and BG/aCD40 (n = 8). (I) Heatmap of T cell clusters. Bolded text indicates clusters significantly altered by aCD40 or BG/aCD40 treatment as compared to control. Significance testing performed using one-way ANOVA and displayed in Supplementary Fig. S3H. Columns represent biological replicates. (J) Radar plot of selected myeloid related GSEA pathways based on bulk RNAseq of tumors from control (n = 5) mice and mice treated with BG (n = 6), aCD40 (n = 6) and BG/aCD40 (n = 5). Axis is normalized enrichment score relative to a range of 1.5 – 2.2. (K) Heatmap of selected genes related to myeloid migration gene set. (L) Radar plot of selected T cell related GSEA pathways. Axis and experimental approach is as in (J). (M) Heatmap of selected genes related to lymphocyte activation gene set. BG, β-glucan.
Figure 3.
Figure 3.. Anti-tumor activity of myeloid agonist therapy is independent of T cell immune checkpoints.
(A) Heatmap of selected genes related to T cell checkpoint molecules. (B) Study schema of mice injected s.c. with PDA.7940B. (C) Kaplan-Meier survival analysis of mice (n = 9–10/grp) treated with anti-PD-1 plus anti-CTLA-4. Numbers indicate mice remaining alive at study end out of the total treatment cohort. (D) Kaplan-Meier survival analysis of mice (n = 6–8/grp) treated with combinations of gemcitabine plus nab-paclitaxel, anti-PD-1 plus anti-CTLA-4 and BG/aCD40. (E) Neo-adjuvant treatment study schema. (F) Kaplan-Meier survival analysis of (E) with n = 9–10 mice per grp. Log-rank tests were used (C, D and F) for pairwise comparison among treatment groups. Significance testing indicates comparison of anti-PD-1 plus anti-CTLA-4 versus control (C) or BG/aCD40 versus BG/aCD40 plus the indicated additional therapies (D and F). BG, β-glucan. (B to F) is representative of two independent experiments.
Figure 4.
Figure 4.. Classical cytotoxicity pathways are not required for T cell immunosurveillance with myeloid agonist therapy.
(A) Study schema of mice (n = 9–10/grp) injected subcutaneously with PDA.69. (B) Kaplan-Meier survival analysis of (A). (C) Study schema of secondary tumor challenge. (D) Tumor volume over time. Numbers indicate tumor free mice at end of study. Two-way ANOVA with Tukey’s test was used. (E) Study schema of mice injected o.t. into the pancreas with PDA.7940B. (F) Representative images of tumors stained for CD3 (purple), Ki67 (yellow), CK19 (teal) and nuclei (blue, hematoxylin) (top). Heatmaps showing density of CD3+ cells (bottom). (G) Quantification of CD3+ cells per mm2 in control, BG, aCD40 and BG/aCD40 treated mice (n = 5–6/grp). (H) Quantification of CK19 percentage of tumor region in control, BG, aCD40 and BG/aCD40 treated mice (n = 5–6/grp). One-way ANOVA with Tukey’s test was used in (G) and (H). (I) Study schema. (J) Kaplan-Meier survival analysis of (I) with n = 7–8/grp. (K) Study schema. (L) Kaplan-Meier survival analysis with n = 8/grp. Log-rank tests were used (B, J and L) for pairwise comparison among all groups. Displayed significance testing indicates BG/aCD40 compared to the indicated treatment group. BG, β-glucan; Data are shown as mean α s.e.m; *, p < 0.05; **, p < 0.01; ***, p < 0.001, ****, p < 0.0001. (A to L) are representative of at least two independent experiments.
Figure 5.
Figure 5.. IFNγ is expressed by T cells and enforces the anti-tumor activity of Dectin-1-targeted therapy.
(A) Study schema (left) and UMAP projection of computationally sorted lymphoid cells defined by scRNAseq (right). Two samples (each consisting of 2–3 pooled tumors) per treatment condition were analyzed. (B) Dotplot of relative change in frequency of lymphoid populations comparing treatment to control. Values are log2 fold change. Size represents the percentage of the population of total cells in each condition. Color represents the number of upregulated DEGs in the indicated treatment versus control. (C) Gene set score of Regulation of Cytokine Production (GO:0001816) gene set. PC, plasma cell; B, B cell; NK, NK cell. (D) Dotplot of selected cytokines in T cells from BG/aCD40 treated tumors. (E) IHC for CD3 (yellow) and nuclei (blue, hematoxylin) and RNA in situ hybridization for Ifng (brown). Arrows highlight CD3+Ifng+ cells. (F) Study schema. (G) Kaplan-Meier survival analysis of (F) in mice treated with intra-tumoral IFNγ (n = 6) or IFNγ/BG. Log-rank test was used. BG, β-glucan; i.t., intra-tumoral; *, p < 0.05. (F to G) are representative of two independent experiments.
Figure 6.
Figure 6.. Host Dectin-1 is required for anti-tumor activity of myeloid activating therapy.
(A) Quantification of BG-DTAF expression 18h after treatment in wt (n = 3) and Clec7ako (n = 7) mice. Mann-Whitney U tests were performed. (B) Study schema in mice implanted s.q. with PDA.7940B tumors. (C) Kaplan-Meier analysis of (B) with n = 9–10 mice/grp. Log-rank test was used for pairwise comparison among all groups. Significance testing represents BG/aCD40 (wt) versus BG/aCD40 (Clec7ako). (D) Representative IHC of PDA.7940B o.t. tumors for F4/80 (purple), CK19 (teal) and nuclei (blue, hematoxylin). Dotted line denotes tumor border. (E) Quantification of IHC in control wt mice (n = 7) and BG/aCD40-treated wt (n = 7) and Clec7ako (n = 5) mice. Log2 transformed values are shown. Data represents two combined independent experiments. One-way ANOVA with Tukey’s was used. BG, β-glucan; MΦ, macrophage; wt, wild type. Data are shown as mean α s.e.m; *, p < 0.05. (A to C) are representative of two independent experiments.
Figure 7.
Figure 7.. Targeting Dectin-1 converges with CD40 agonist-driven IFNγ to program TAMs.
(A) IHC of o.t. PDA.7940B tumors 10 days post-treatment. (B) Quantification of IHC in (A) (n = 5–6 mice/grp). (C) UMAP projection (left) and dotplot (right) of scRNAseq from o.t. PDA.7940B tumors. (D) IHC of o.t. PDA.7940B tumors. (E) Quantification of Log2 fold change of CyTOF defined CD206+ and CD206neg populations. (F) UMAP projection of scRNAseq defined monocytes/MΦs. (G) Bar graph of differentially expressed genes in monocytes/MΦs in treatment versus control. (H) Heatmaps of average expression of selected genes significantly upregulated with BG/aCD40 in CD206+ or CD206neg MΦs compared to control. Columns represent treatment group. (I) Quantification of IHC in (A). (J) Study schema. (K) Tumor growth curves. Data represents two combined independent experiments. (L) Kaplan-Meier survival analysis of (J). Log-rank test was used. Significant testing indicates pairwise comparisons between BG/aCD40 and BG/aCD40 plus myeloid cell depletion. Numbers indicate mice remaining alive at study end. One-way ANOVA with Tukey’s was used (B, E and I). BG, β-glucan; MΦ, macrophage; wt, wild type. Data are shown as mean α s.e.m; *, p < 0.05; **, p < 0.01; ***, p < 0.001; ****, p < 0.0001. (A to B and I to L) are representative of at least two independent experiments.

References

    1. Waldman AD, Fritz JM, Lenardo MJ, A guide to cancer immunotherapy: from T cell basic science to clinical practice. Nat Rev Immunol 20, 651–668 (2020). - PMC - PubMed
    1. Renouf DJ et al., The CCTG PA.7 phase II trial of gemcitabine and nab-paclitaxel with or without durvalumab and tremelimumab as initial therapy in metastatic pancreatic ductal adenocarcinoma. Nat Commun 13, 5020 (2022). - PMC - PubMed
    1. Reardon DA et al., Effect of Nivolumab vs Bevacizumab in Patients With Recurrent Glioblastoma: The CheckMate 143 Phase 3 Randomized Clinical Trial. JAMA Oncol 6, 1003–1010 (2020). - PMC - PubMed
    1. Eng C et al., Atezolizumab with or without cobimetinib versus regorafenib in previously treated metastatic colorectal cancer (IMblaze370): a multicentre, open-label, phase 3, randomised, controlled trial. Lancet Oncol 20, 849–861 (2019). - PubMed
    1. Chen DS, Mellman I, Oncology meets immunology: the cancer-immunity cycle. Immunity 39, 1–10 (2013). - PubMed