. 2024 May 1;79(5):986-1004.
doi: 10.1097/HEP.0000000000000690. Epub 2023 Nov 16.

LRH-1 agonist DLPC through STAT6 promotes macrophage polarization and prevents parenteral nutrition-associated cholestasis in mice

Affiliations

LRH-1 agonist DLPC through STAT6 promotes macrophage polarization and prevents parenteral nutrition-associated cholestasis in mice

Swati Ghosh et al. Hepatology. .

Abstract

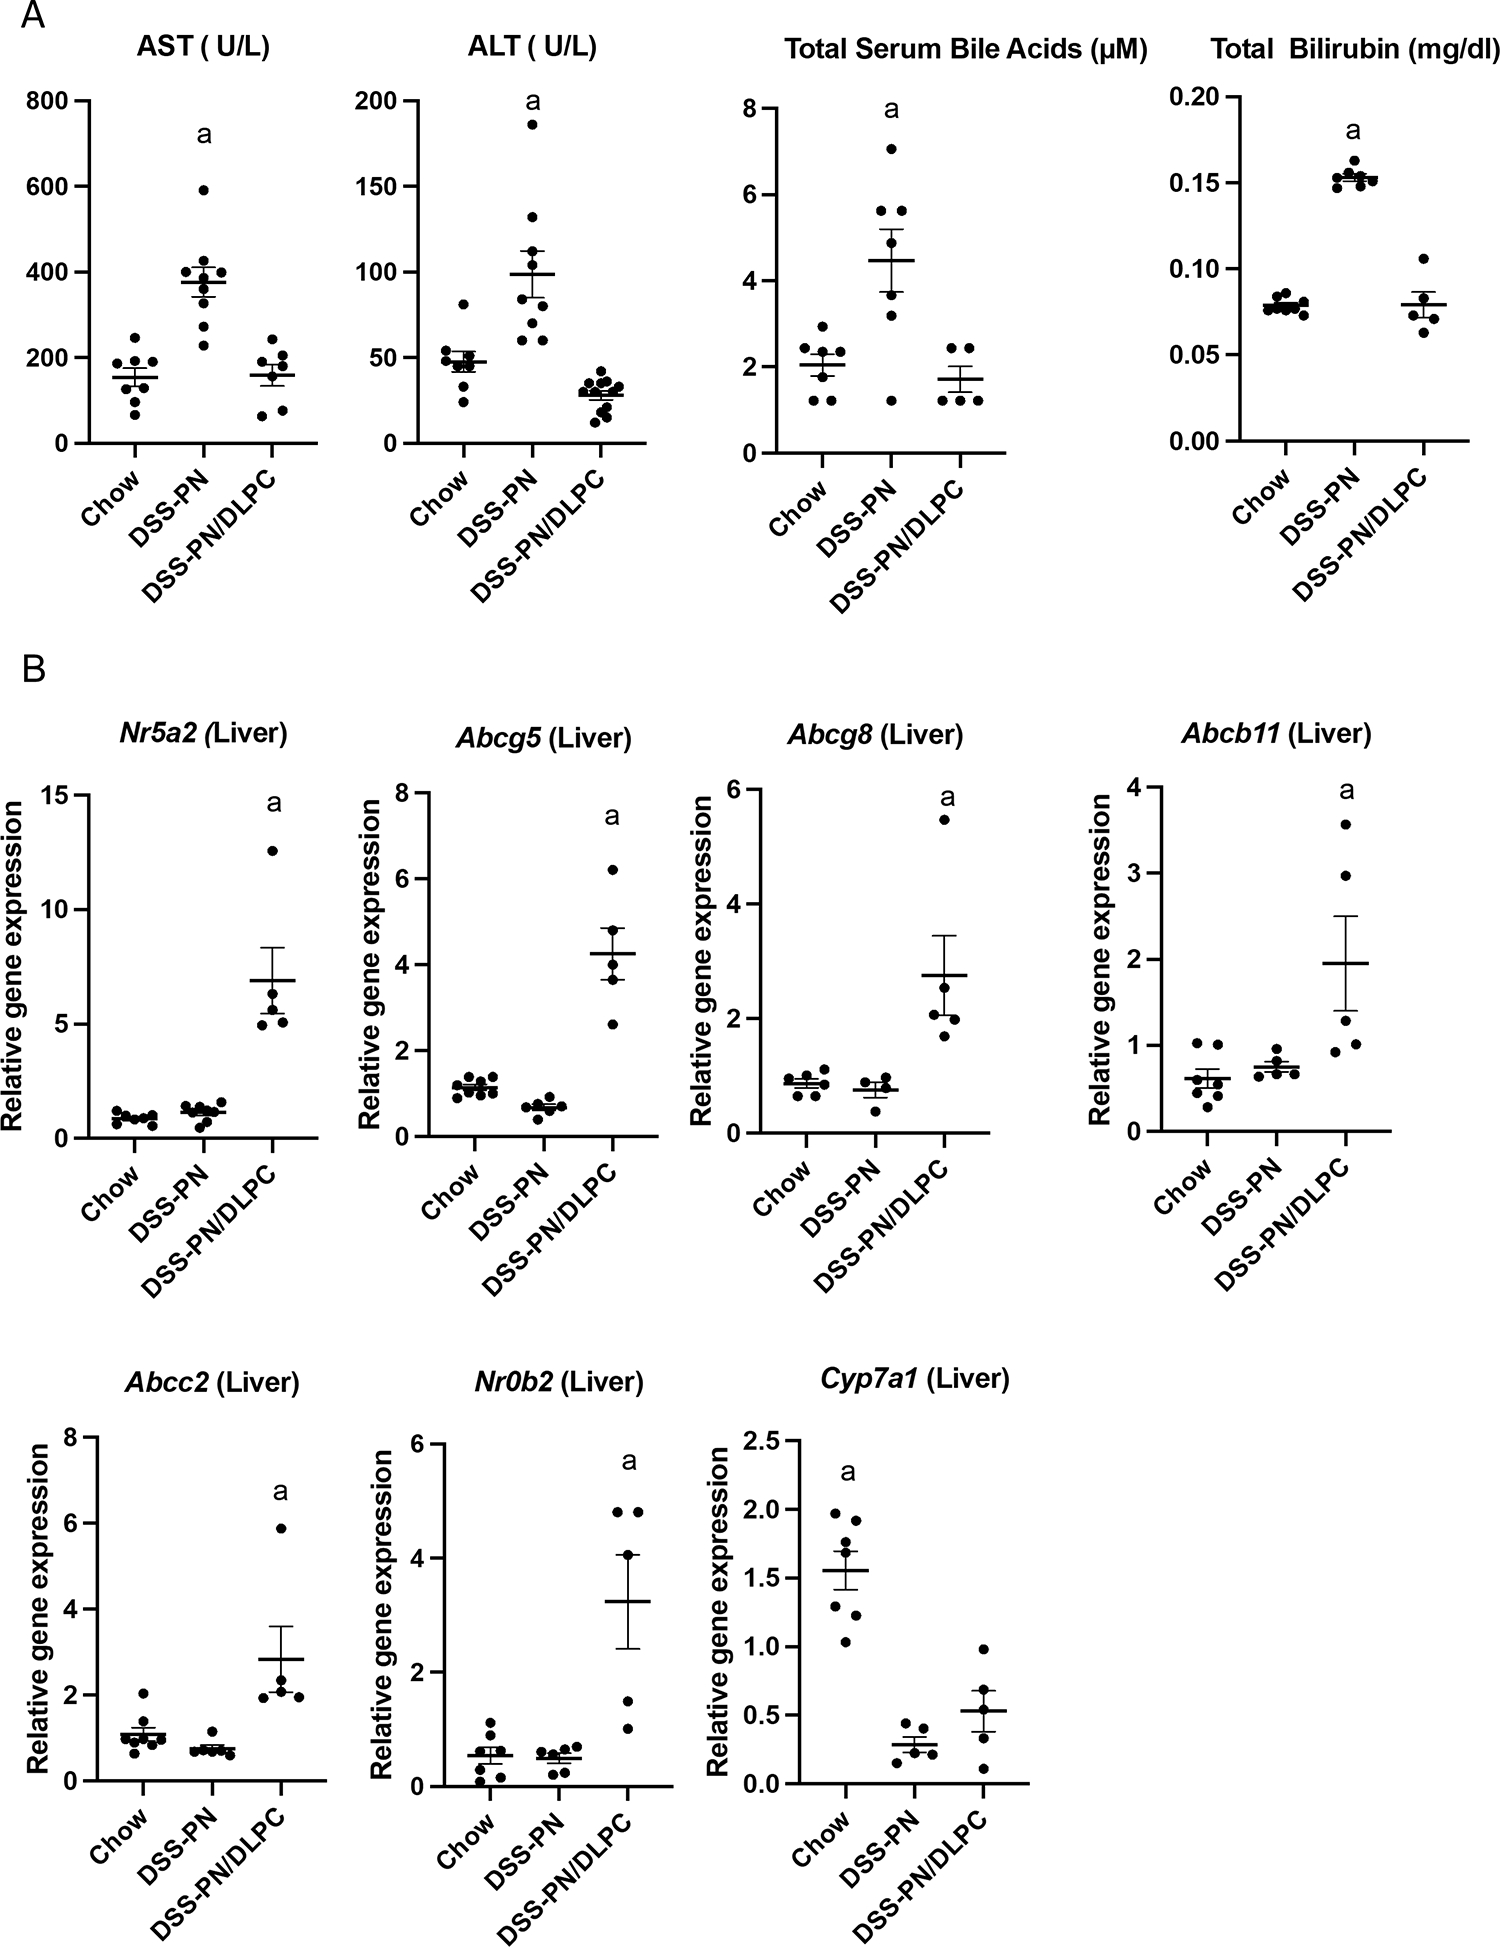
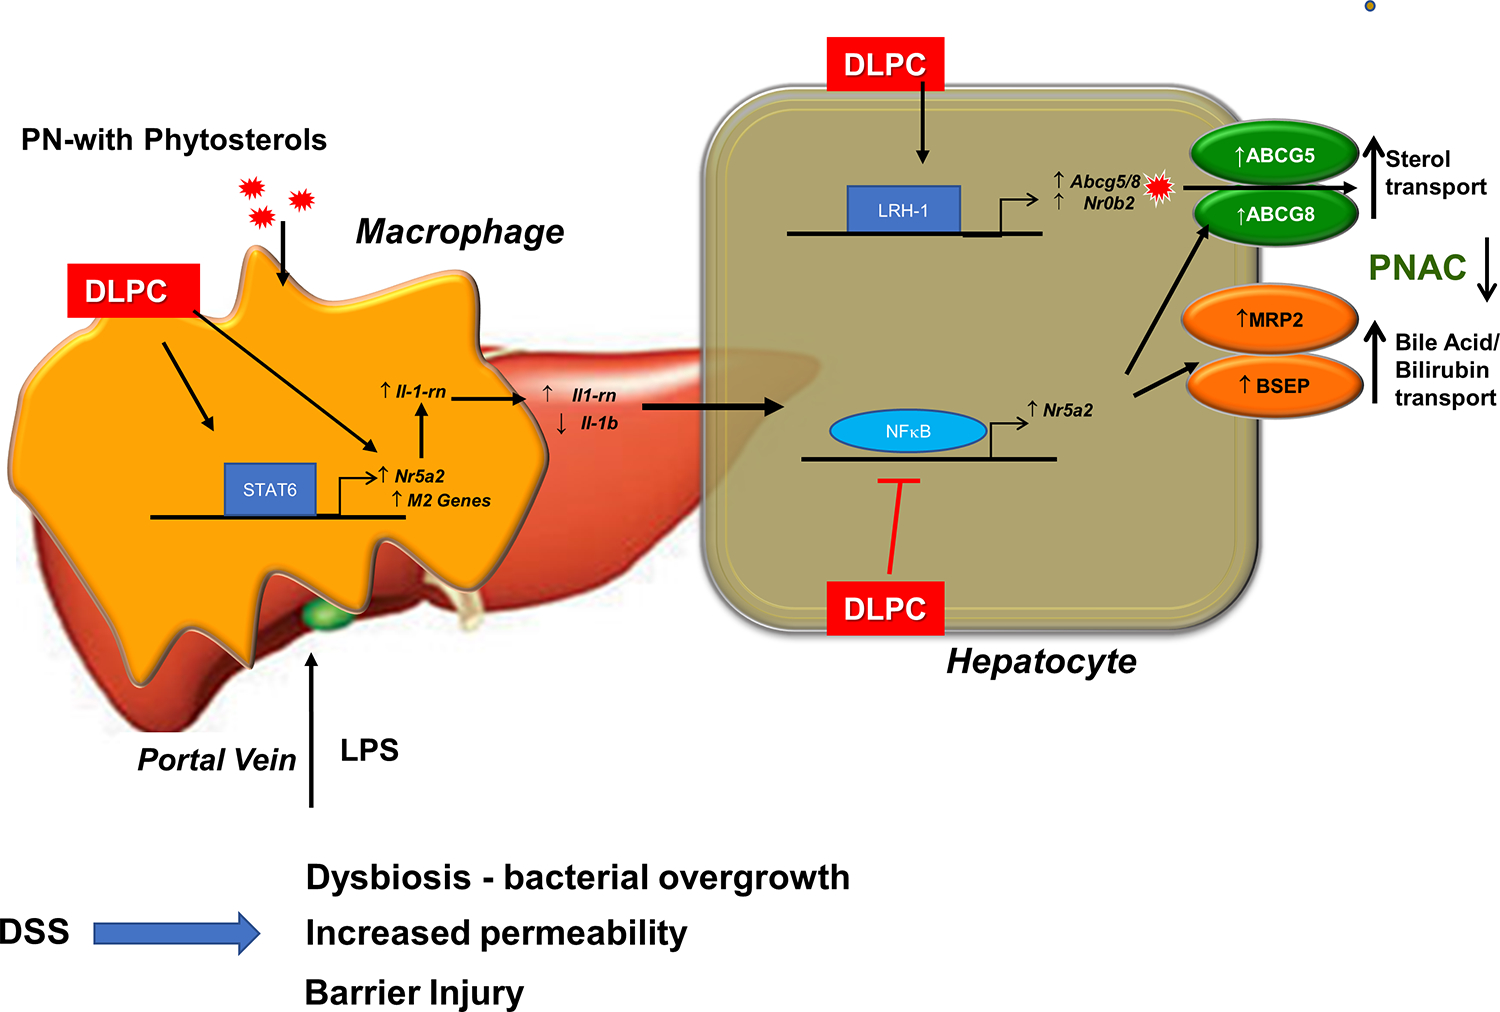
Background and aims: Parenteral nutrition-associated cholestasis (PNAC) is an important complication in patients with intestinal failure with reduced LRH-1 expression. Here, we hypothesized that LRH-1 activation by its agonist, dilauroylphosphatidylcholine (DLPC), would trigger signal transducer and activator of transcription 6 (STAT6) signaling and hepatic macrophage polarization that would mediate hepatic protection in PNAC.

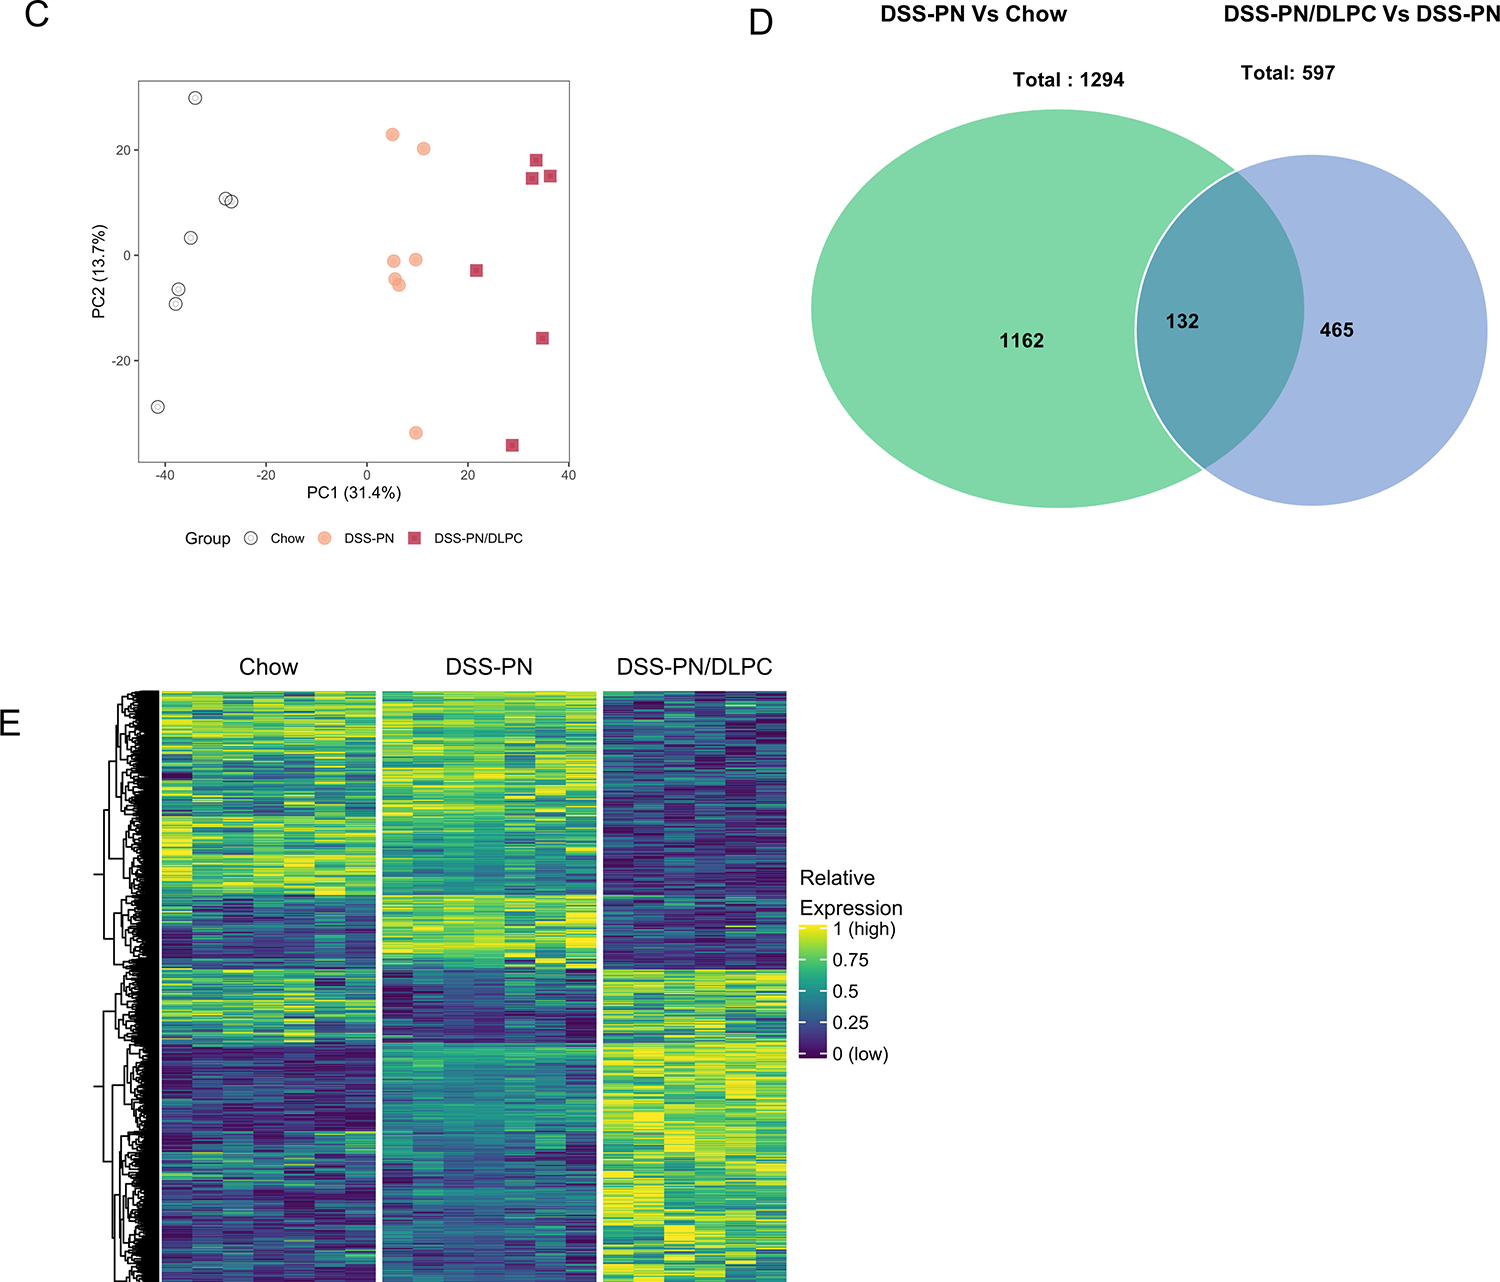
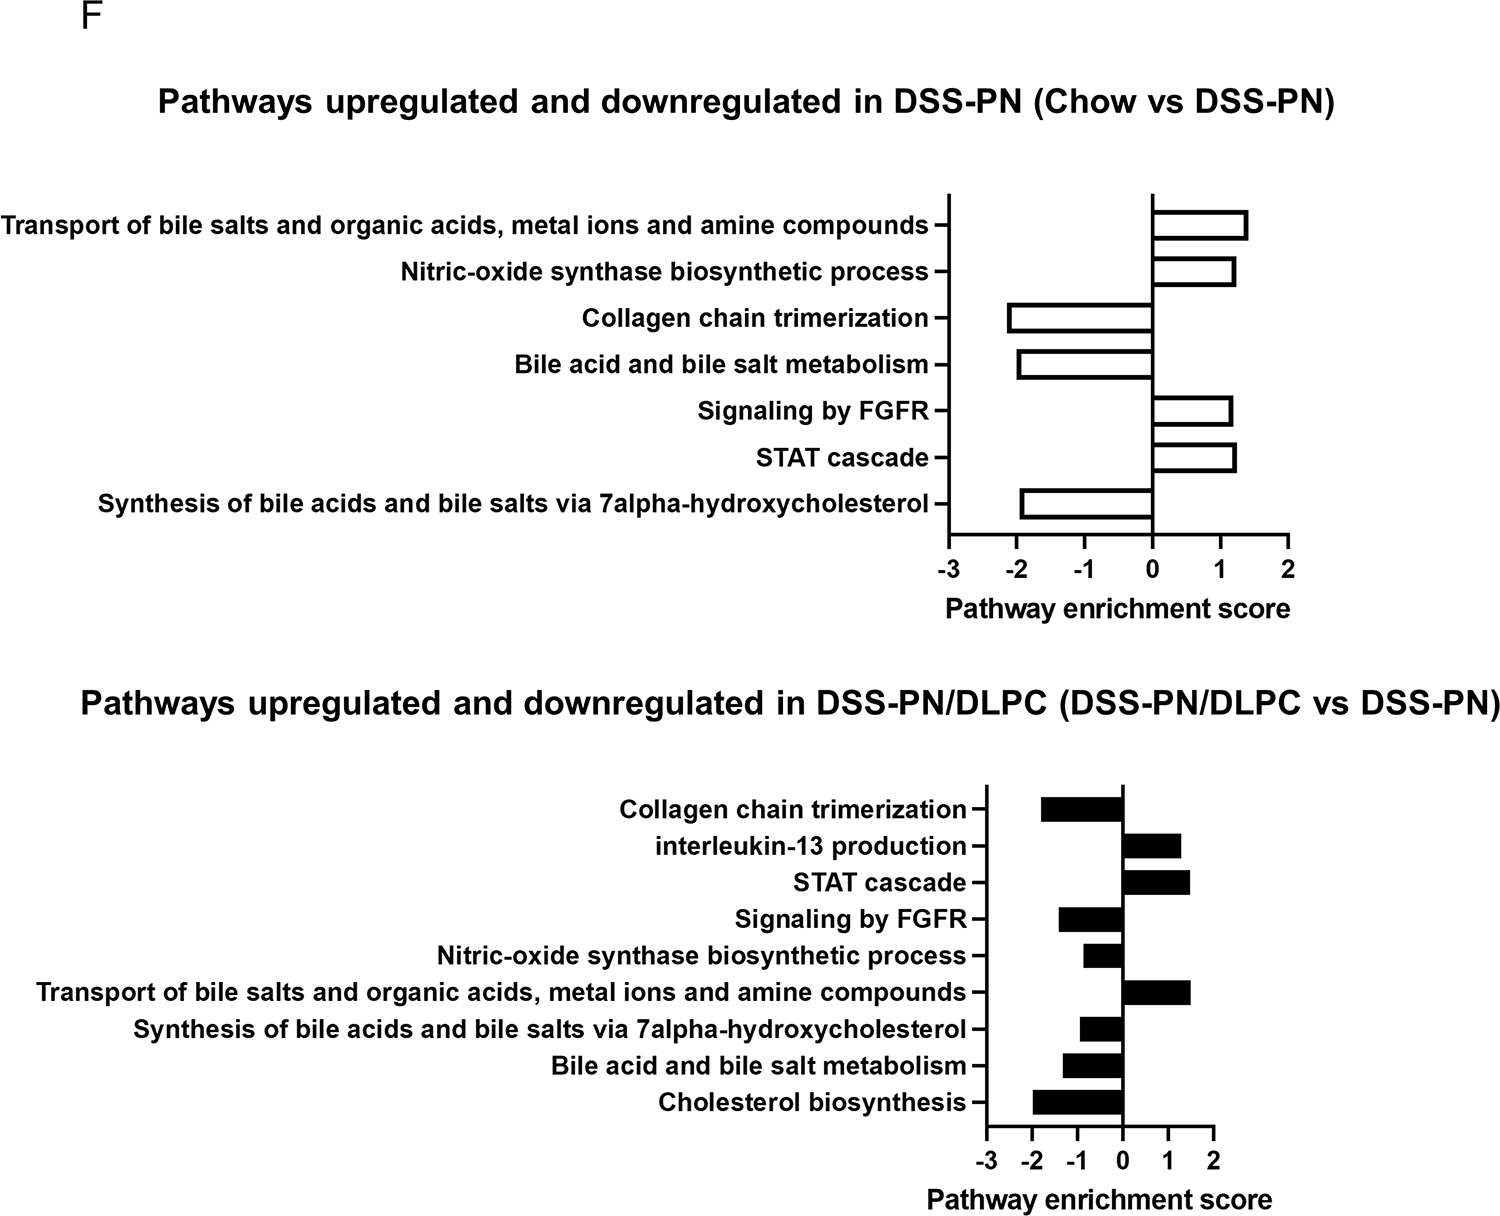
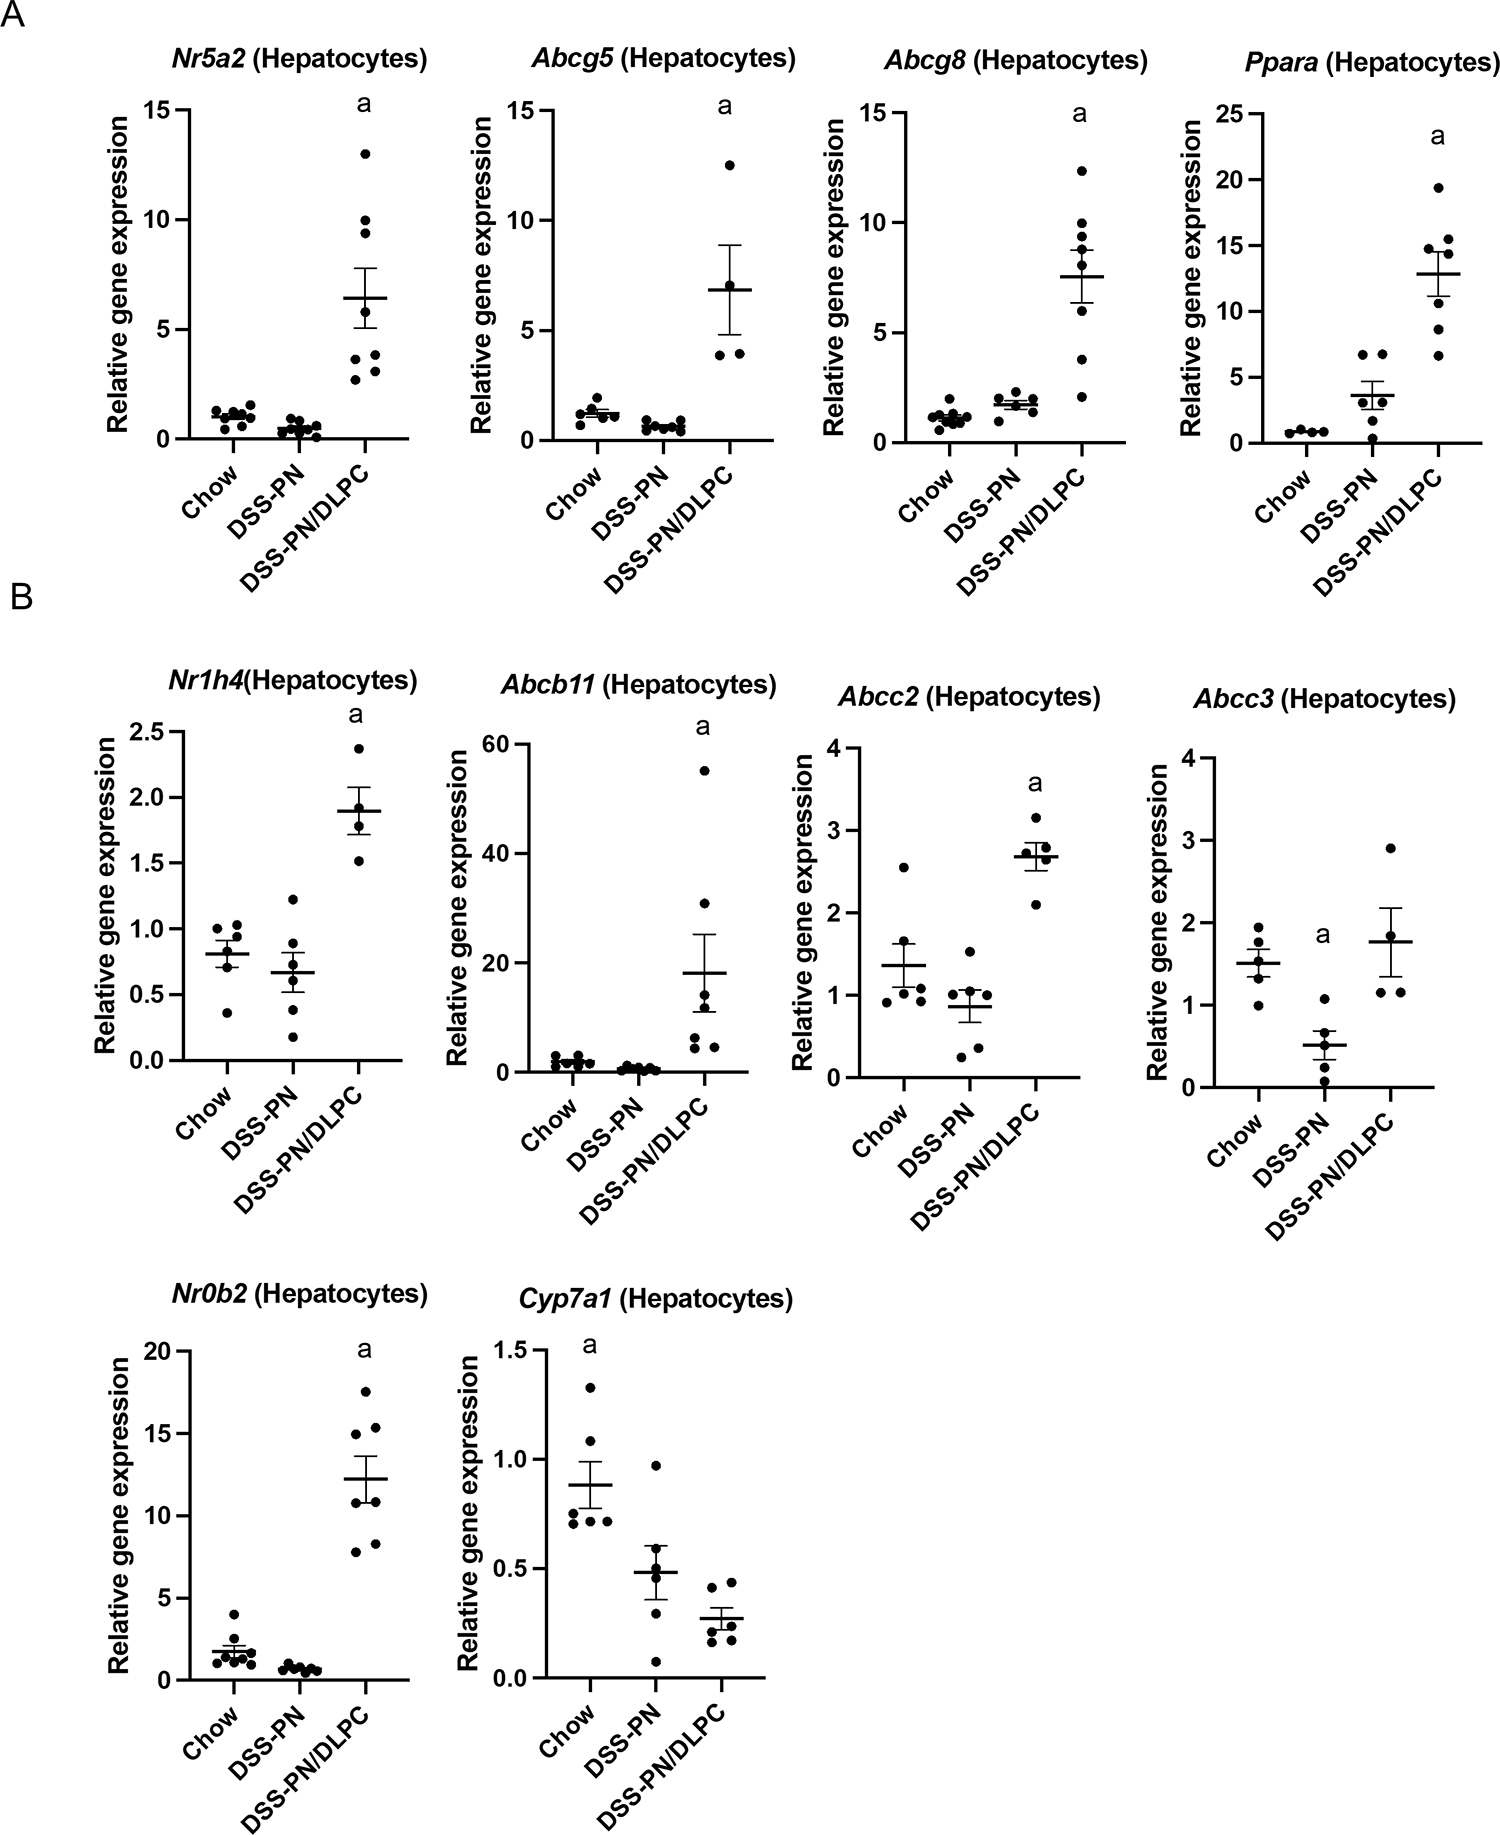
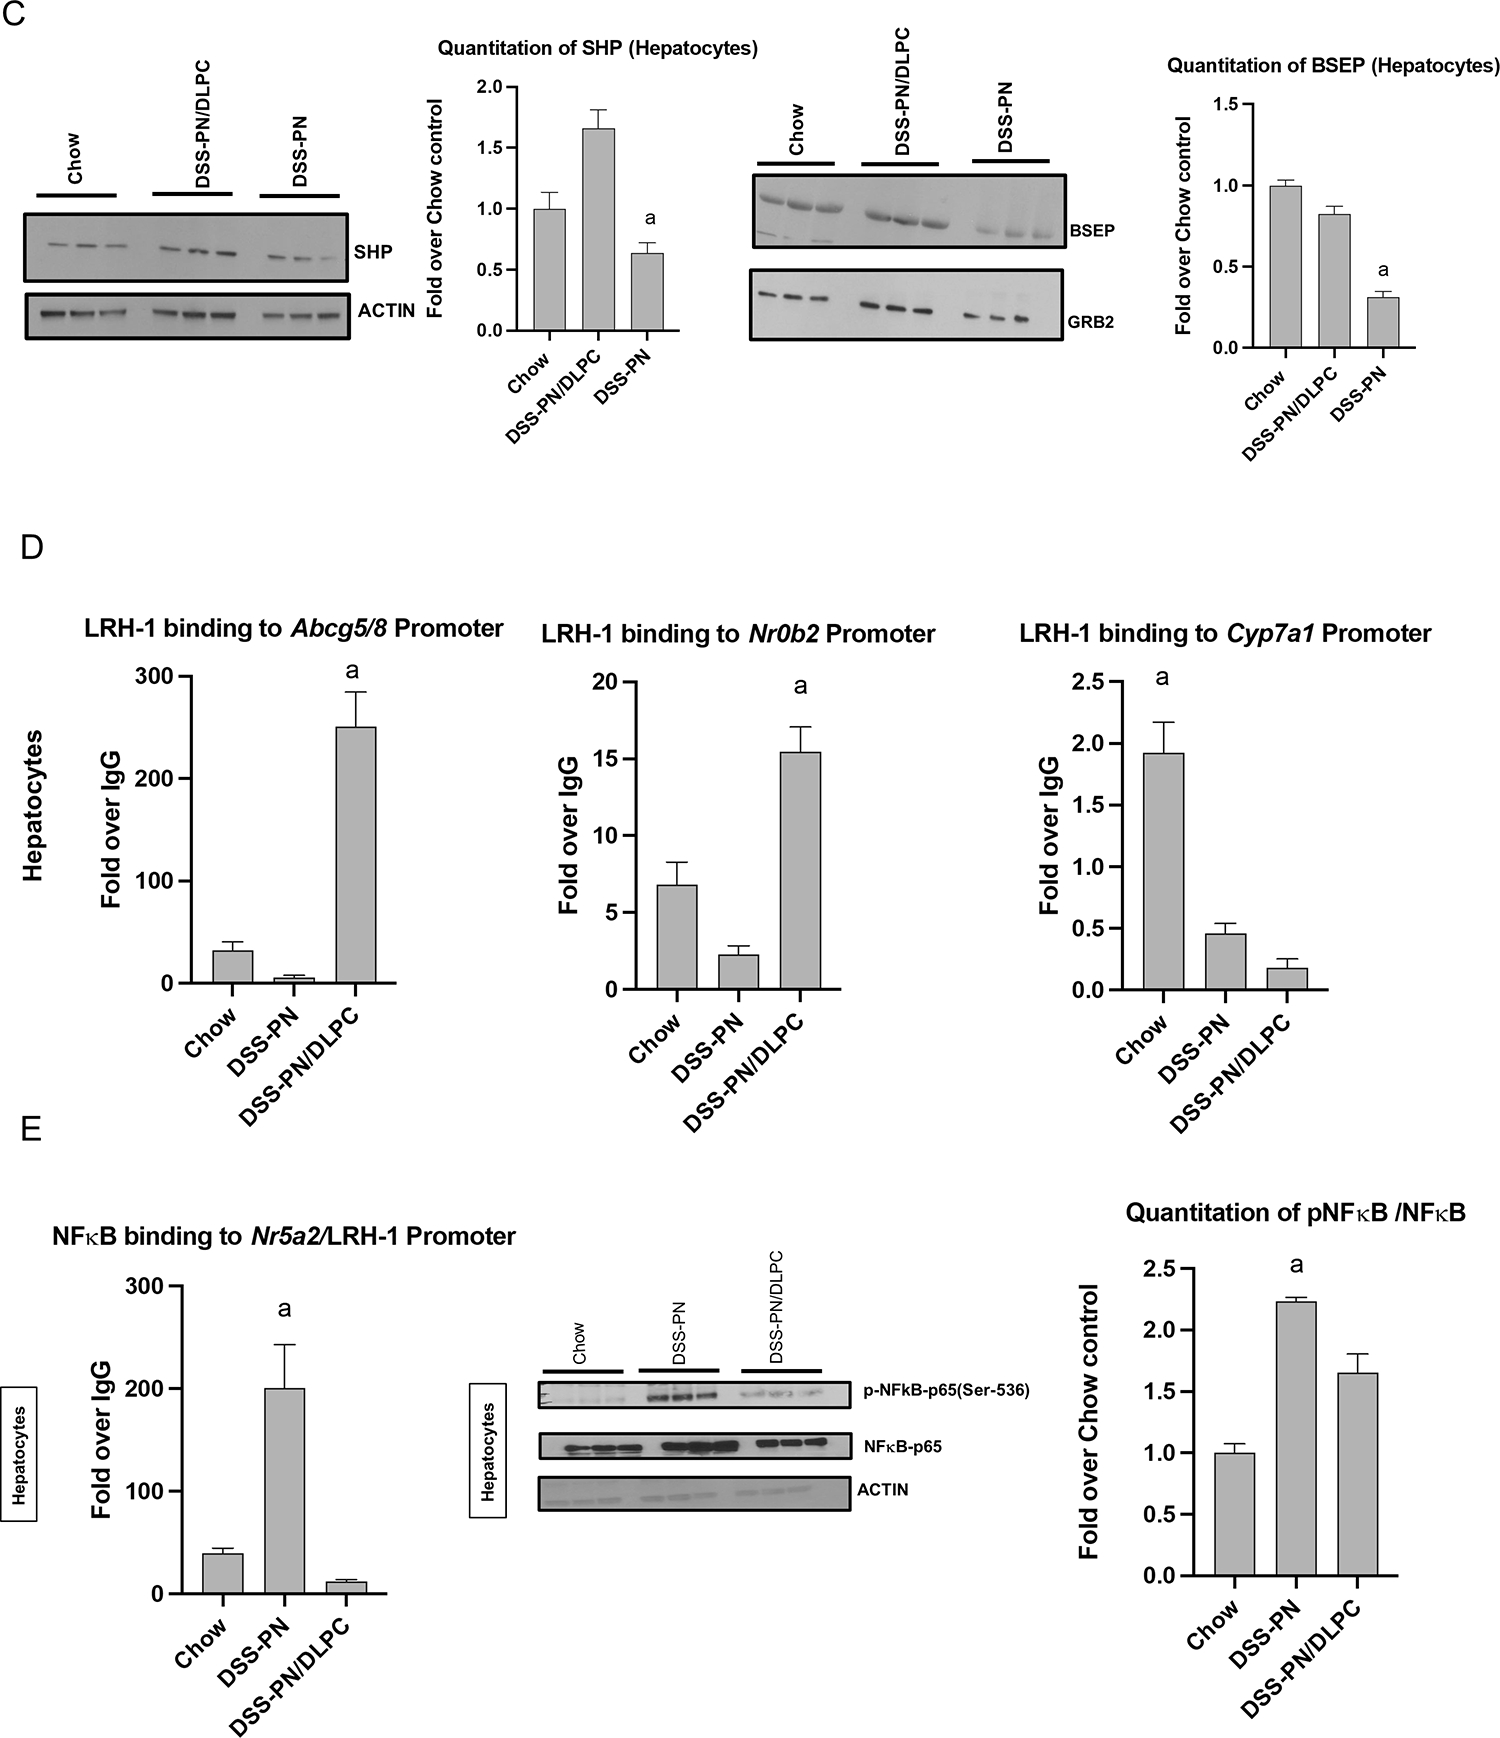
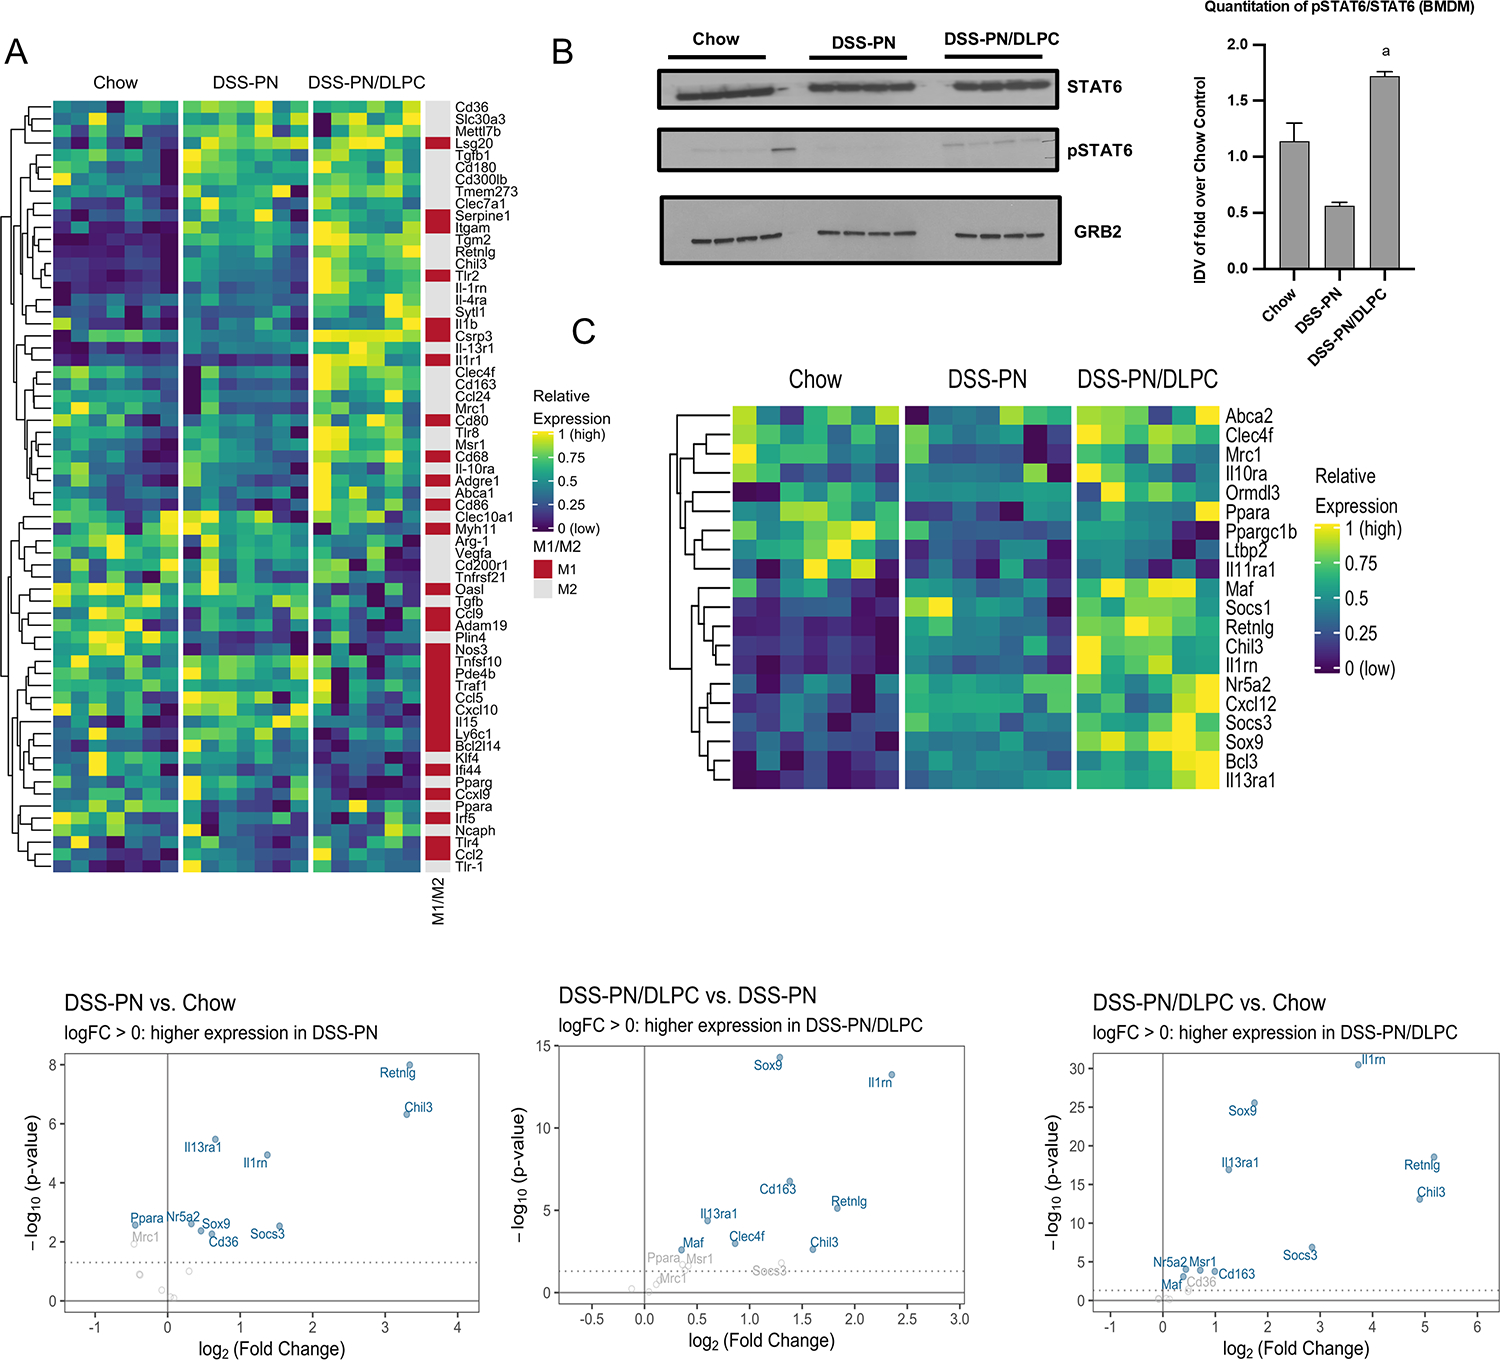
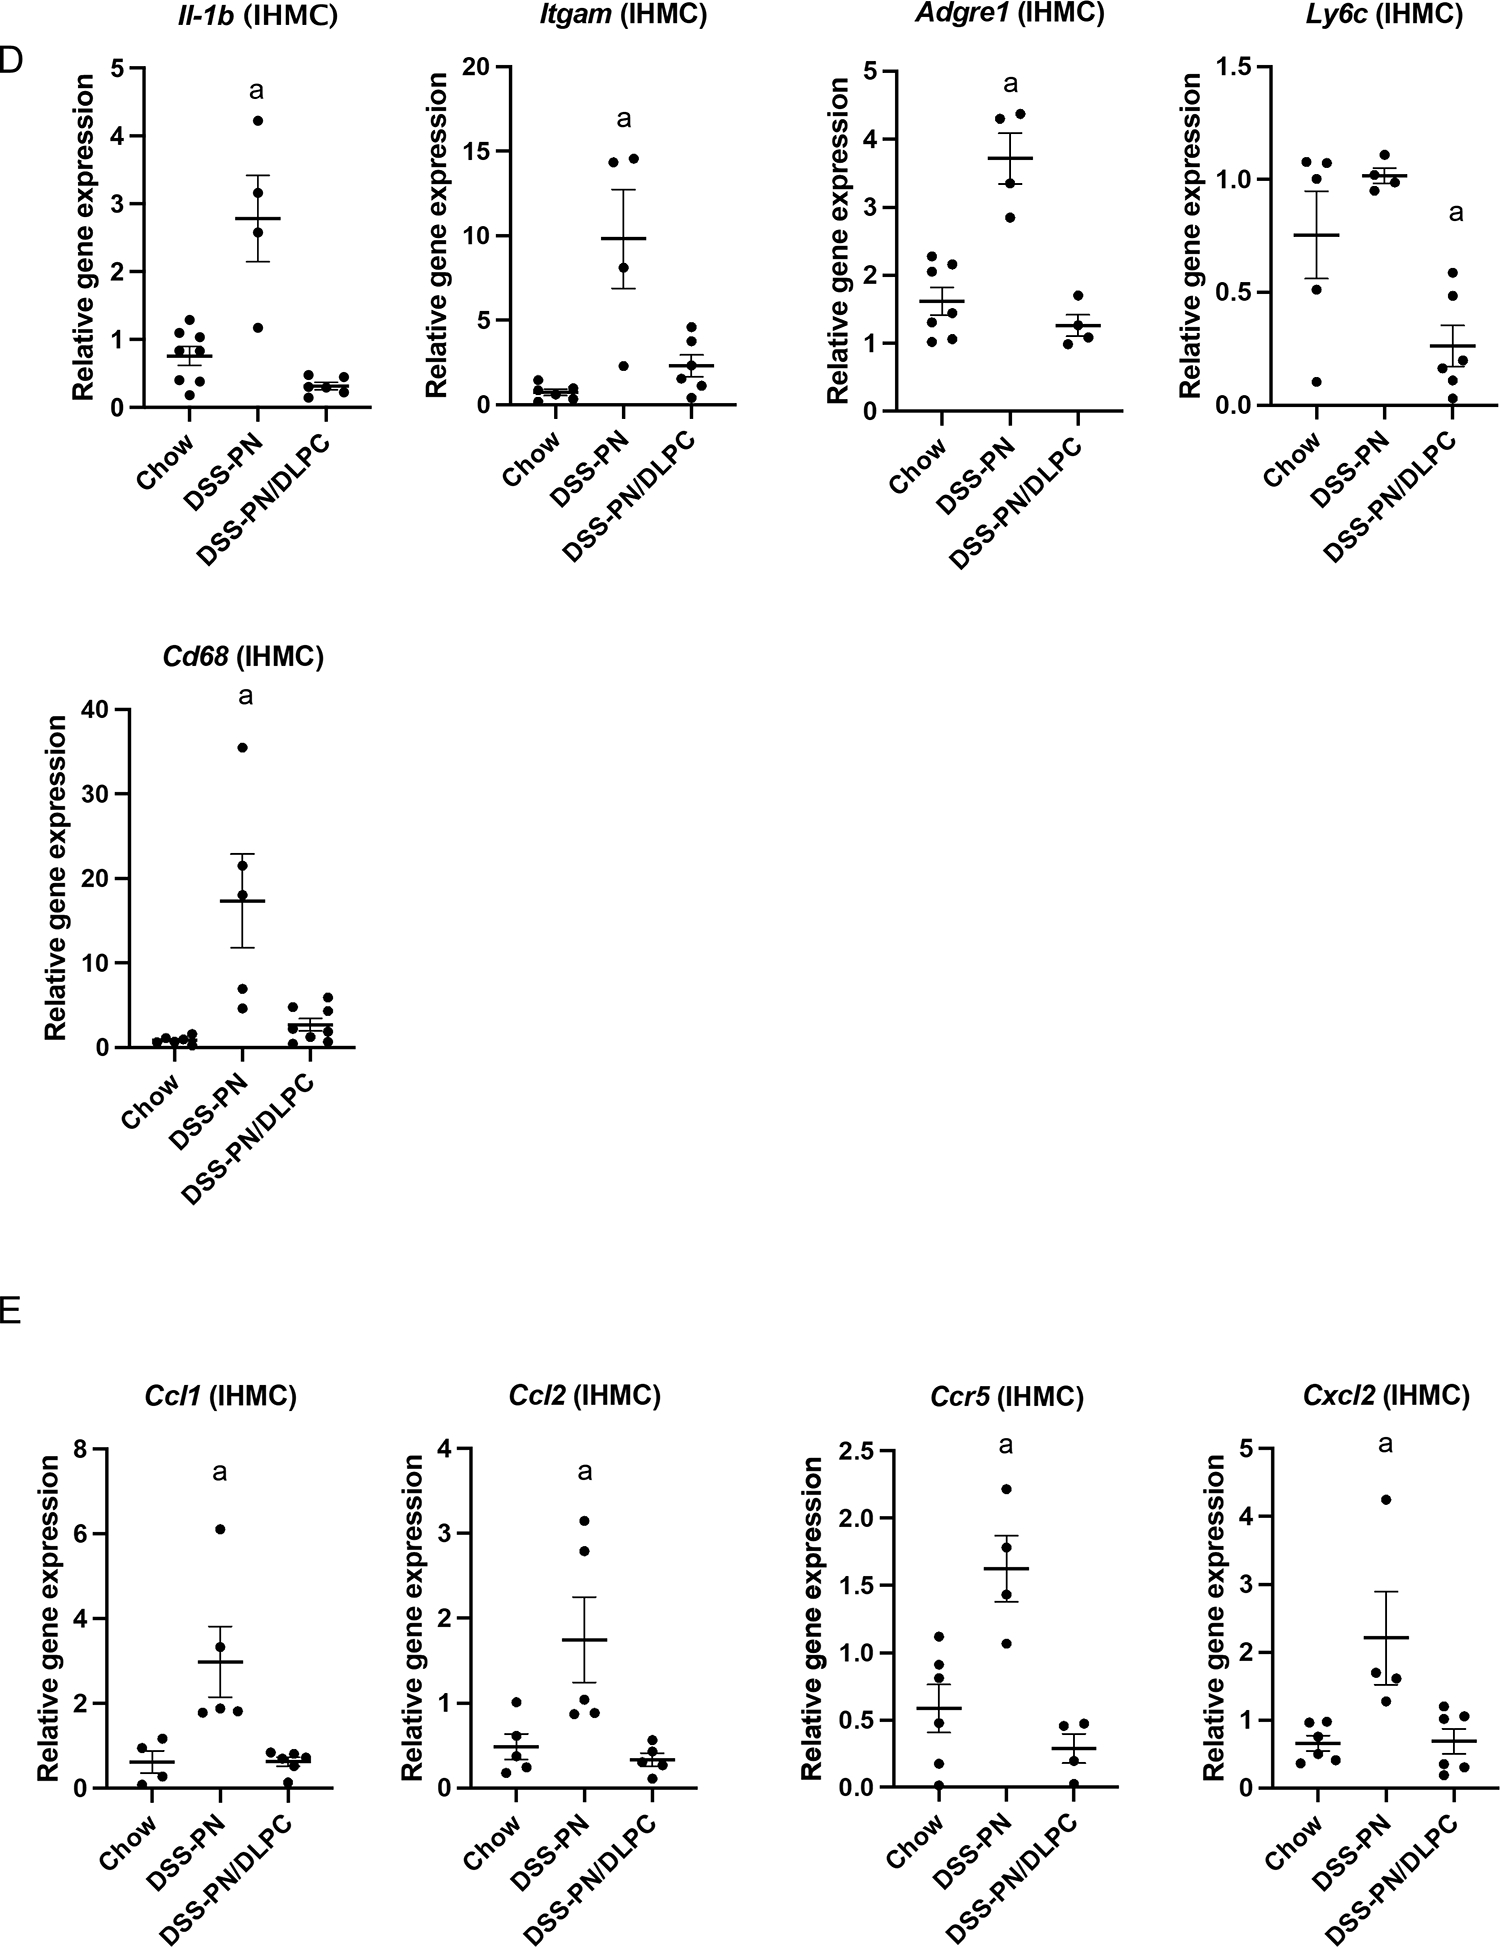
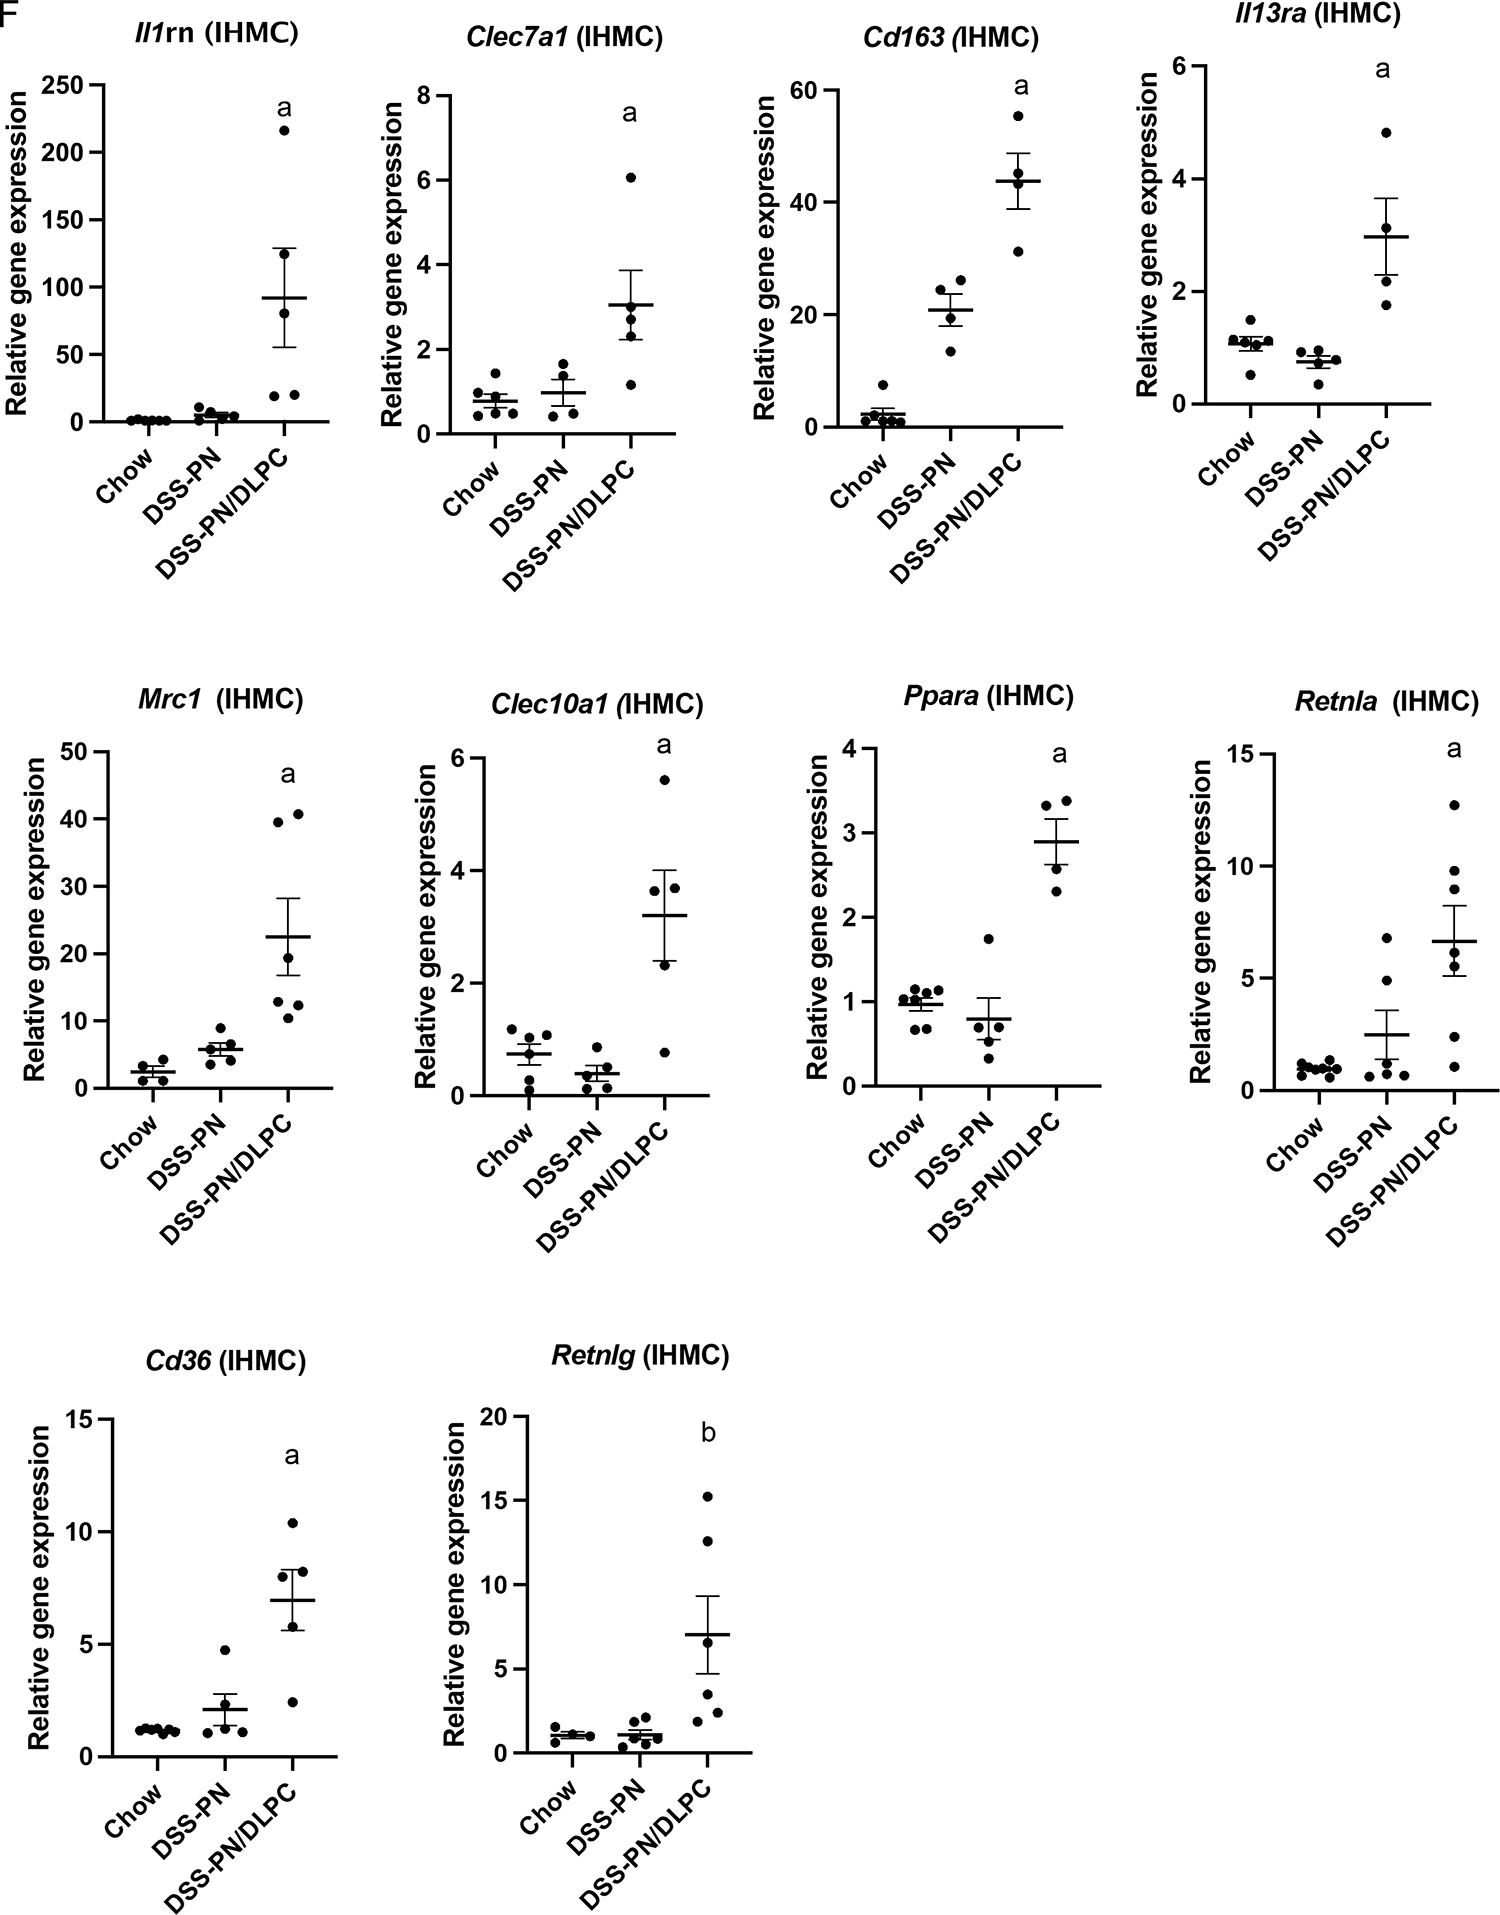
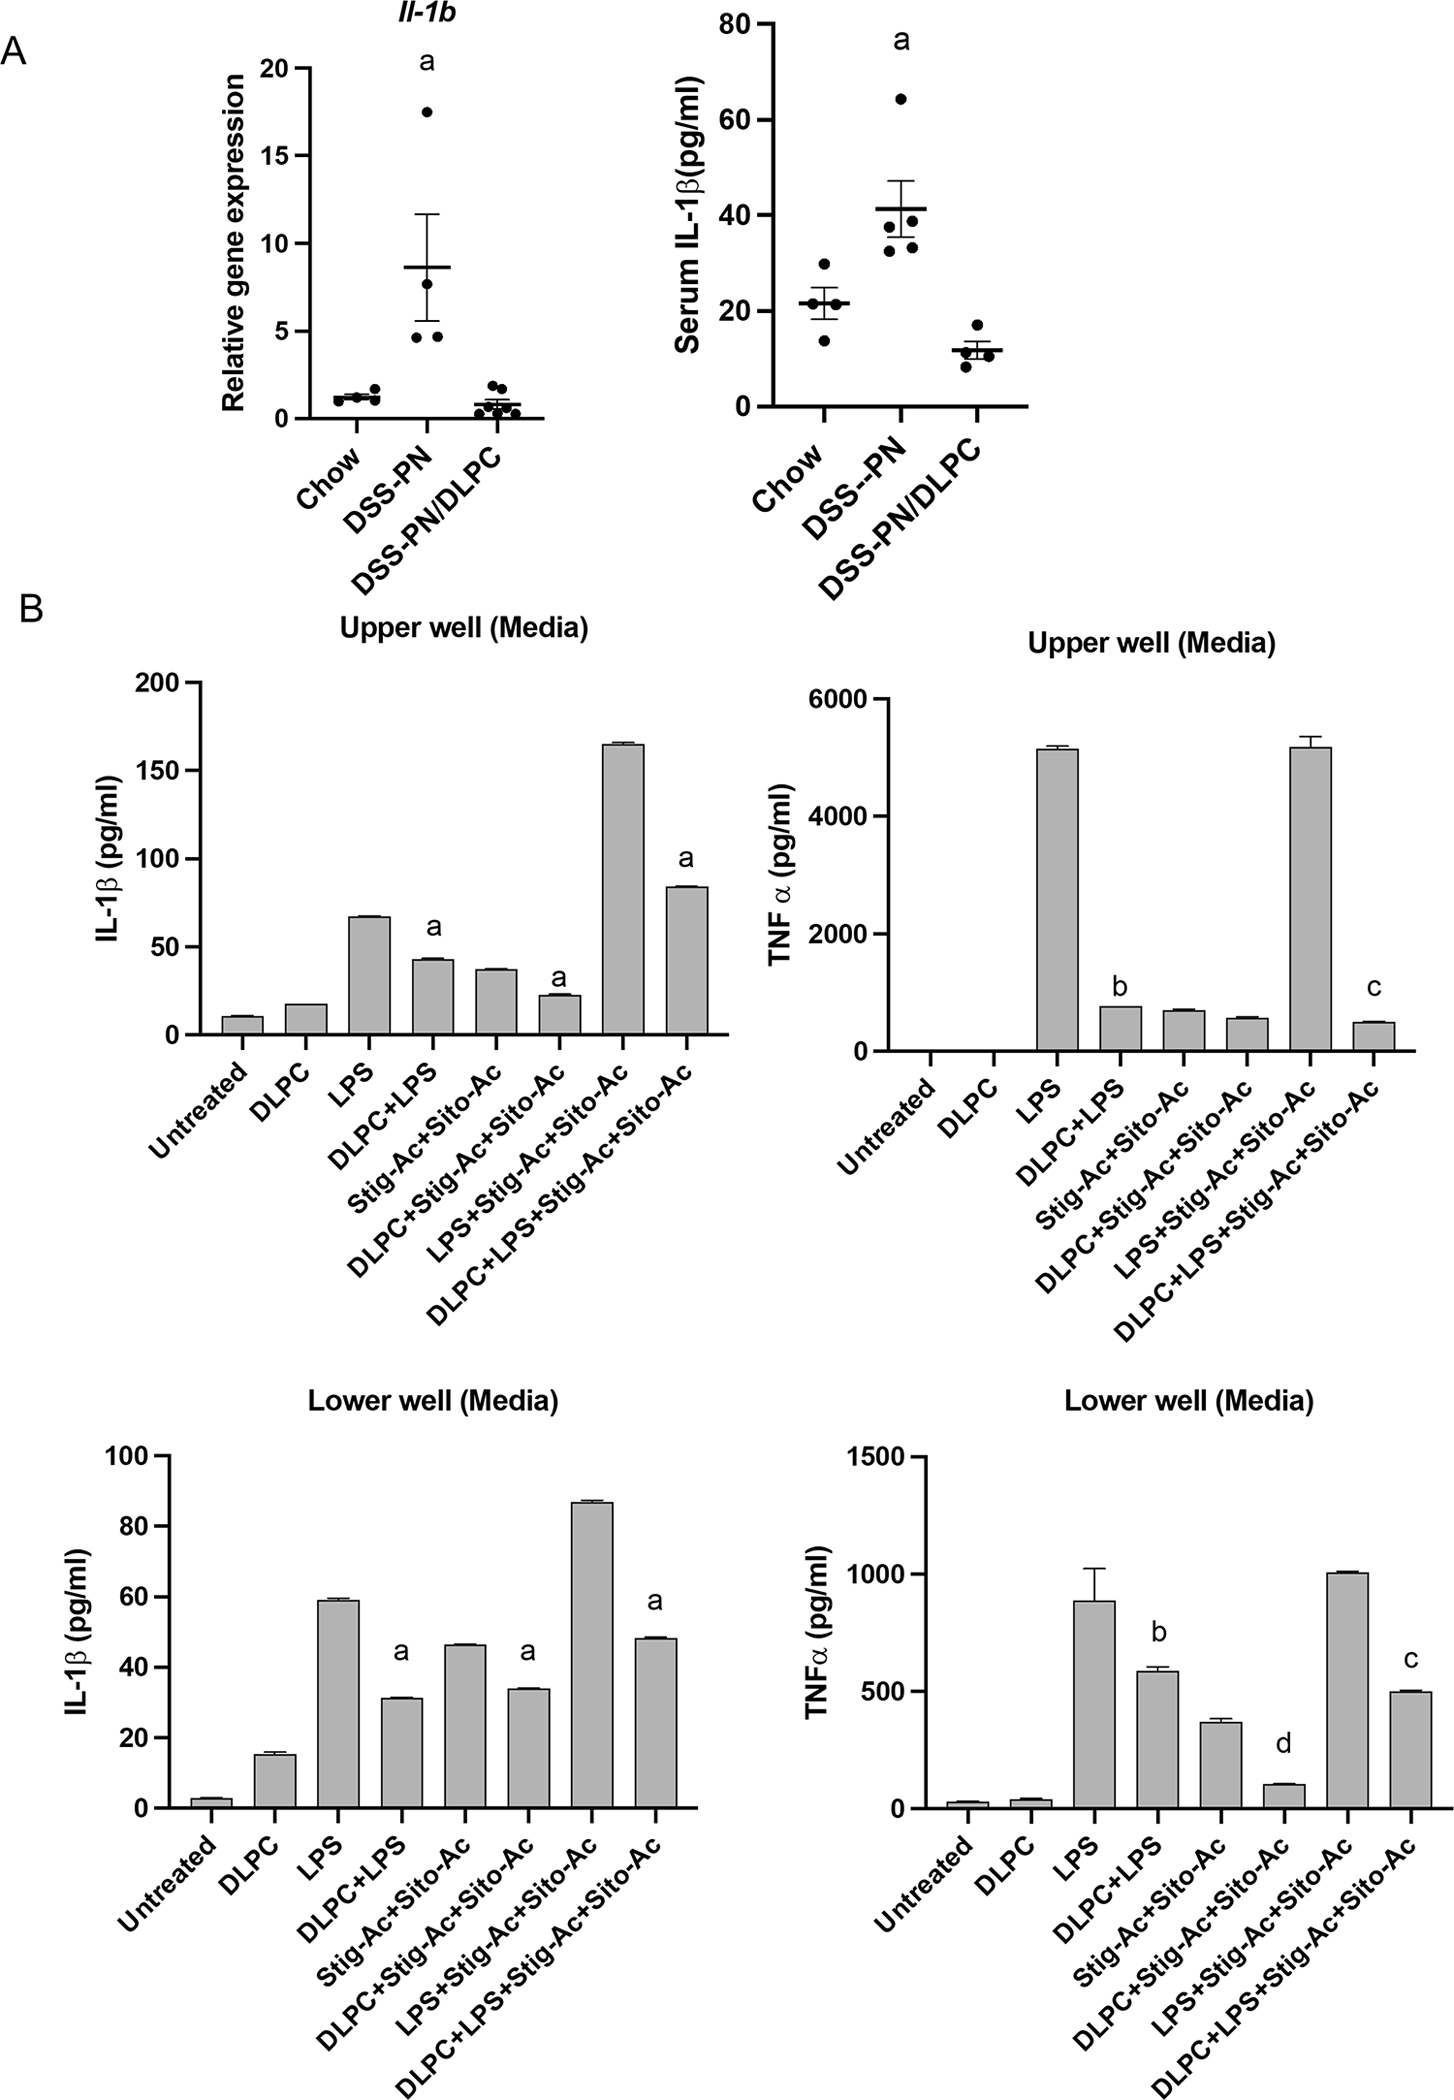
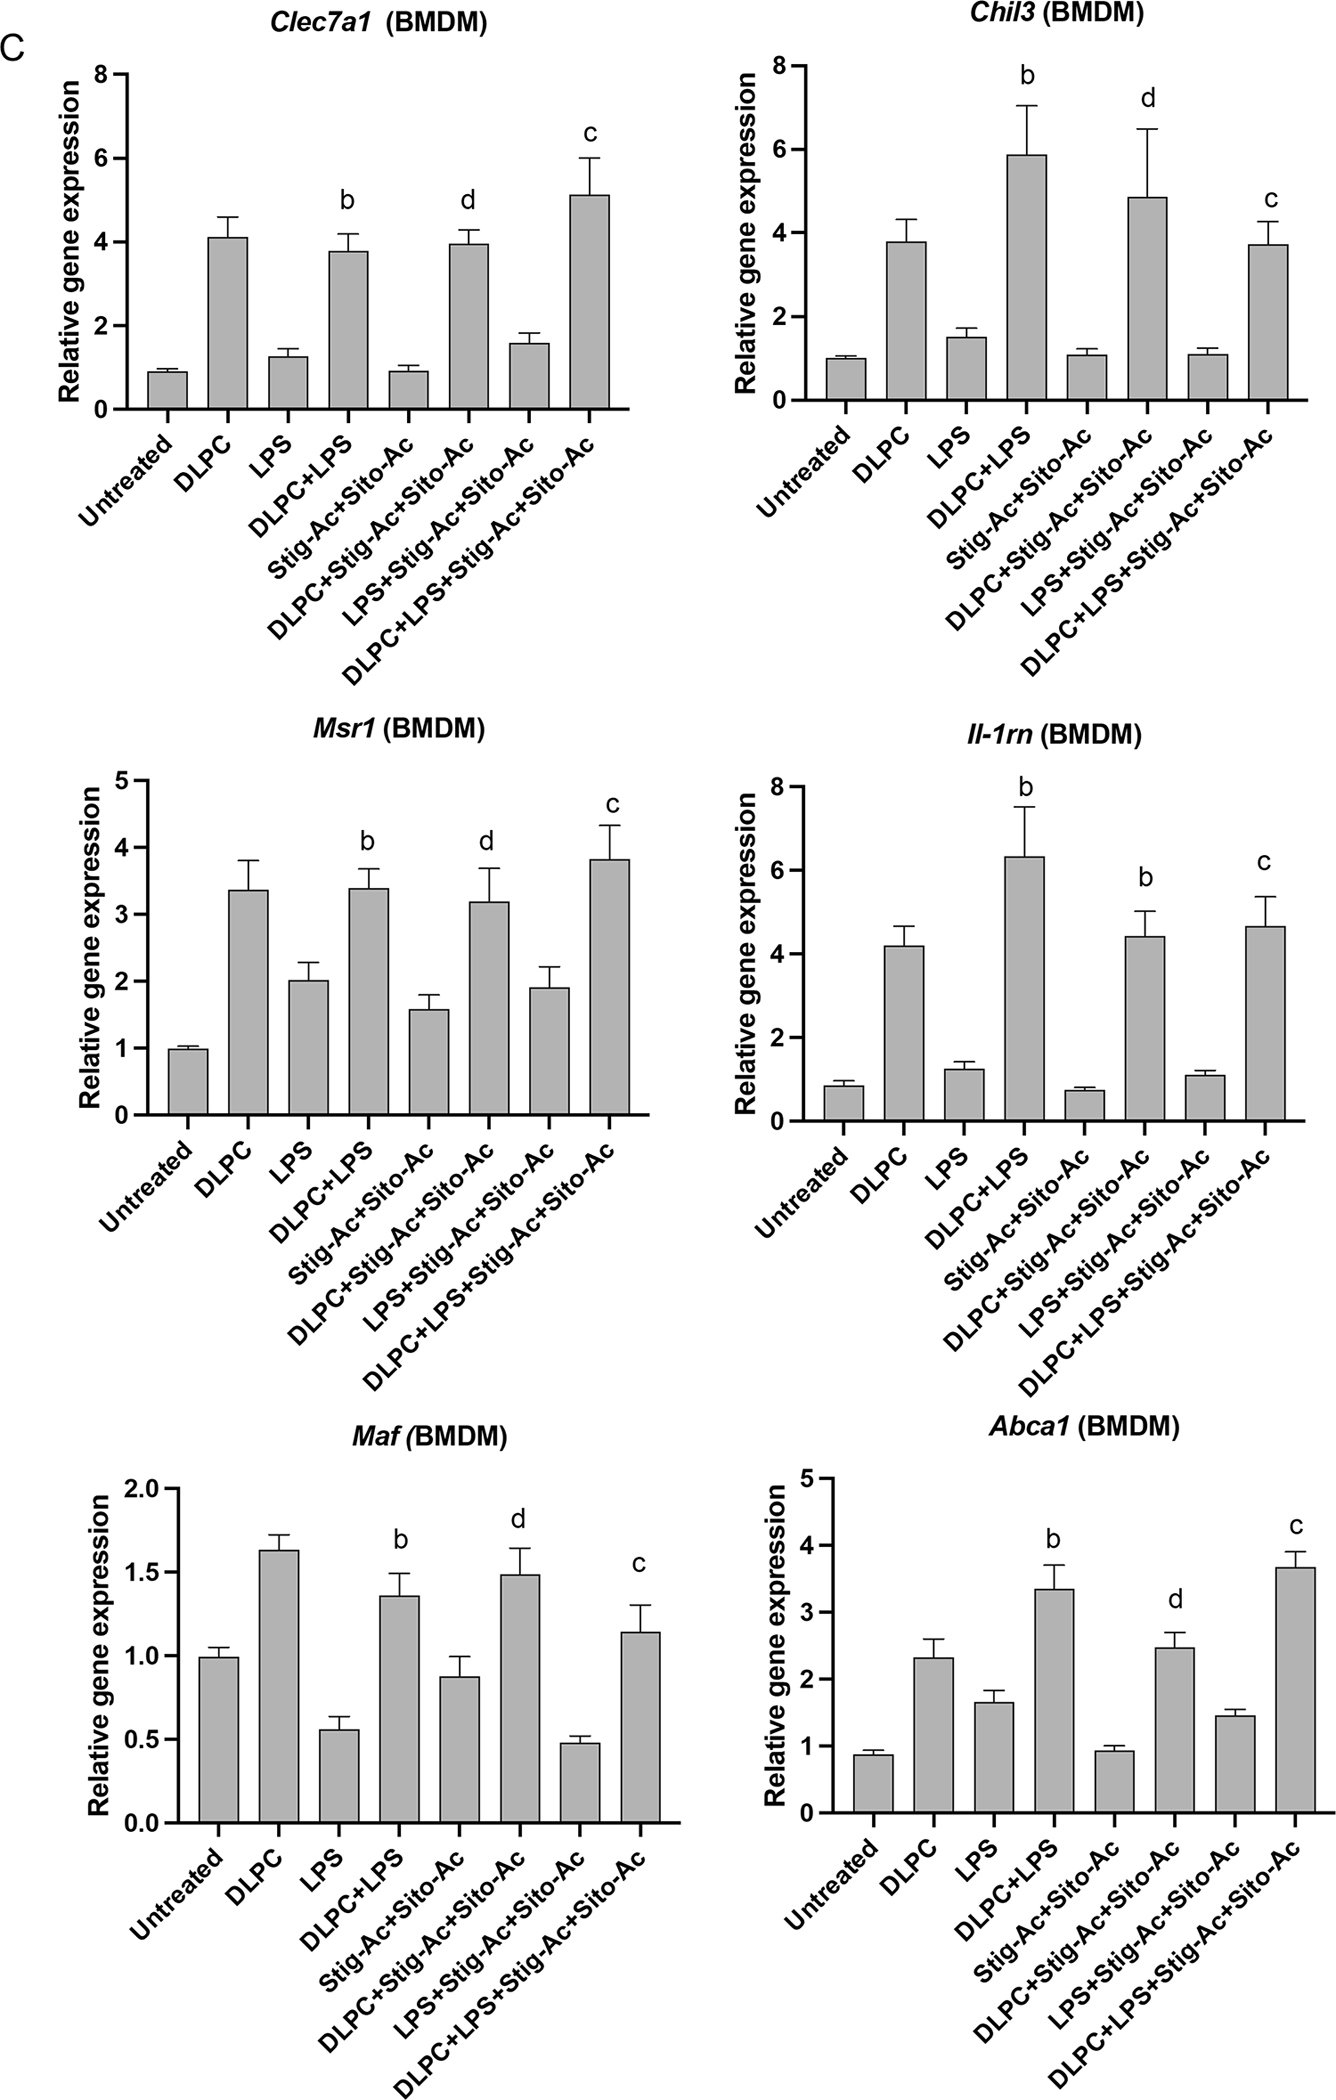
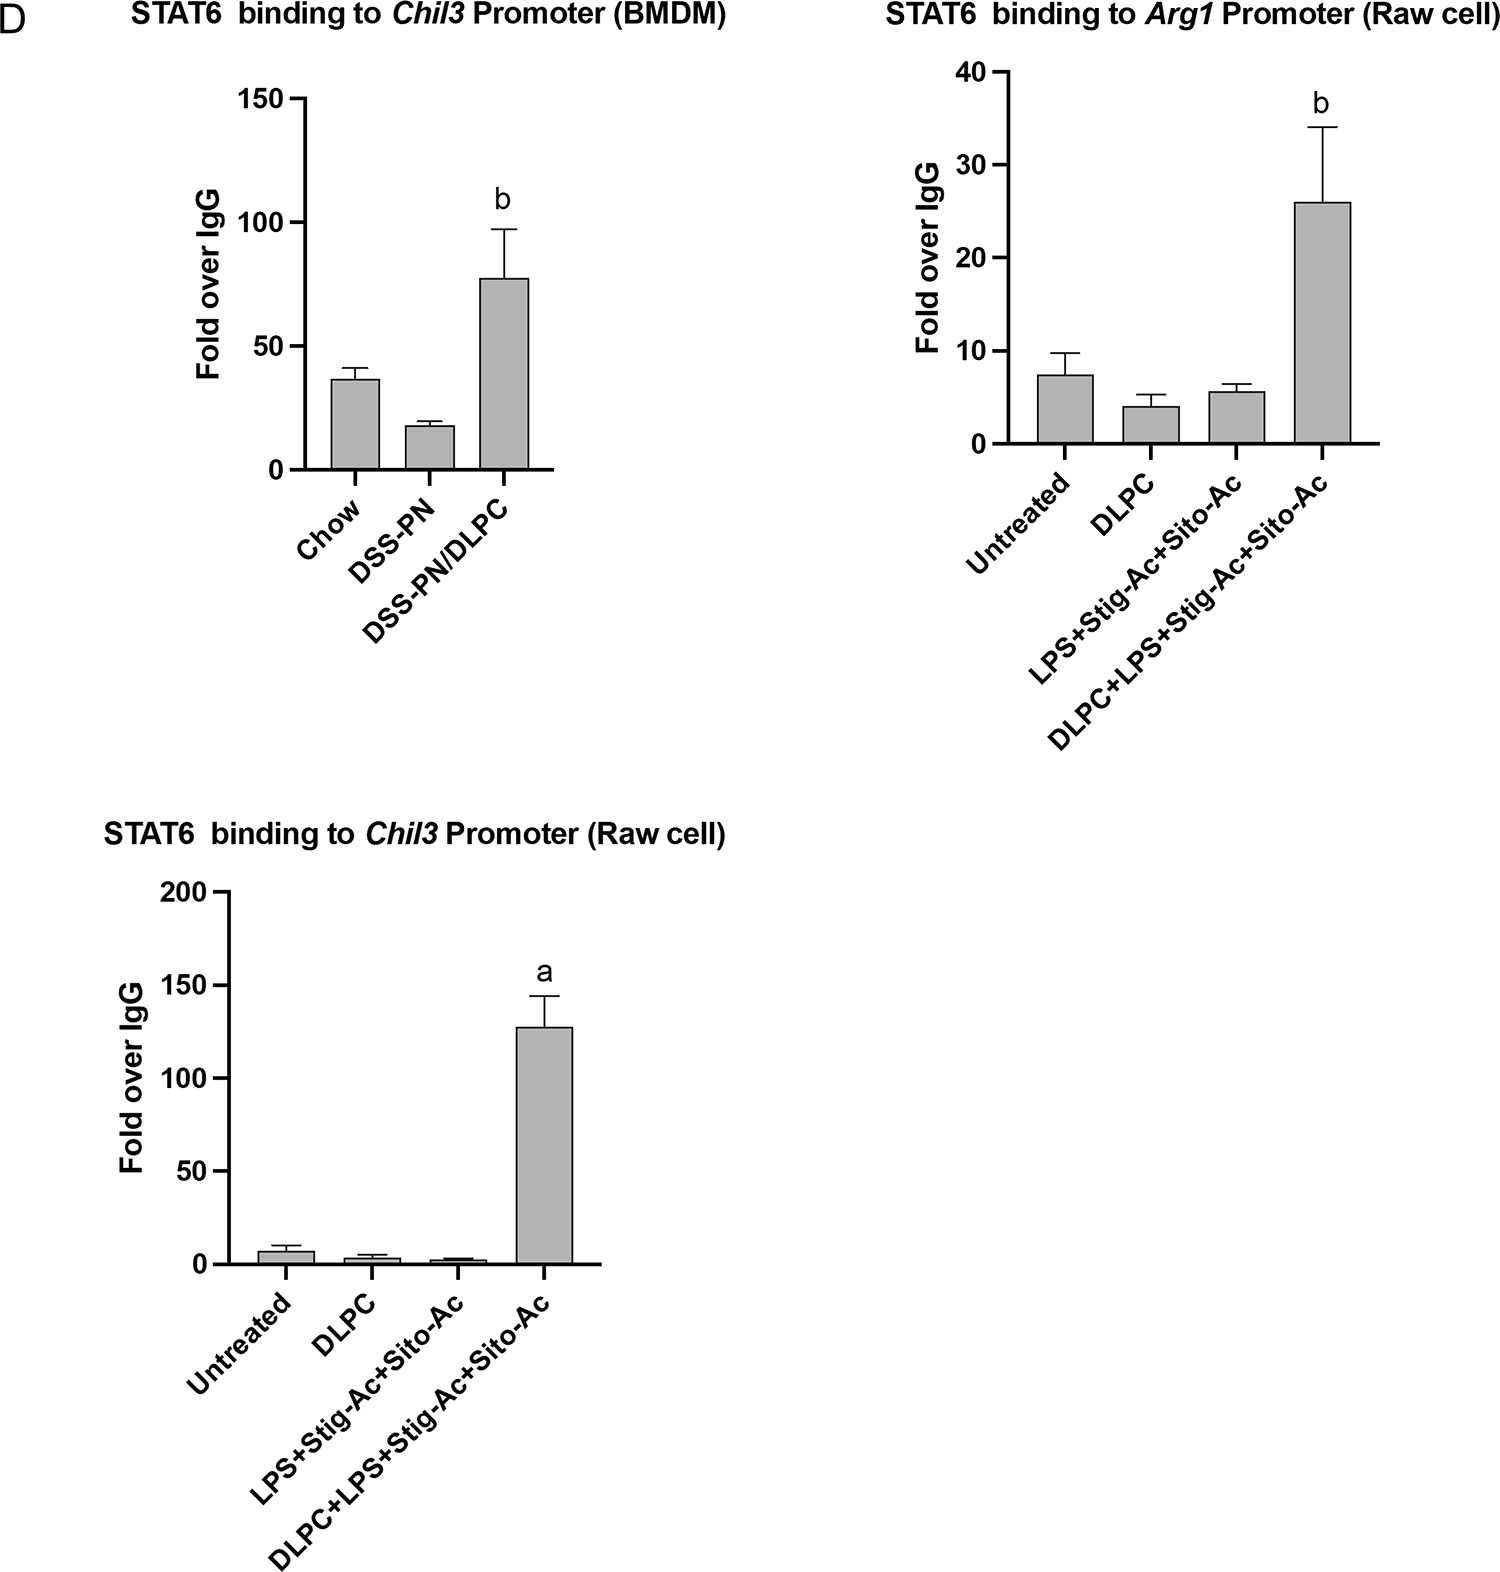
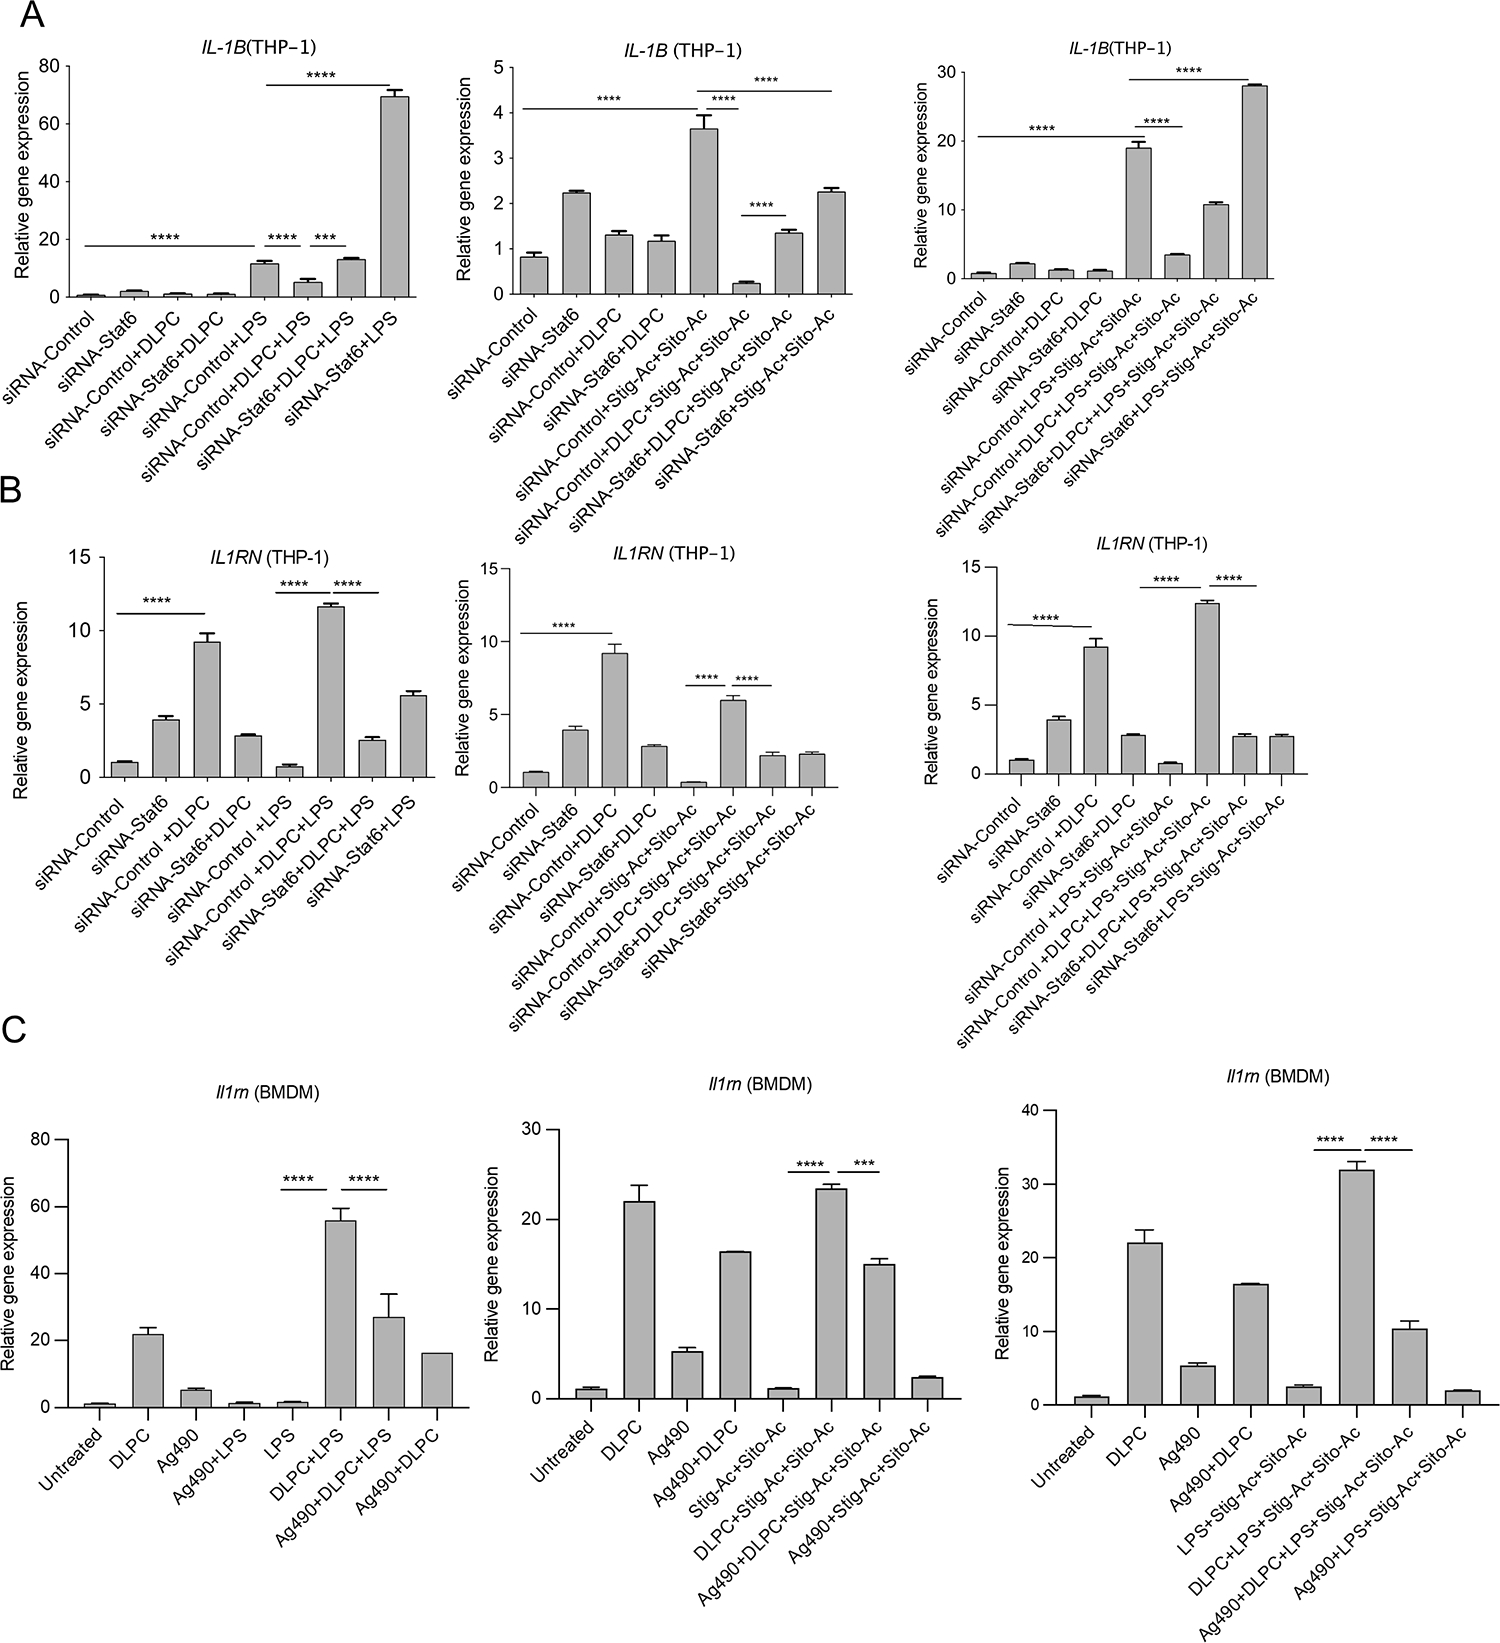
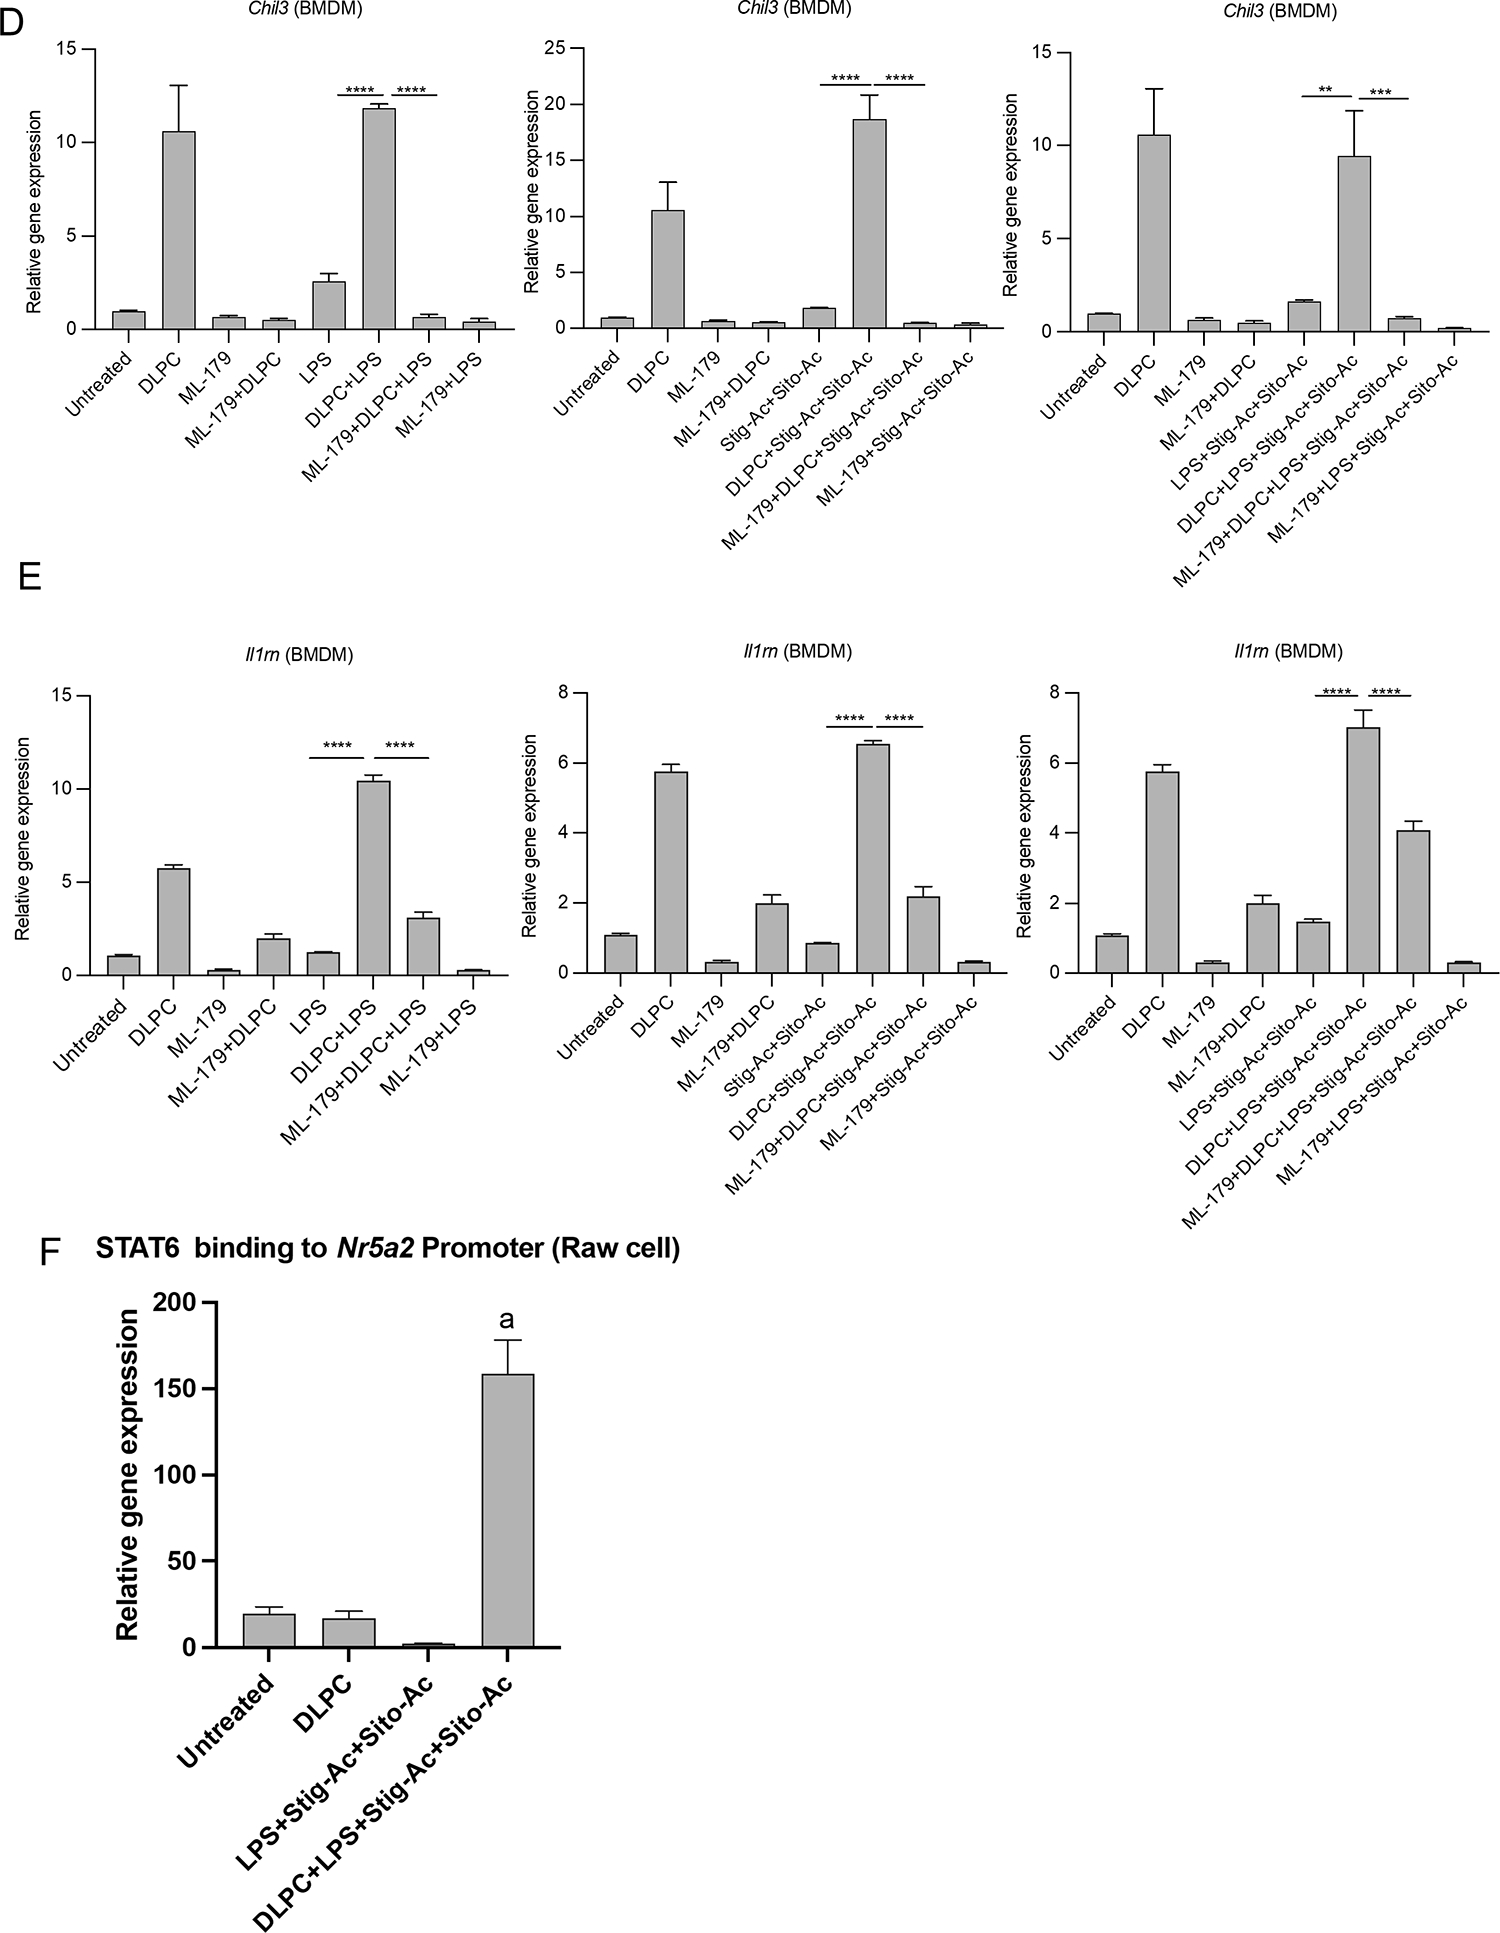
Approach and results: PNAC mouse model (oral DSSx4d followed by PNx14d; DSS-PN) was treated with LRH-1 agonist DLPC (30 mg/kg/day) intravenously. DLPC treatment prevented liver injury and cholestasis while inducing hepatic mRNA expression of Nr5a2 (nuclear receptor subfamily 5 group A member 2), Abcb11 (ATP binding cassette subfamily B member 11), Abcg5 (ATP-binding cassette [ABC] transporters subfamily G member 5), Abcg8 (ATP-binding cassette [ABC] transporters subfamily G member 8), nuclear receptor subfamily 0, and ATP-binding cassette subfamily C member 2 ( Abcc2) mRNA, all of which were reduced in PNAC mice. To determine the mechanism of the DLPC effect, we performed RNA-sequencing analysis of the liver from Chow, DSS-PN, and DSS-PN/DLPC mice, which revealed DLPC upregulation of the anti-inflammatory STAT6 pathway. In intrahepatic mononuclear cells or bone-marrow derived macrophages (BMDM) from PNAC mice, DLPC treatment prevented upregulation of pro-inflammatory (M1) genes, suppressed activation of NFκB and induced phosphorylation of STAT6 and its target genes, indicating M2 macrophage polarization. In vitro, incubation of DLPC with cultured macrophages showed that the increased Il-1b and Tnf induced by exposure to lipopolysaccharides or phytosterols was reduced significantly, which was associated with increased STAT6 binding to promoters of its target genes. Suppression of STAT6 expression by siRNA in THP-1 cells exposed to lipopolysaccharides, phytosterols, or both resulted in enhanced elevation of IL-1B mRNA expression. Furthermore, the protective effect of DLPC in THP-1 cells was abrogated by STAT6 siRNA.

Conclusions: These results indicate that activation of LRH-1 by DLPC may protect from PNAC liver injury through STAT6-mediated macrophage polarization.


Conflict of interest statement

Conflict of Interest: Ronald Sokol consults for Albireo, Astellas and Mirum. The remaining authors have no conflicts to report.

Figures

Figure 1:
Figure 1:. LRH-1 agonist DLPC treatment ameliorates hepatic injury and increases hepatic mRNA expression of bile and sterol transporters and FXR target genes during murine PNAC.
DSS-PN 14-day mice were treated with intravenous DLPC on days 4 through 14 and serum measures of hepatic injury and cholestasis were obtained at 14 days in Chow, DSS-PN, and DSS-PN/ DLPC mice. DLPC treatment reduced all elevated markers to near Chow (normal) levels. (A) Serum alanine aminotransferase (ALT), serum aspartate aminotransferase (AST), total serum bile acids, and total bilirubin. (B) qRT-PCR-mRNA analysis of Nr5a2, Abcg5, Abcg8, Abcb11, Abcc2, Nr0b2, and Cyp7a1, (C) Principal components analysis (PCA) of gene expression levels. RUV-normalized expression levels were input into principal components analysis. Each point represents a sample, colored by group. Samples with similar multivariate (i.e., considering all analyzed genes) expression profiles appear closer to one another in PCA- space. Samples segregate by group, suggesting distinct overall whole liver expression profiles between (D) Venn diagram showing the number of significant DEGs found in two pairwise comparisons. Fewer DEGs were observed in DSS-PN/DLPC vs. DSS-PN than DSS-PN vs Chow. (E) Heatmap of normalized expression values of RNA-seq results. Columns represent samples, and rows represent genes, with the order of rows determined by unsupervised hierarchical clustering (Euclidean distance, complete agglomeration method). To give the same weight to each gene, the expression values were further scaled using zero-one scaling: the sample with the highest expression of the gene among these samples has a value of 1, and the sample with the lowest value has an expression of 0. Genes with any statistically significant differential expression (FDR < 0.05 in any of the pairwise comparisons) are depicted. (F) GSEA pathway analysis of DSS-PN vs Chow and DSS-PN/DLPC vs DSS-PN mouse liver. Data are means +/− SEM, n=5–12 animals per group and are further specified in Supplementary Table 3. Statistical analysis was performed using one-way analysis of variance and Tukey’s correction for multiple comparisons. Statistical significance is denoted as follows: a=significantly different (p<0.05) from all other groups. Data have been deposited to the NCBI GEO archive under accession number PRJNA1004741.
Figure 2:
Figure 2:. LRH-1 agonist DLPC induces expression of LRH-1, sterol transporters, and FXR and its target genes in PNAC mouse model.
qRT-PCR analysis of isolated hepatocytes from Chow, DSS-PN and DSS-PN/DLPC mice for (A)Nr5a2, Abcg5, Abcg8, Ppara, and (B) Nr1h4, Abcb11, Abcc2, Abcc3, Nr0b2, Cyp7a1,(C) Western analysis of SHP and BSEP protein expression in isolated hepatocyte homogenate from Chow, DSS-PN and DSS-PN/DLPC treated mice. Quantification of integrated density values (IDV) of the SHP and BSEP immunoblot. (D) Chromatin immunoprecipitation (ChIP) of isolated hepatocytes for LRH-1 binding to the promoter regions of Abcg5/8, Nr0b2, and Cyp7a1 from Chow, DSS-PN and DSS-PN/DLPC mice using an LRH-1 specific antibody. (E) ChIP Assay for NFκB binding to the promoter regions of Nr5a2, Western analysis of NFκB -p65 and p- NFκB -p65 protein expression from isolated hepatocyte homogenate from Chow, DSS-PN and DSS-PN/DLPC treated mice. Quantification of integrated density values (IDV) of the total NFκB -p65 normalized to Actin endogenous control relative to Chow control. Ratio of p- NFκB -p65 to total normalized NFκB. Data are from Chow, DSS-PN and DSS-PN/DLPC mice. Data points represent individual mice and are expressed as mean +/− SEM. n=4–9 animals per group and are further specified in Supplementary Table 3. Statistical analysis was performed by one-way ANOVA with Tukey’s correction for multiple comparisons. ap <0.05 vs. all other groups.
Figure 3:
Figure 3:. Macrophage gene expression in Chow, DSS-PN and DSS-PN/DLPC mouse liver.
(A): Heatmap of normalized expression fold changes of macrophage M1/M2 polarized genes differentially expressed in DSS-PN/DLPC mouse liver compared to Chow or DSS-PN mice. Each sample’s (columns) expression of M1 and M2 genes (rows; ordered based on unsupervised hierarchical clustering with Euclidean distance, complete agglomeration method) are colored by normalized, zero-one scaled gene expression values. Genes from curated M1/M2 gene lists with any statistically significant differential expression (FDR < 0.05 in any of the pairwise comparisons) and included and labeled by M1 or M2 (respectively colored red or grey on column to the right of heatmap). (B) Immunoblot of protein expression of total STAT6 and p-STAT6 in BMDMs isolated from Chow, DSS-PN and DSS-PN/DLPC mice. Quantification of integrated density values (IDV) of immunoblots of total STAT6 normalized to GRB2 endogenous control relative to Chow control. Ratio of p-STAT6 to total normalized total STAT6. Data points represent individual mice and are expressed as mean +/− SEM. Statistical analysis performed by one-way ANOVA with Tukey’s correction for multiple comparisons. ap <0.01. (C) Heatmap of normalized expression fold changes of 20 genes regulated by STAT6 in M2 macrophages differentially expressed in DSS-PN/DLPC mouse liver. Genes are represented along the y -axis. Data sets along the x -axis have been ordered based on unsupervised hierarchical clustering (Euclidean distance, complete agglomeration method) of corresponding gene expression fold changes. To give the same weight to each gene, the expression values were further scaled using zero-one scaling: the sample with the highest expression of the gene among these samples has a value of 1, and the sample with the lowest value has an expression of 0. Genes with any statistically significant differential expression (FDR < 0.05 in any of the pairwise comparisons) are depicted. Volcano-like plots for several M2 genes are depicted from bulk RNA sequencing which are validated in IHMC or BMDM (Figure 3D, E and F and Suppl Figure 3). Each point represents a gene from the XYZ pathway. The position of each gene represents the between-group effect size (x-axis; log2fold change), p-value (y-axis; negative log10-scale), and statistical significance (blue closed circles if p < 0.05, grey open circles if not significant) for a given pairwise comparison. This plot is created for each of the three pairwise comparisons. The plots represent fold-change and p-value for the comparisons of DSS-PN vs. Chow, DSS-PN/DLPC vs. DSS-PN, and DSS-PN/DLPC vs. Chow. (D) mRNA expression of proinflammatory liver macrophage genes in IHMCs from Chow, DSS-PN, and DSS-PN/DLPC mice. (E) mRNA expression of chemokine genes in IHMCs. (F) mRNA expression of anti-inflammatory/healing genes in IHMCs. Data are mean +/− SEM. Data points represent individual mice. n=4–8 animals per group and are further specified in Supplementary Table 3 Statistical analysis was performed by one-way ANOVA with Tukey’s correction for multiple comparisons. ap <0.05 vs. all other groups; bp <0.05 vs. DSS-PN. cp <0.05 vs chow.
Figure 4:
Figure 4:. Effects of DLPC treatment on IL-1b and other macrophage genes in macrophage/monocyte cell lines, HepG2 cells and BMDMs.
(A) qPCR of Il-1b mRNA from isolated hepatocytes and ELISA of serum IL-1β protein levels from Chow, DSS-PN, and DSS-PN/DLPC mice. n=4–8 animals per group and are further specified in Supplementary Table 3 (B) Co-culture of human monocyte/macrophage THP-1 (upper wells) and HepG2 cells (lower wells) was conducted. IL-1β and TNF were analyzed by ELISA in media/supernatant in the upper and bottom wells from co-culture experiments with HepG2 cells incubated with and without LPS for 4h and with or without stig+sito in the presence or absence of DLPC. (C) Cultured wild -type mouse BMDMs were incubated with DLPC overnight followed by the addition of +/− LPS or +/− stig+sito x 4h, cells were harvested, and mRNA analyzed by qPCR for Clec7a1, Chil3, Msr1, Il1rn, Maf1 and Abca1. (D) BMDM isolated from Chow, DSS-PN and DSS-PN/DLPC mice were cultured and a ChIP assay examining STAT6 binding to promoter of Chil3 was performed. Cultured Raw 264.7 cells were incubated with DLPC overnight followed by addition of +/− LPS and stig+sitox4h and a ChIP assay was performed examining STAT6 binding to the promoter of, Arg1 and Chil3. Data presented as fold change over IgG. mRNA expression was determined after normalization to HPRT1 as an endogenous control gene and expressed relative to results obtained from untreated. Three independent experiments were presented in (B)-(E). Statistical analysis was performed by one-way ANOVA with Tukey’s correction for multiple comparisons. ap < 0.05 = vs. all other groups; bp < 0.05 = LPS vs LPS/DLPC; cp < 0.05 = LPS+ stig+sito vs LPS+ stig+sito/DLPC; dp < 0.05 = stig+sito vs stig+sito/DLPC
Figure 5:
Figure 5:. Effect of STAT6 or LRH-1 inhibition on gene expression in cultured macrophages/monocytes.
(A, B): Cultured THP-1 cells were transfected with siRNA-STAT6 or non-targeting siRNA control for 24 hr following DLPC overnight incubation. Following transfection +/− LPS or +/− stig+sito was incubated with cells x 4h, and cells were harvested for mRNA analysis by qPCR. (A, B) mRNA expression of IL-1B and IL-1RN in THP-1 cells. (C, D, E): Wild type mouse BMDMs were incubated with DLPC and Ag490 or LRH-1 antagonist ML-179 overnight followed by addition of +/− LPS or +/− stig+sito x 4h, cells were harvested, and mRNA analyzed by qPCR for (C) Il-1rn, (D) Chil3, and (E) Il-1rn. (F): Cultured Raw 264.7 cells were incubated with DLPC overnight followed by addition of +/− LPS and stig+sitox4h and a ChIP assay was performed examining STAT6 binding to the promoter of Nr5a2. Gene expression was normalized to HPRT1 and expressed relative to results from untreated controls. Three independent experiments were presented in (A)-(F). Statistical analysis was performed by one-way ANOVA with Tukey’s correction for multiple comparisons. **p< 0.01, ***p< 0.001 ****p< 0.0001. ap < 0.05 vs all other groups.
Figure 6:
Figure 6:. Proposed mechanisms of DLPC-mediated protection during PNAC.
LPS absorbed from the injured gut generates IL-1β from hepatic macrophages, which activates NFκB in hepatocytes that inhibits LRH-1 expression and subsequent reduced binding of LRH-1 to the Abcg5/8 promoter. This reduced expression of Abcg5/8 results in hepatocyte accumulation of phytosterols contained in the infused lipid emulsion, which, in turn, interferes with FXR binding to its targets, reduced expression of BSEP and hepatocyte retention of bile acids and cholestasis. DLPC activates STAT6 signaling in macrophages which induces expression of Nr5a2/LRH-1 and its target M2 genes including increased expression of Il-1rn and subsequent inhibition of Il-1β pro-inflammatory signaling in the hepatocyte. DLPC also activates hepatocyte LRH1 signaling which upregulates ABCG5/8 expression that increases sterol transport into the canaliculus. DLPC also results in decreased NFκB binding to promoter of Nr5a2/LRH-1, increasing its transcription and its inducing effects on expression of bile and sterol transporters.

Similar articles

Cited by

References

    1. Khalaf RT, Sokol RJ. New Insights Into Intestinal Failure-Associated Liver Disease in Children. Hepatology 2020;71:1486–1498. - PMC - PubMed
    1. Madnawat H, Welu AL, Gilbert EJ, Taylor DB, Jain S, Manithody C, Blomenkamp K, et al. Mechanisms of Parenteral Nutrition-Associated Liver and Gut Injury. Nutr Clin Pract 2020;35:63–71. - PMC - PubMed
    1. El Kasmi KC, Ghosh S, Anderson AL, Devereaux MW, Balasubramaniyan N, D’Alessandro A, Orlicky DJ, et al. Pharmacologic activation of hepatic farnesoid X receptor prevents parenteral nutrition-associated cholestasis in mice. Hepatology 2022;75:252–265. - PubMed
    1. Ghosh S, Devereaux MW, Anderson AL, Gehrke S, Reisz JA, D’Alessandro A, Orlicky DJ, et al. NF-kappaB Regulation of LRH-1 and ABCG5/8 Potentiates Phytosterol Role in the Pathogenesis of Parenteral Nutrition-Associated Cholestasis. Hepatology 2021. - PMC - PubMed
    1. El Kasmi KC, Vue PM, Anderson AL, Devereaux MW, Ghosh S, Balasubramaniyan N, Fillon SA, et al. Macrophage-derived IL-1beta/NF-kappaB signaling mediates parenteral nutrition-associated cholestasis. Nat Commun 2018;9:1393. - PMC - PubMed

Publication types

MeSH terms

Substances