. 2024 Mar;70(3):165-177.
doi: 10.1165/rcmb.2023-0147OC.

Epigenetic Reprogramming Drives Epithelial Disruption in Chronic Obstructive Pulmonary Disease

Affiliations

Epigenetic Reprogramming Drives Epithelial Disruption in Chronic Obstructive Pulmonary Disease

Bonnie H Yeung-Luk et al. Am J Respir Cell Mol Biol. 2024 Mar.

Abstract

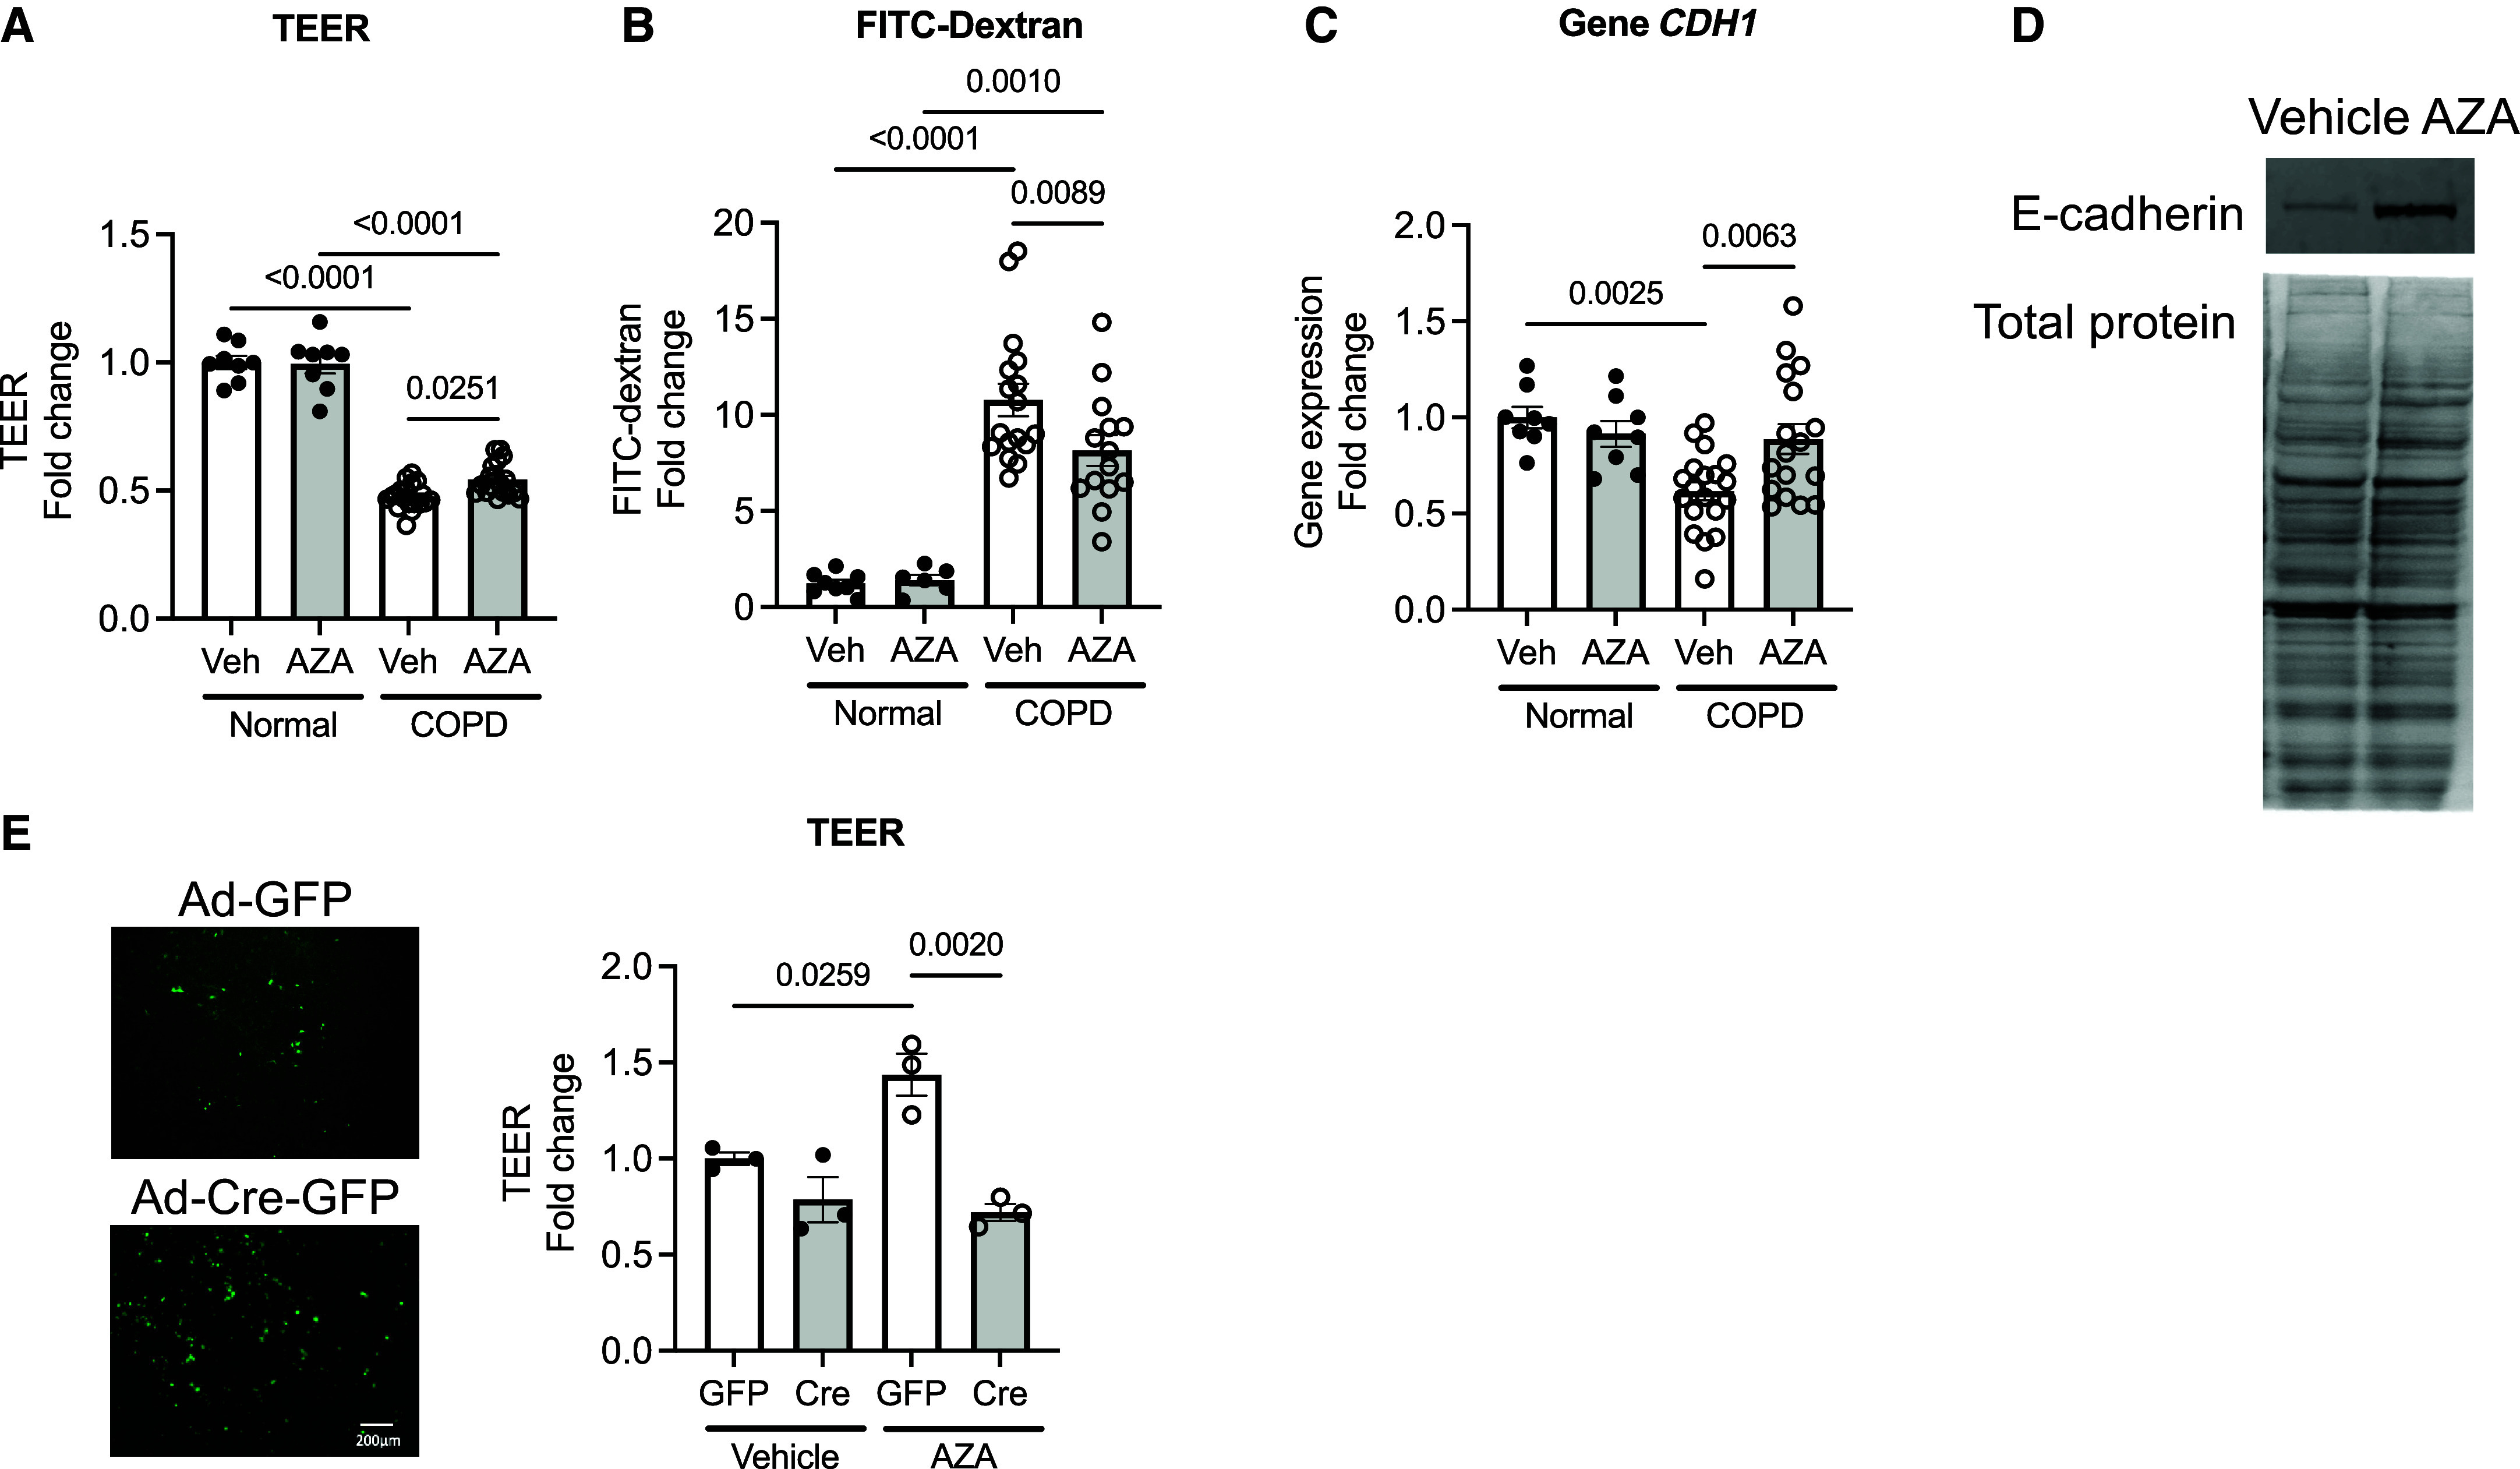
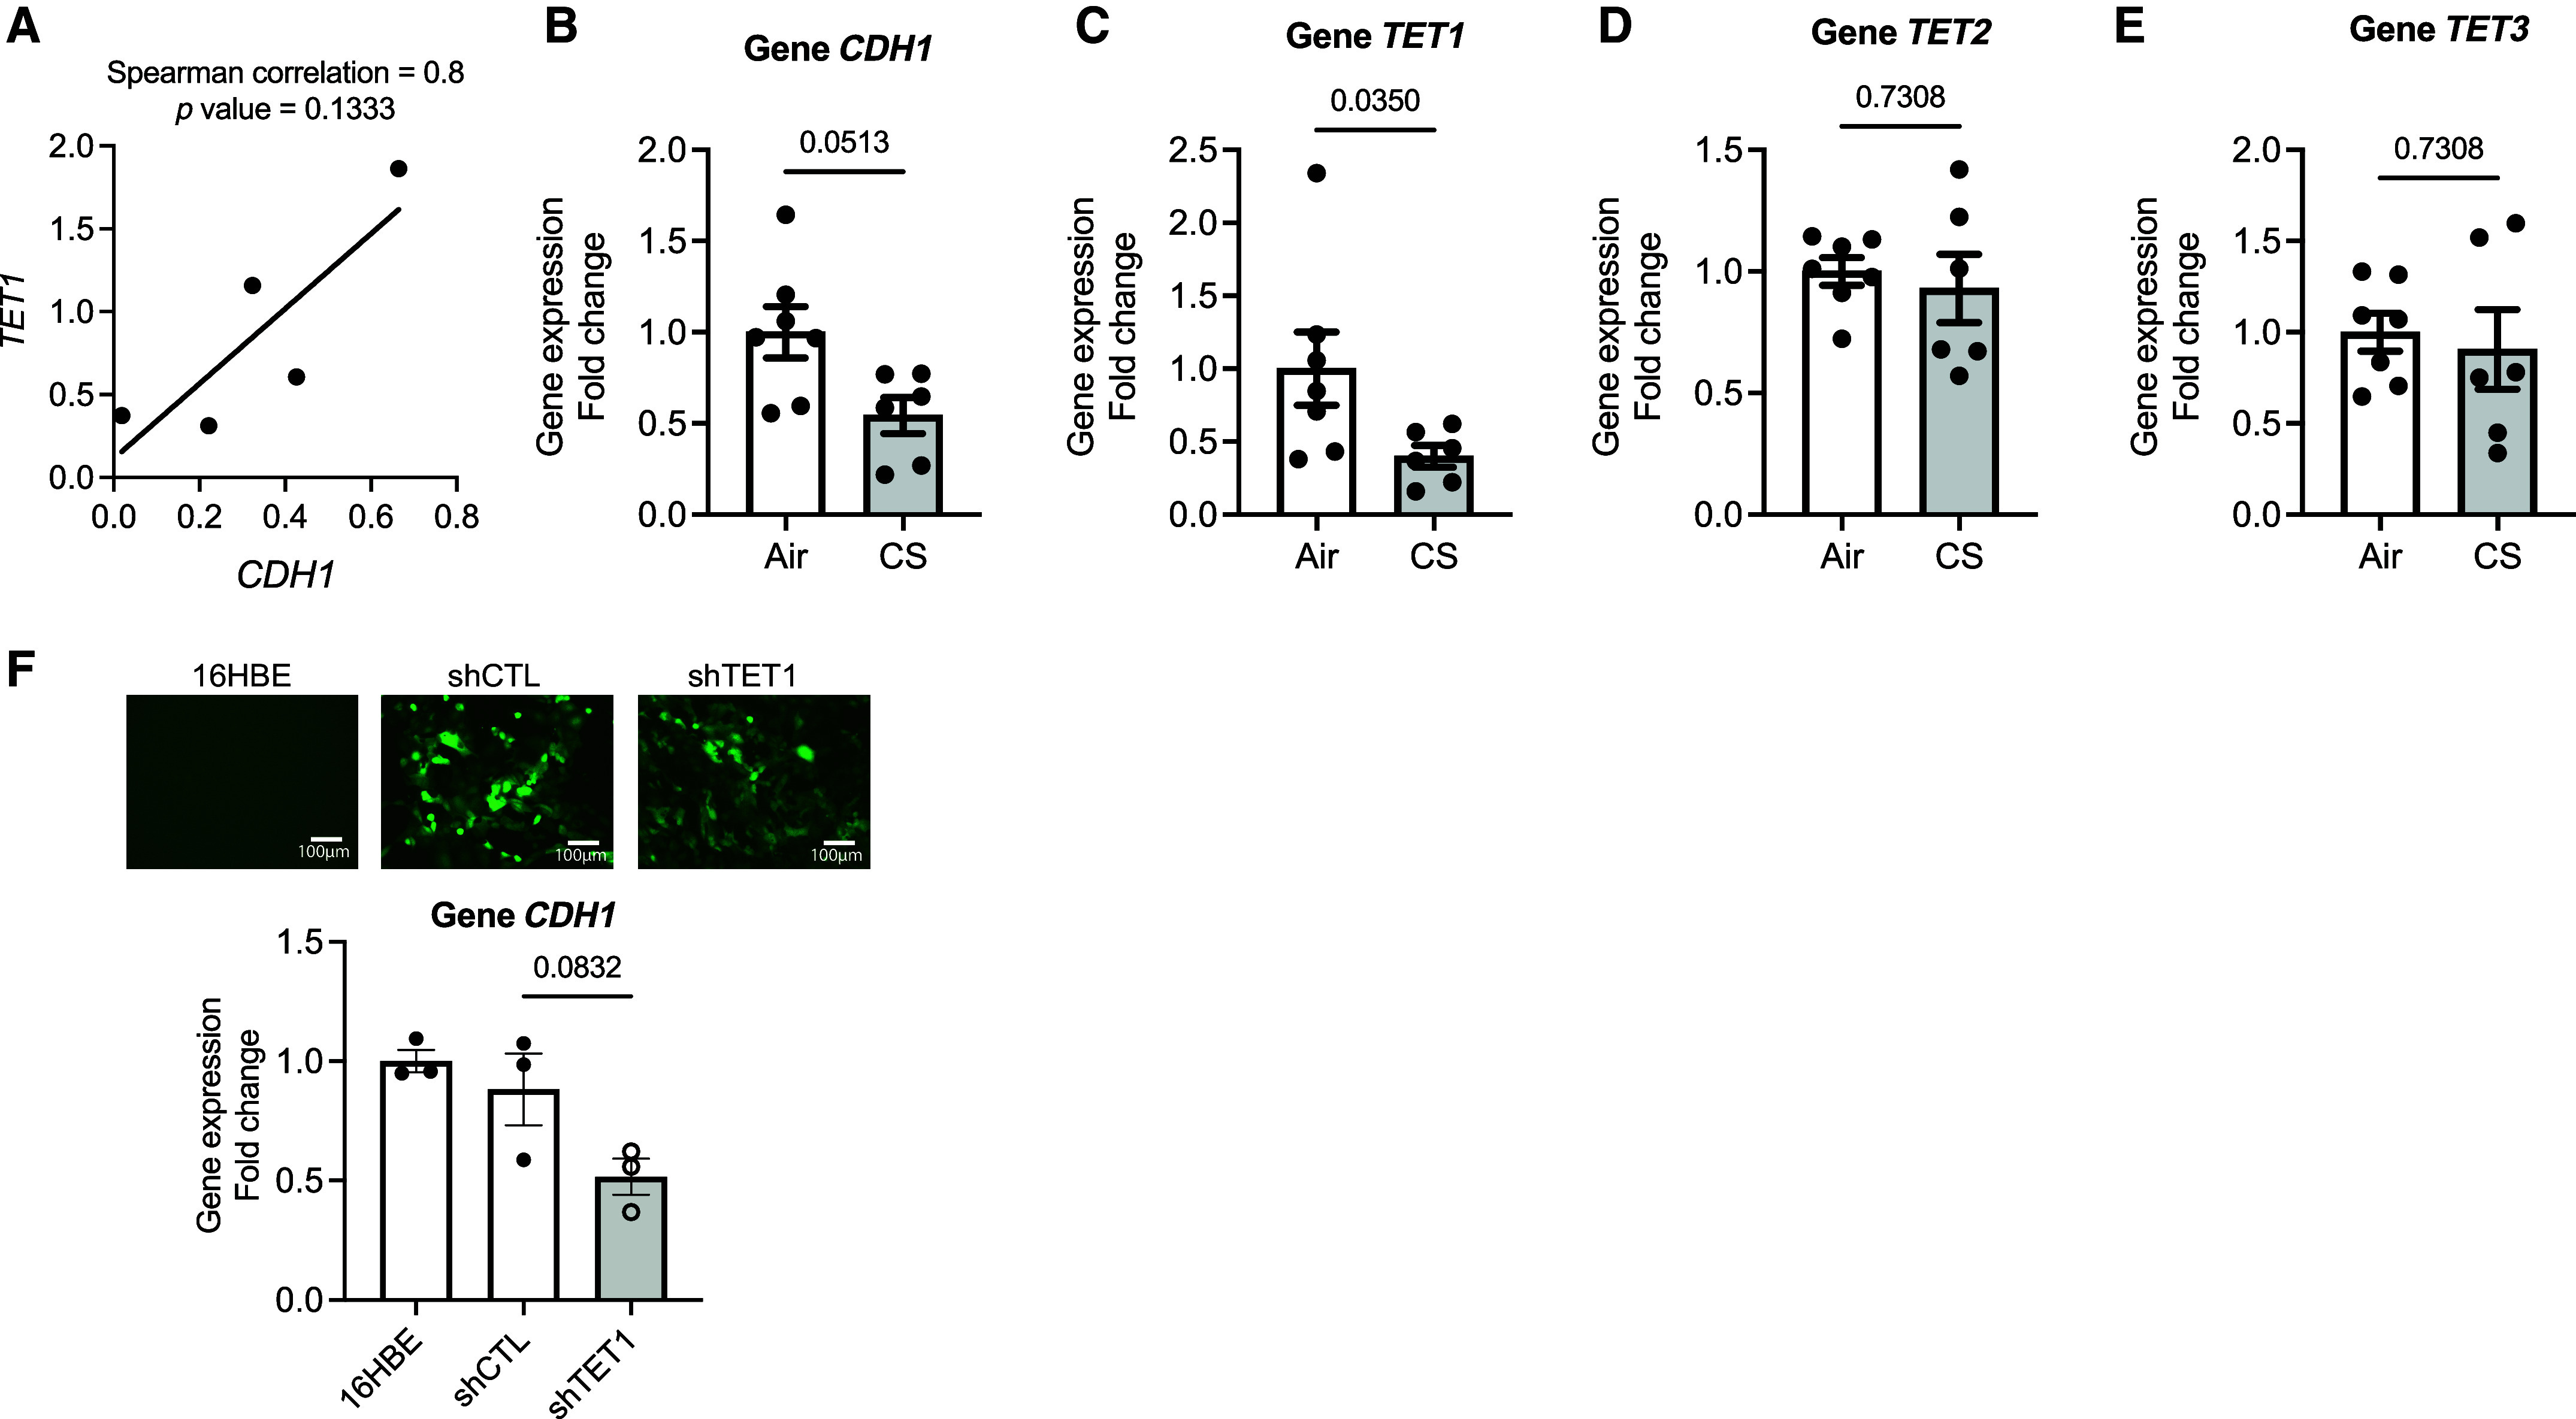
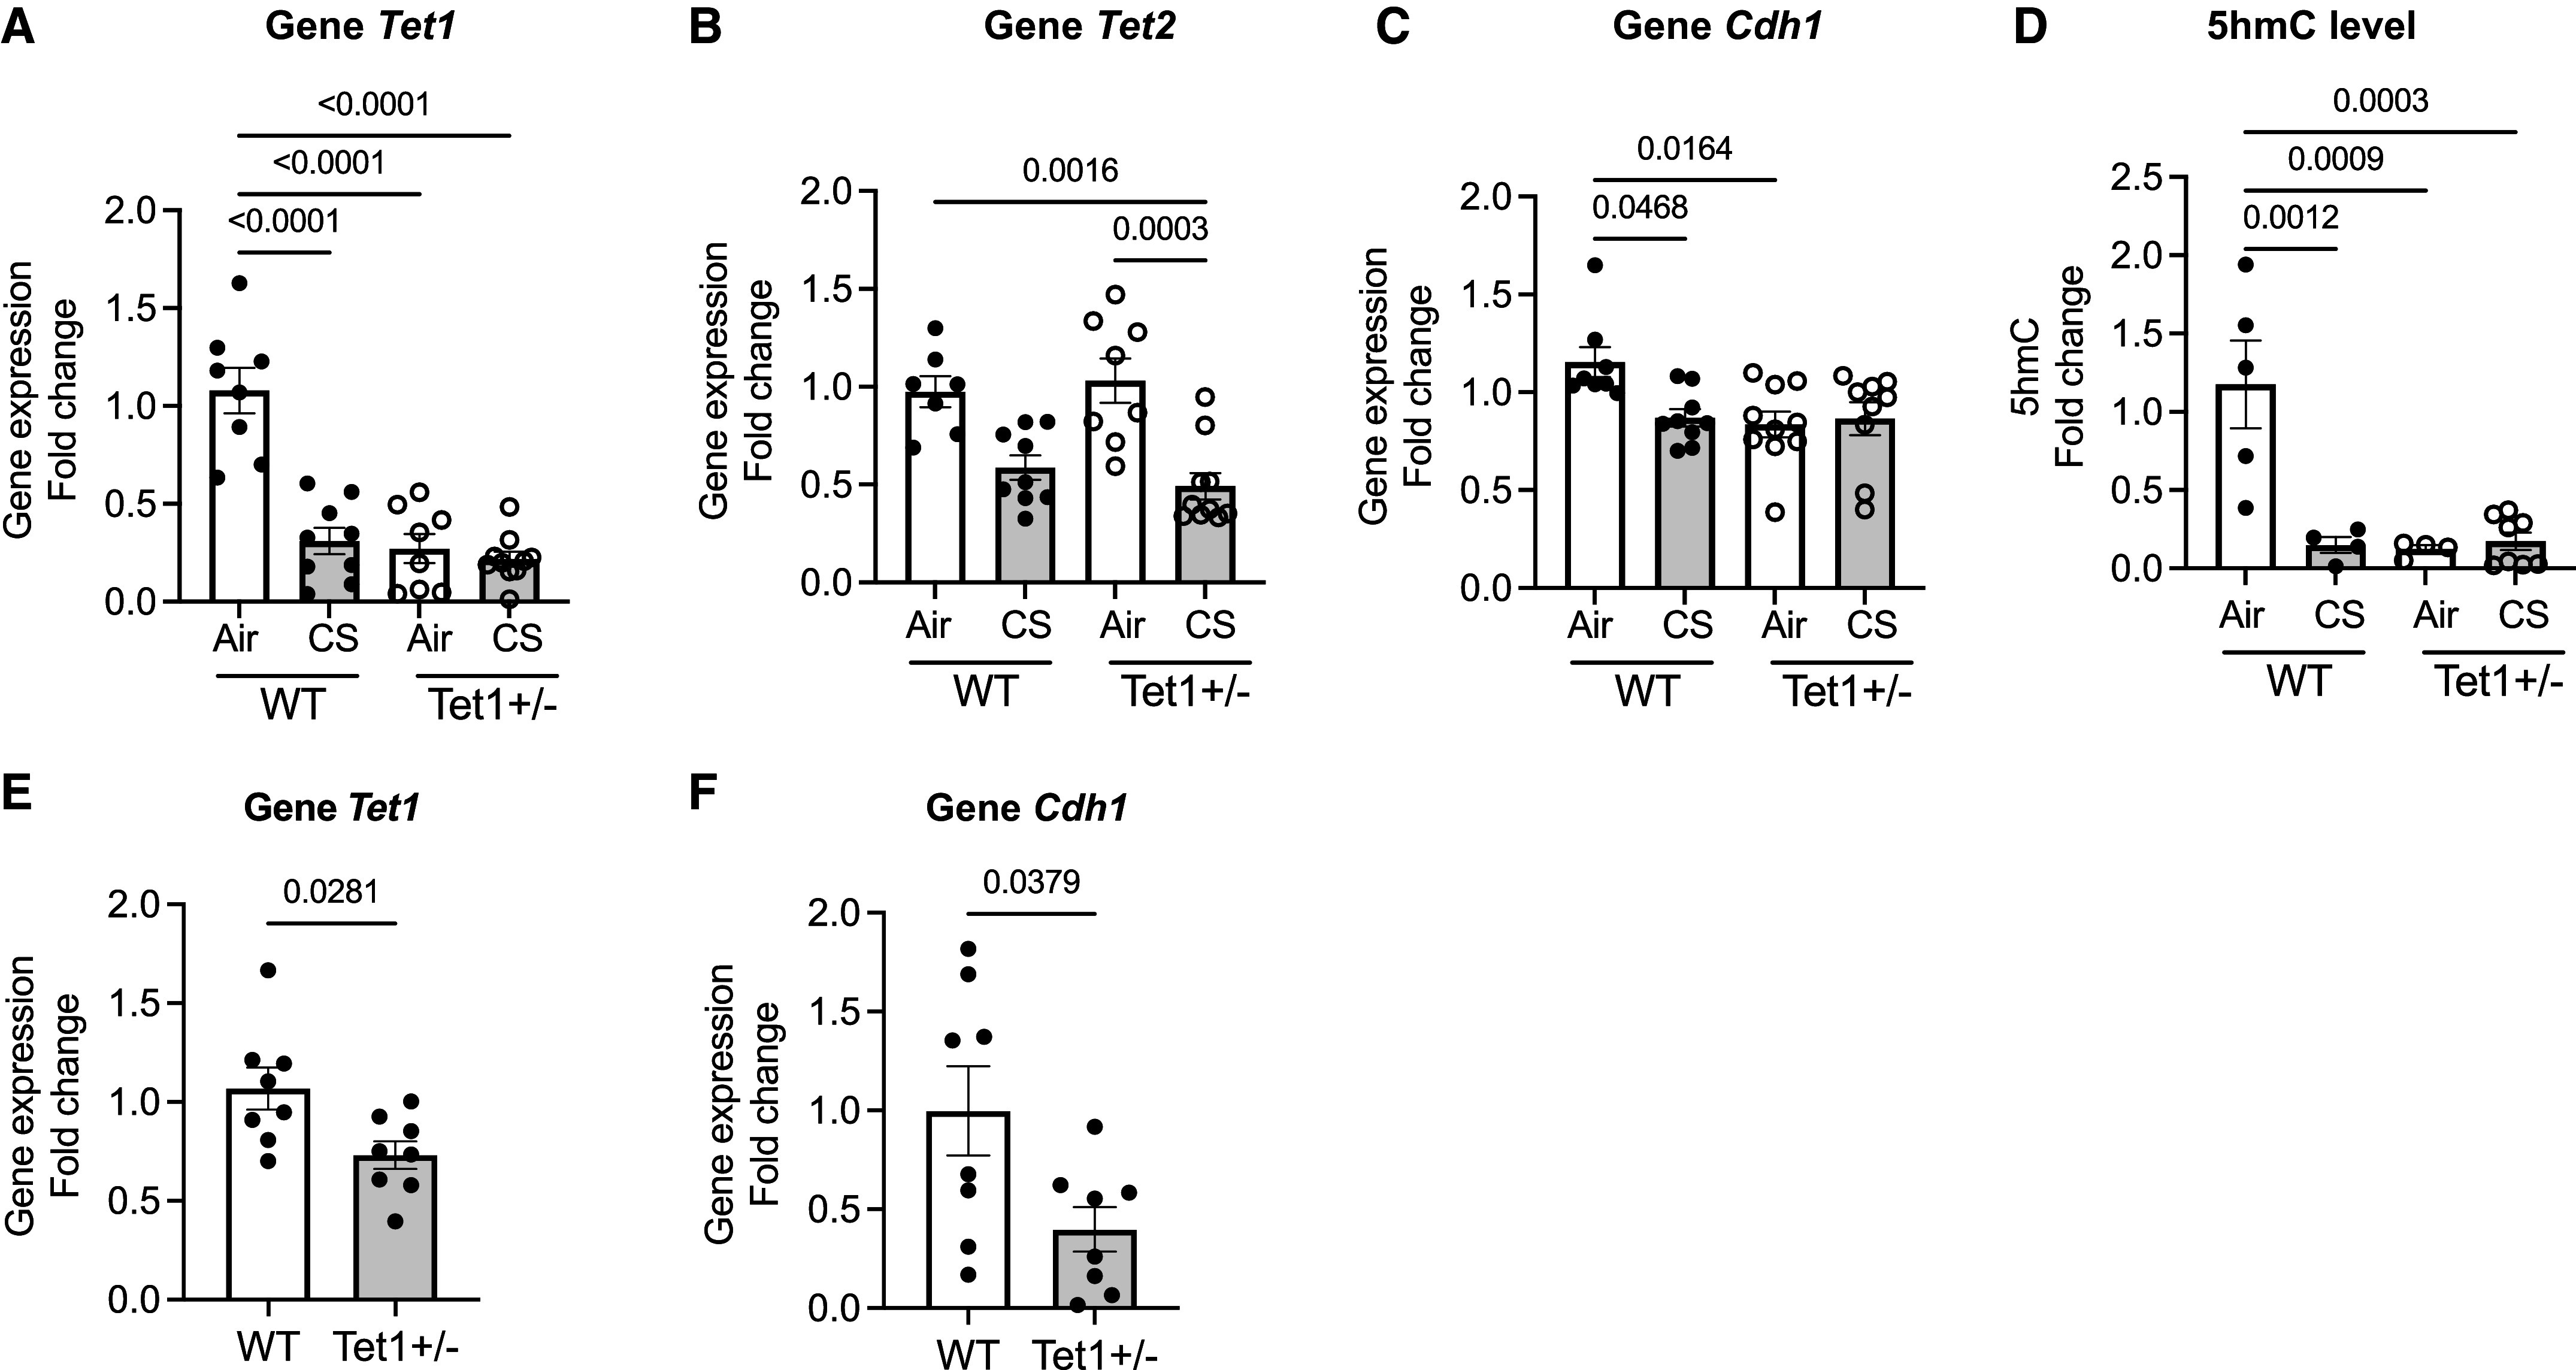
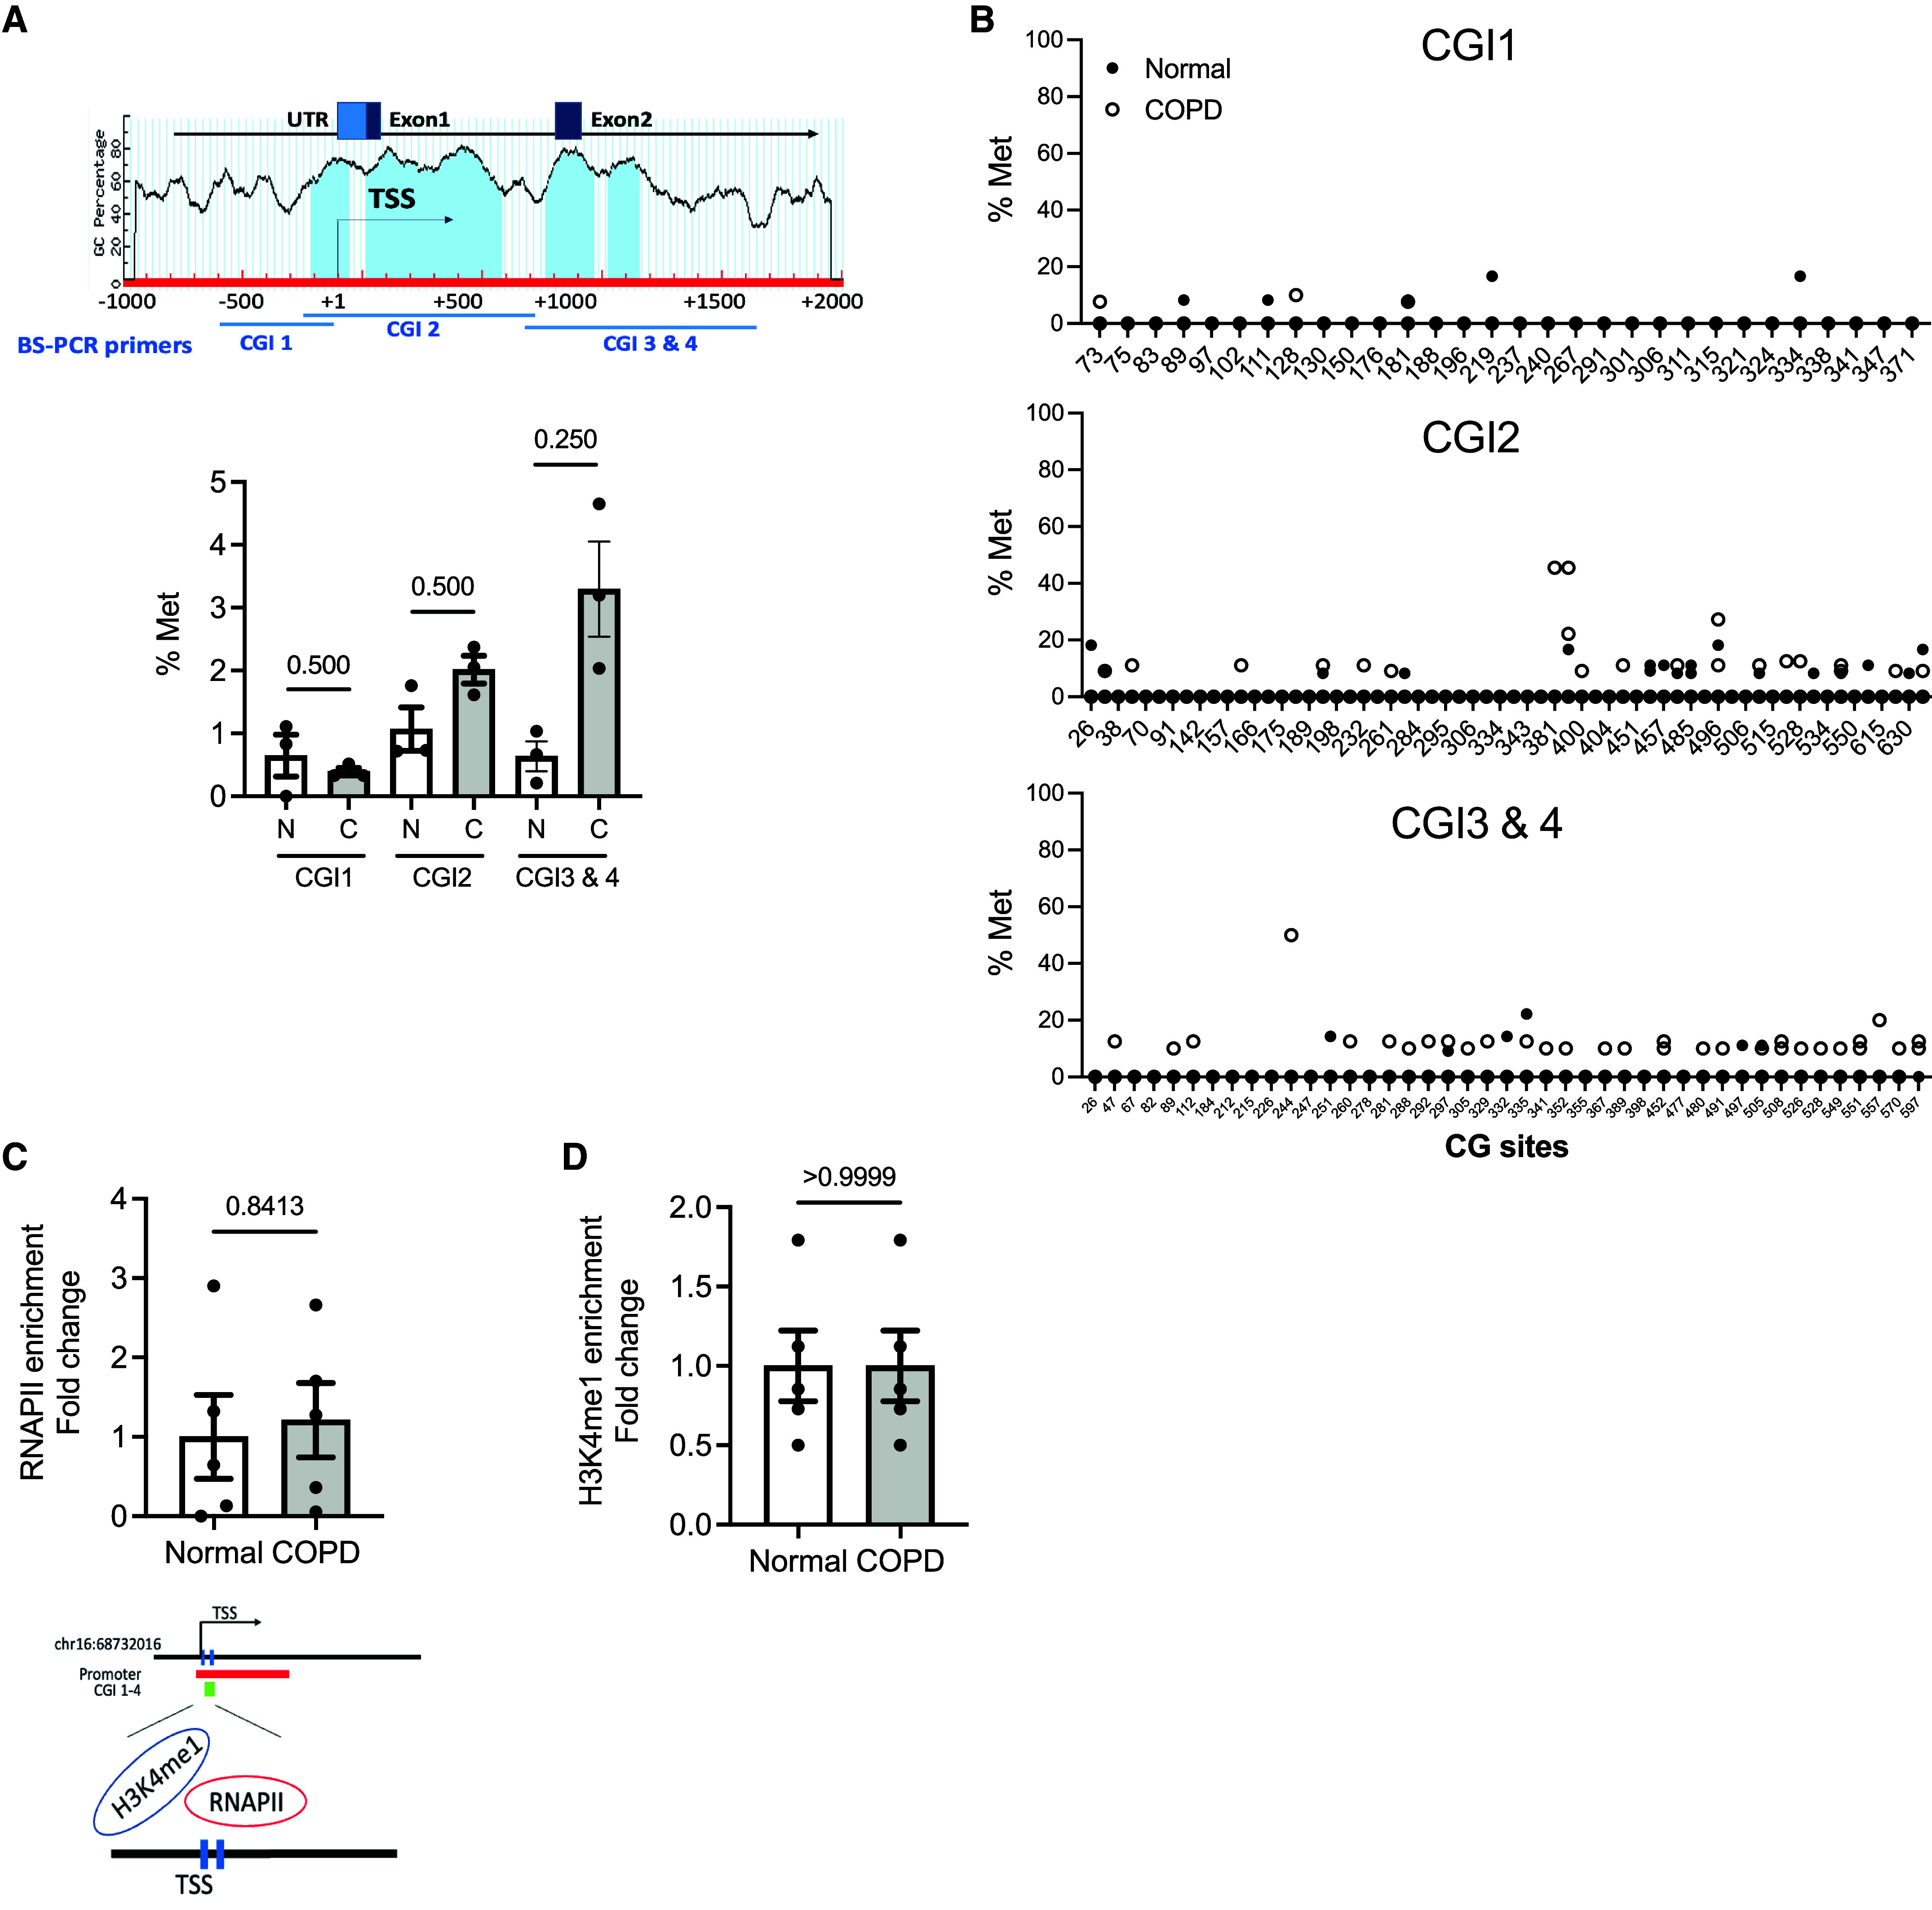
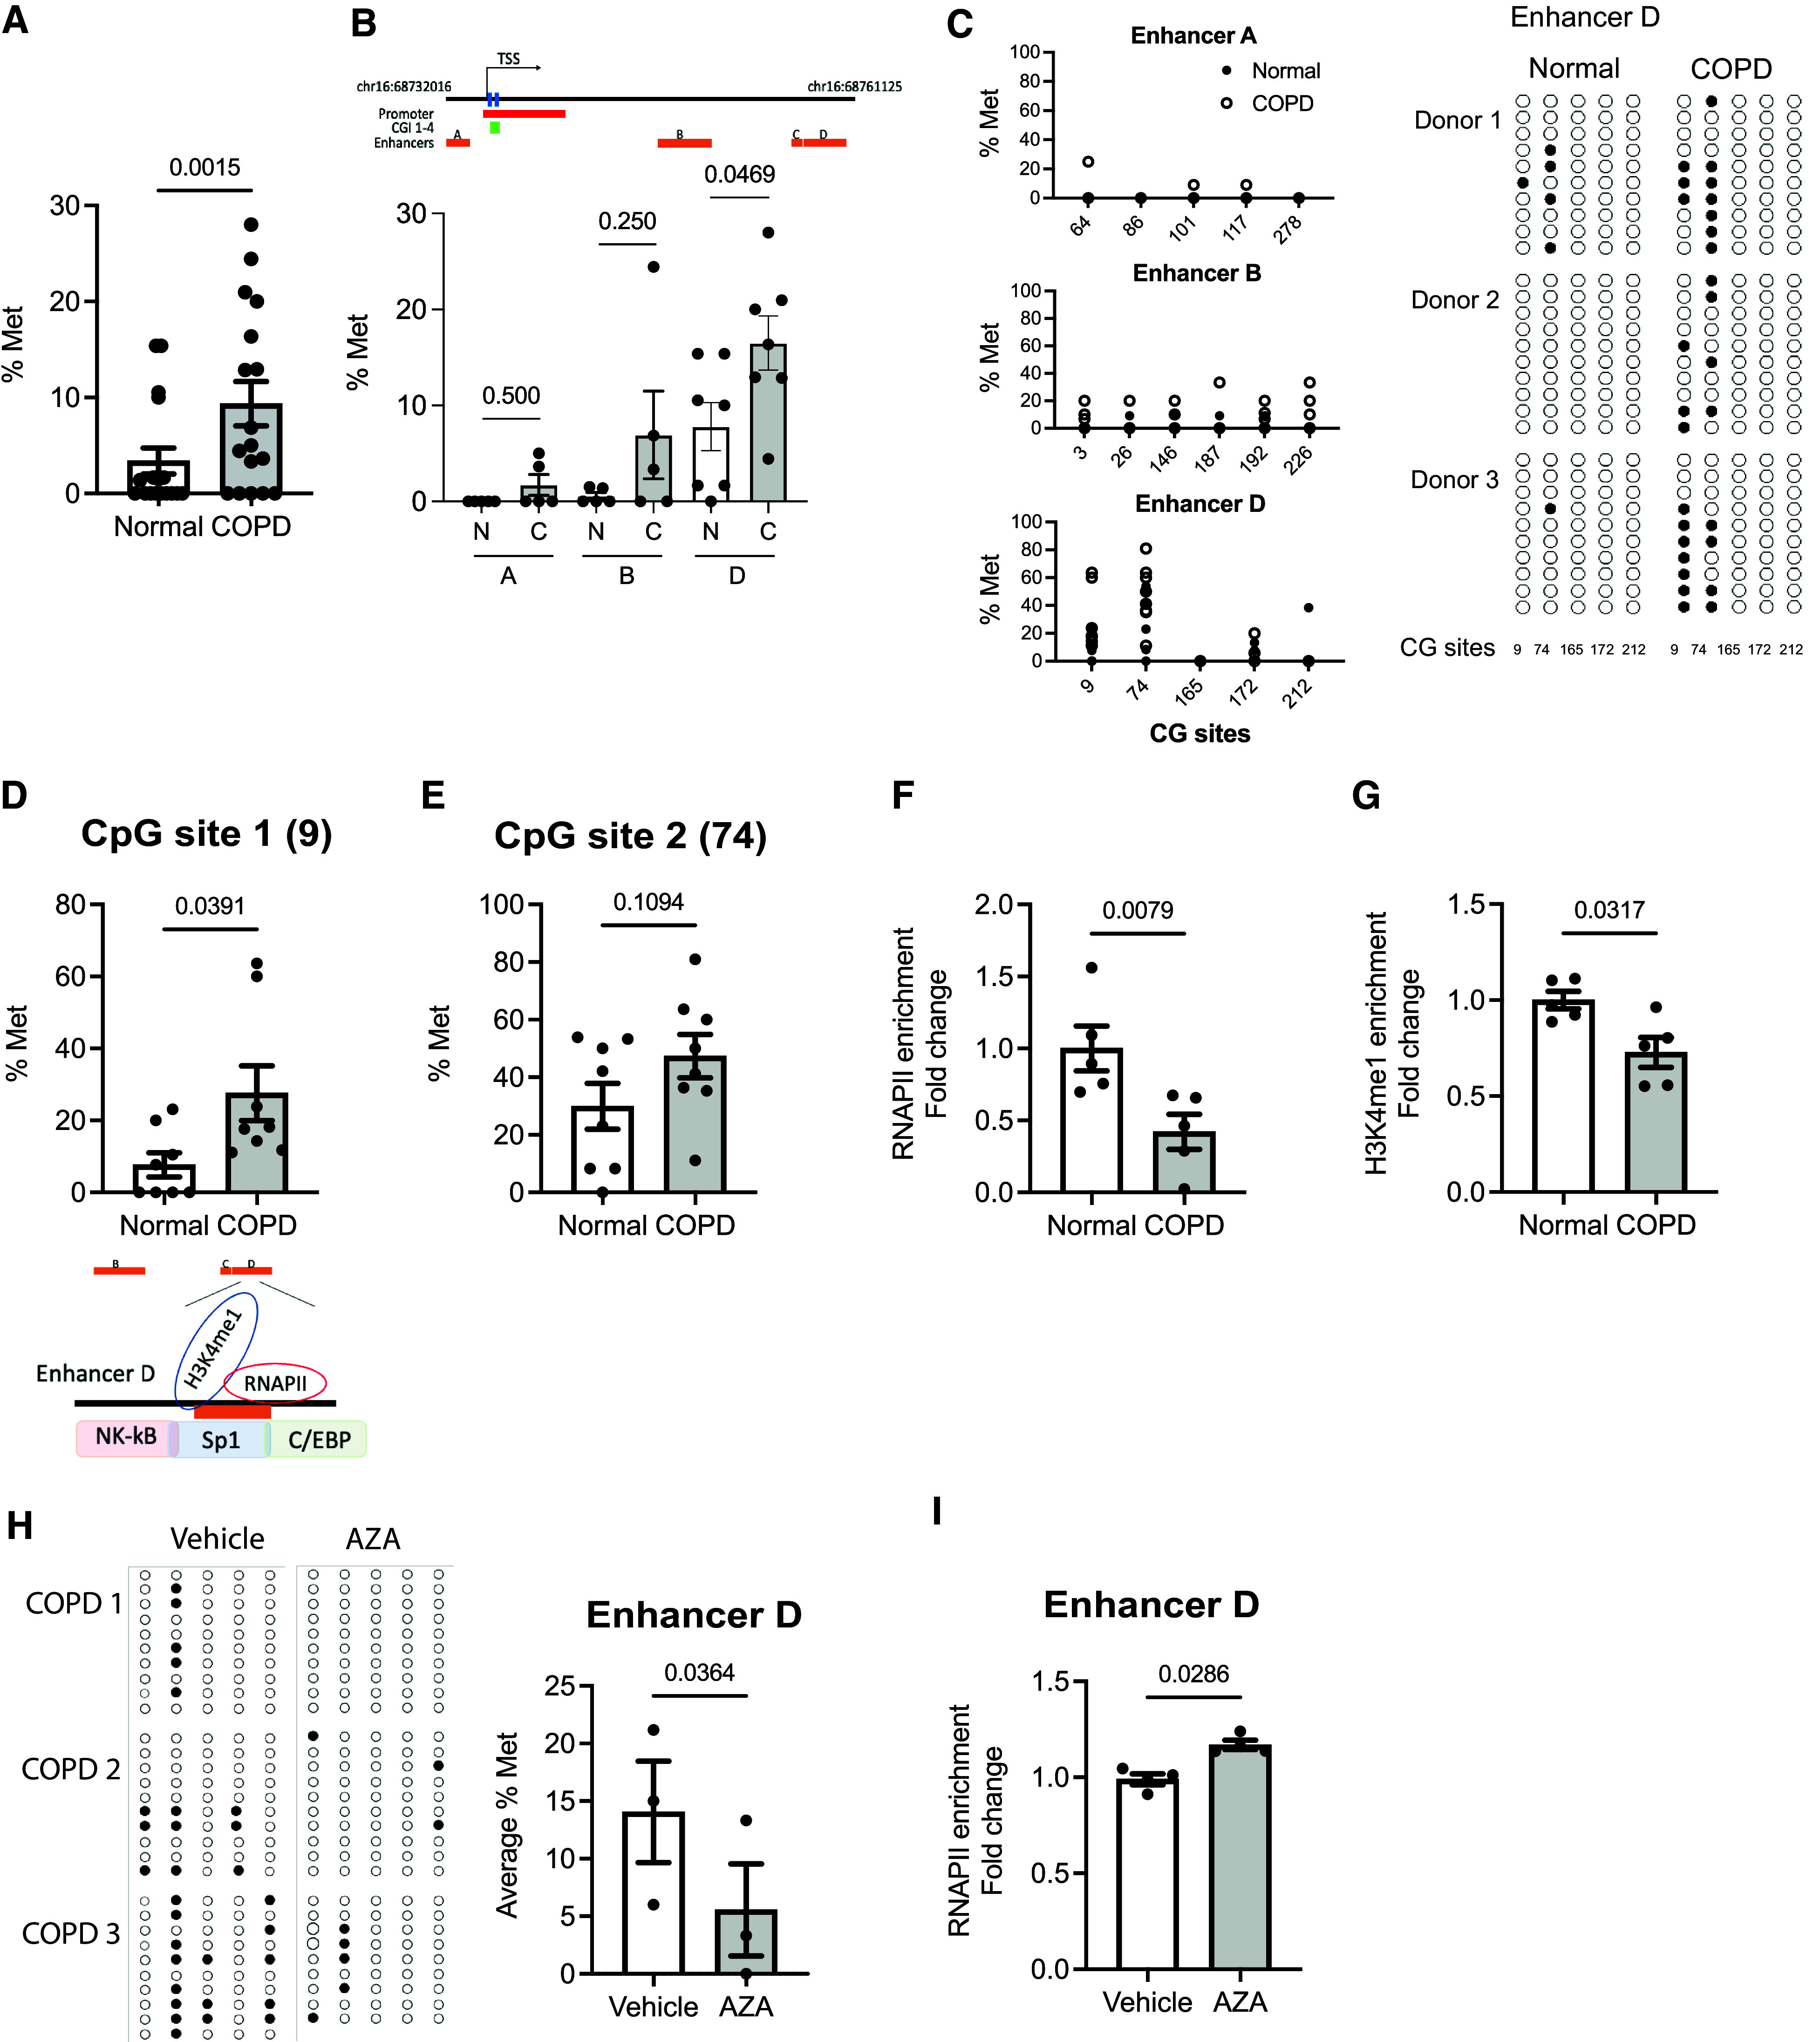
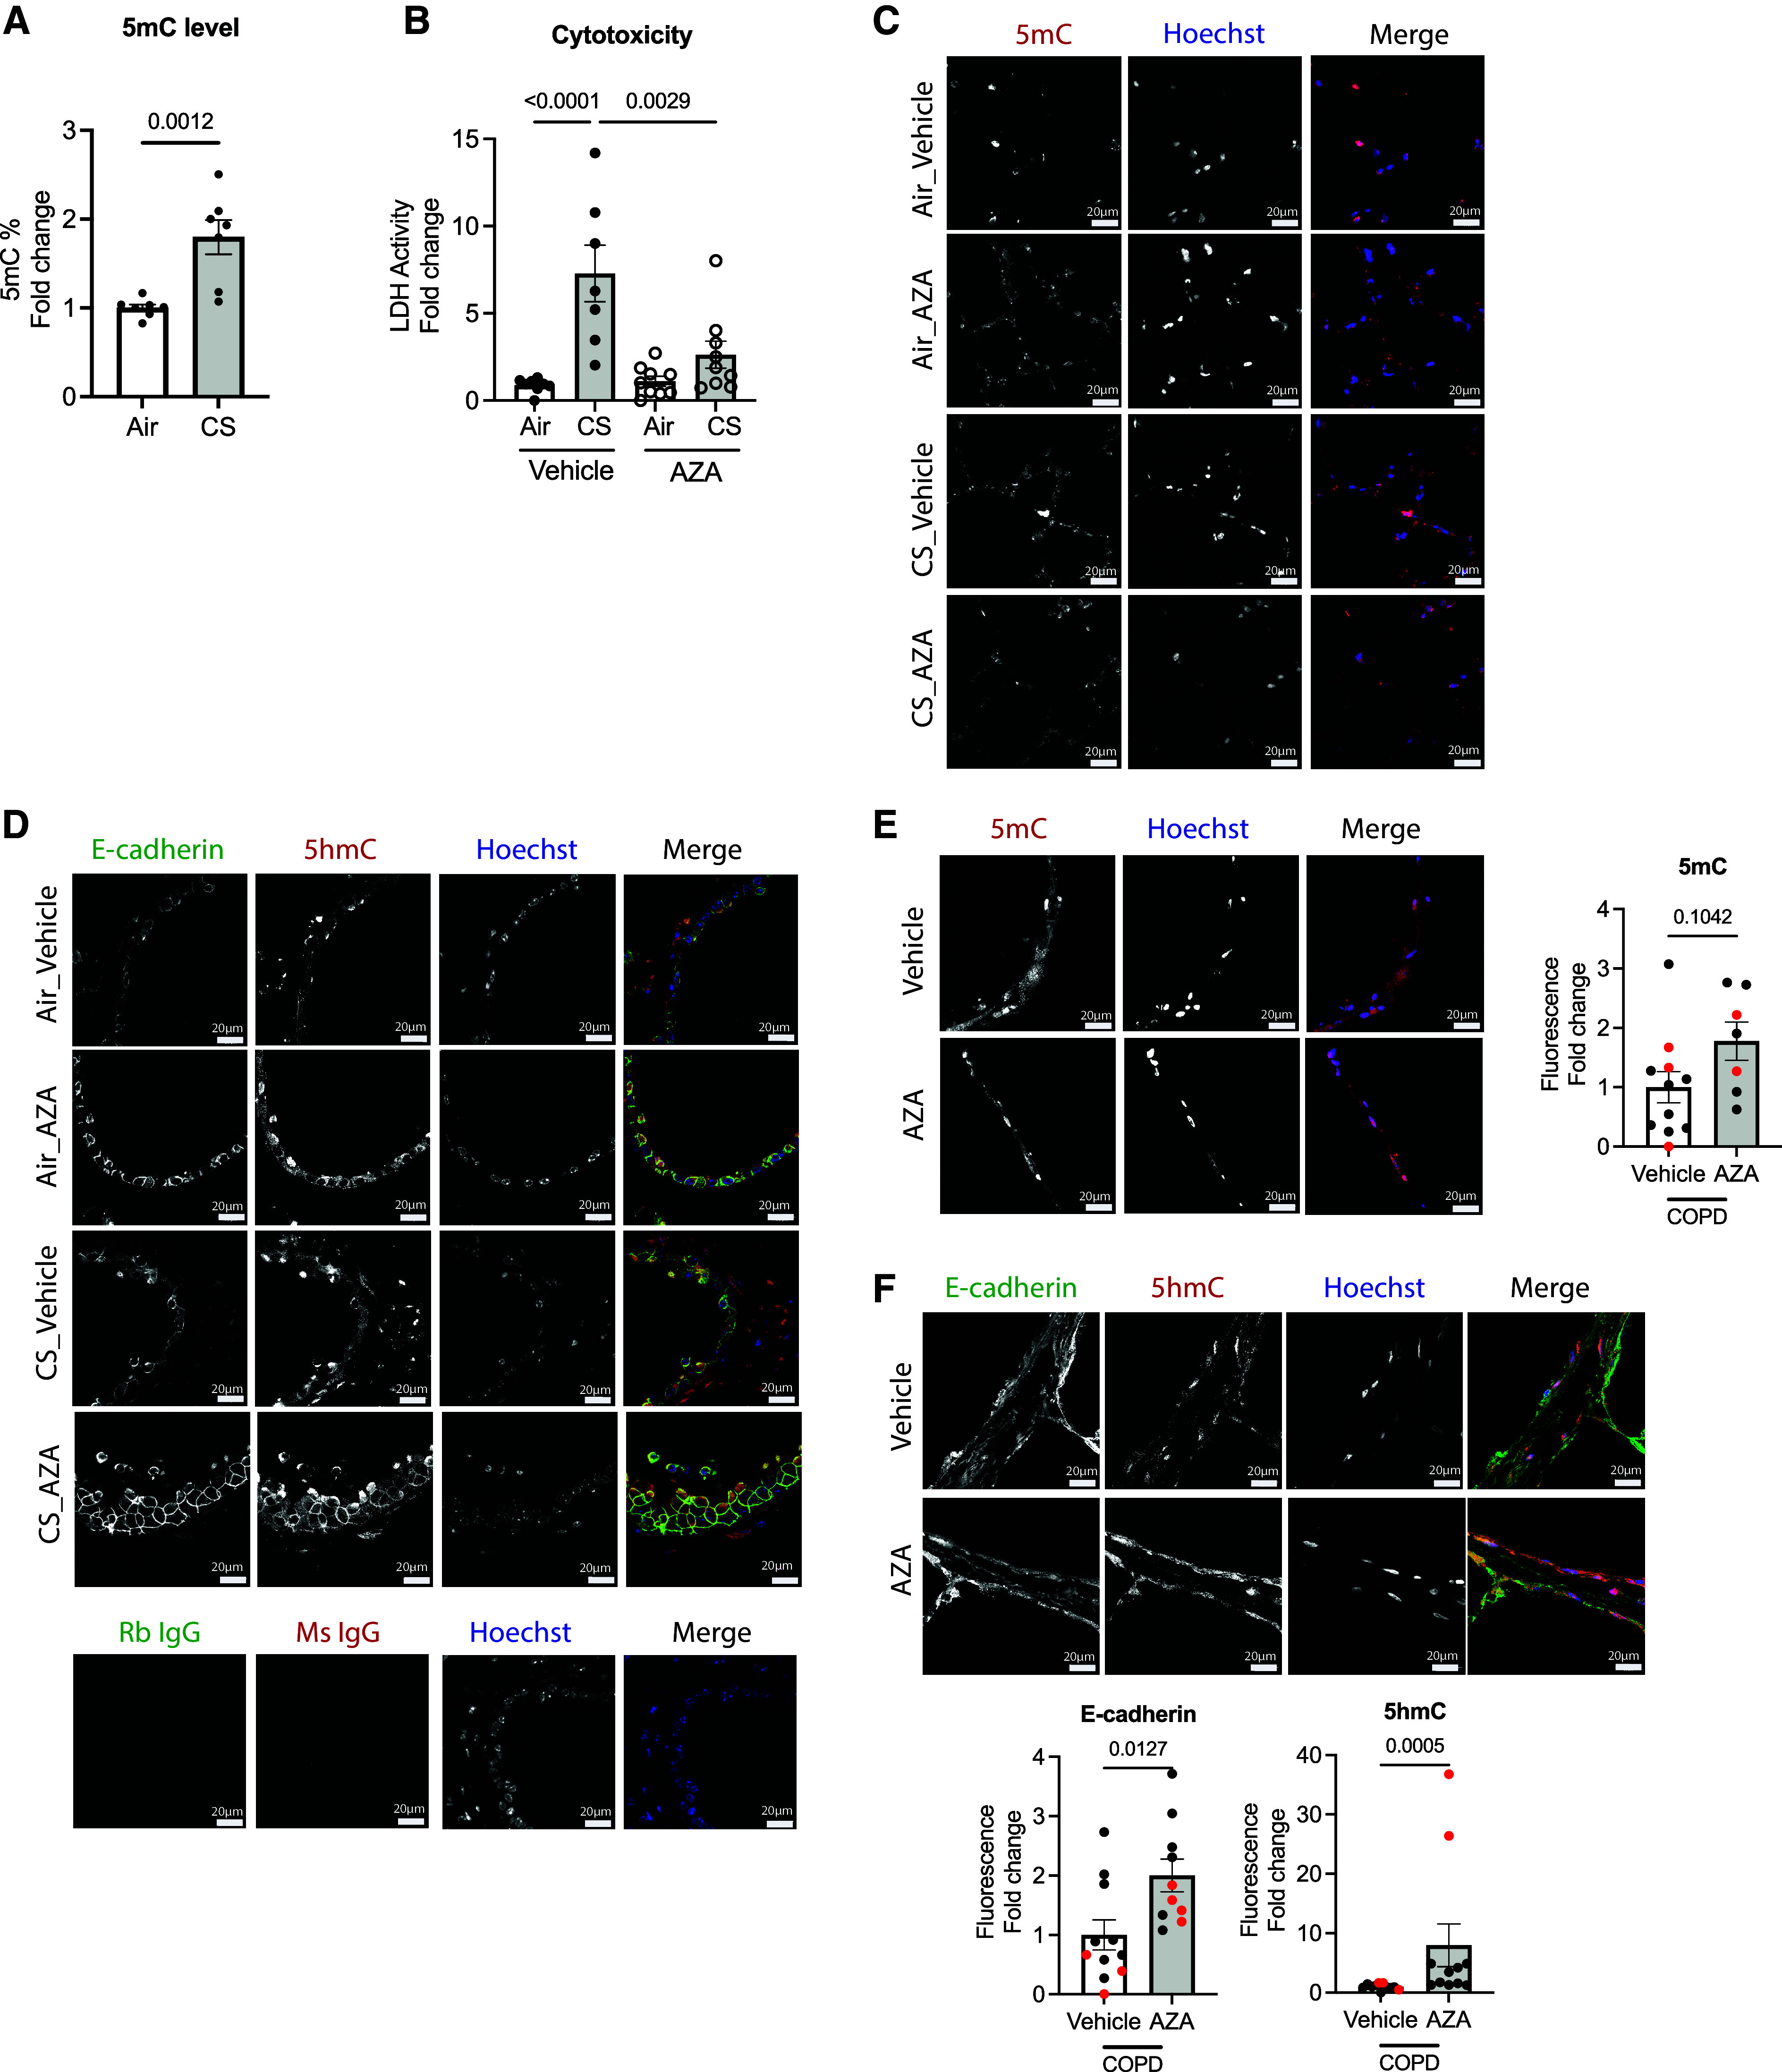
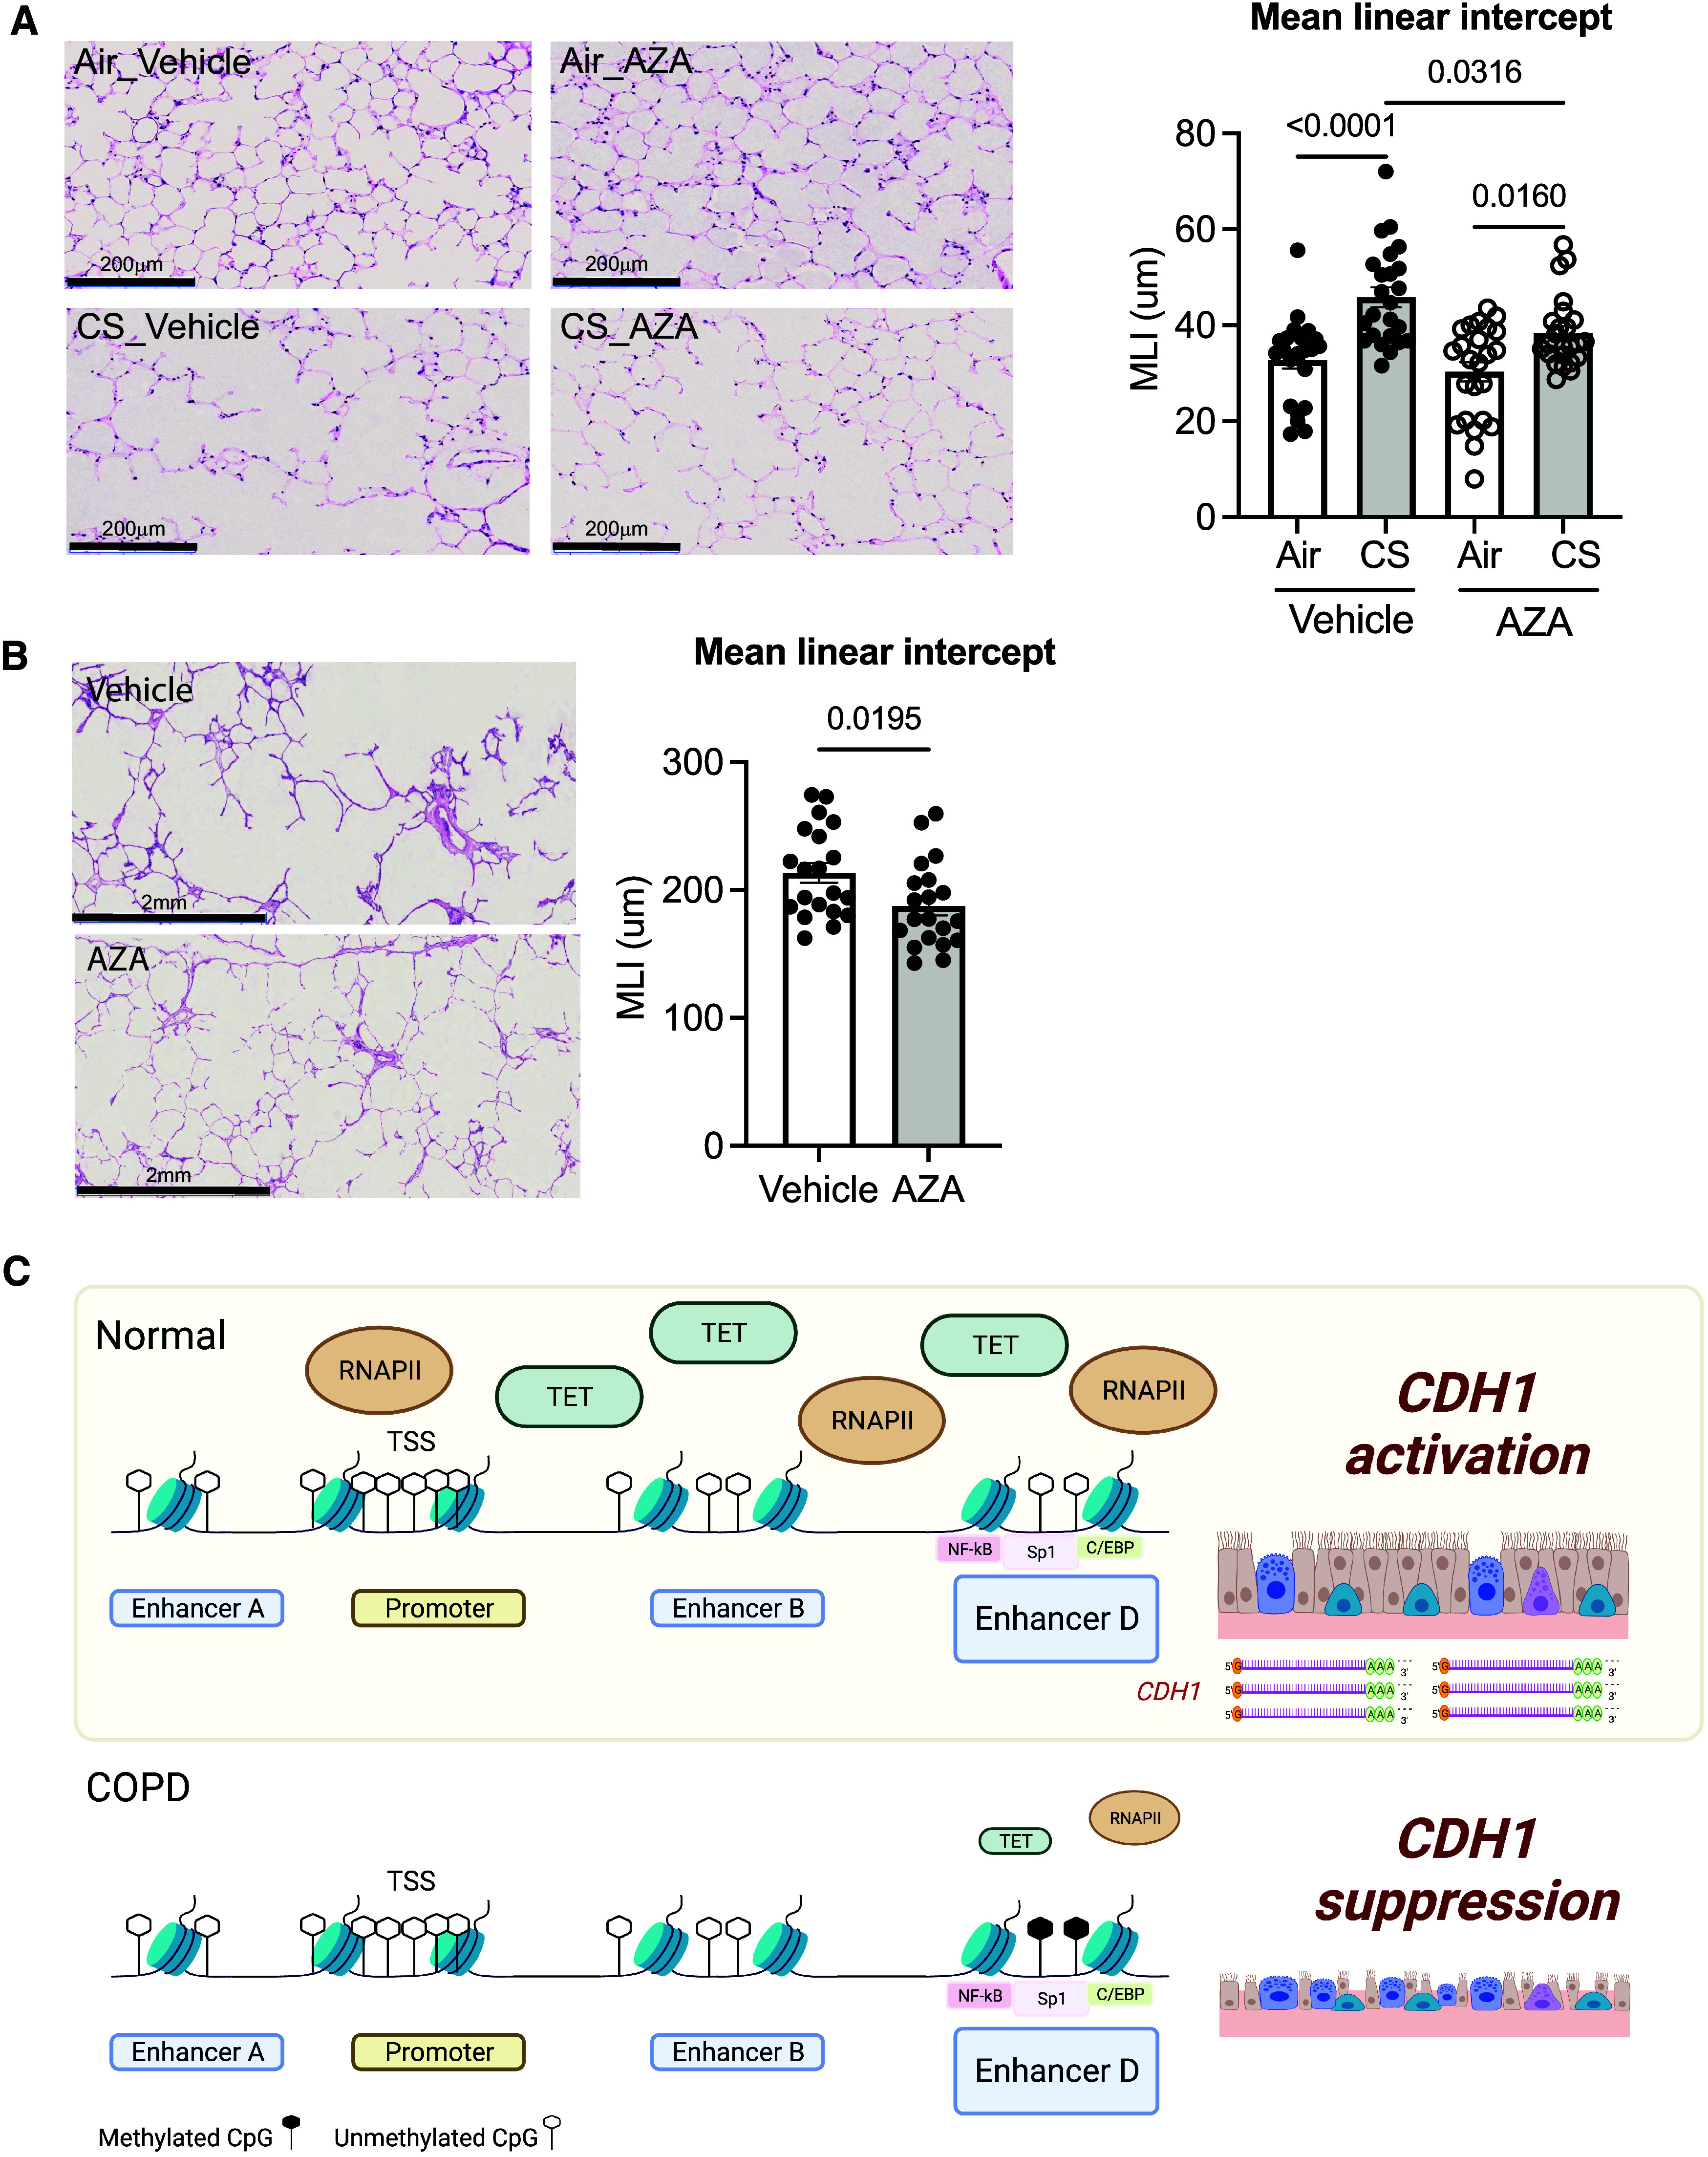
Chronic obstructive pulmonary disease (COPD) remains a major public health challenge that contributes greatly to mortality and morbidity worldwide. Although it has long been recognized that the epithelium is altered in COPD, there has been little focus on targeting it to modify the disease course. Therefore, mechanisms that disrupt epithelial cell function in patients with COPD are poorly understood. In this study, we sought to determine whether epigenetic reprogramming of the cell-cell adhesion molecule E-cadherin, encoded by the CDH1 gene, disrupts epithelial integrity. By reducing these epigenetic marks, we can restore epithelial integrity and rescue alveolar airspace destruction. We used differentiated normal and COPD-derived primary human airway epithelial cells, genetically manipulated mouse tracheal epithelial cells, and mouse and human precision-cut lung slices to assess the effects of epigenetic reprogramming. We show that the loss of CDH1 in COPD is due to increased DNA methylation site at the CDH1 enhancer D through the downregulation of the ten-eleven translocase methylcytosine dioxygenase (TET) enzyme TET1. Increased DNA methylation at the enhancer D region decreases the enrichment of RNA polymerase II binding. Remarkably, treatment of human precision-cut slices derived from patients with COPD with the DNA demethylation agent 5-aza-2'-deoxycytidine decreased cell damage and reduced air space enlargement in the diseased tissue. Here, we present a novel mechanism that targets epigenetic modifications to reverse the tissue remodeling in human COPD lungs and serves as a proof of concept for developing a disease-modifying target.

Keywords: CDH1; COPD; DNA methylation; E-cadherin; epigenetic.


Figures

Figure 1.
Figure 1.
Global DNA demethylating agent 5-aza-2′-deoxcytidine (AZA) restores destructive epithelial integrity in chronic obstructive pulmonary disease (COPD)-derived epithelia. (A and B) Measurement of the barrier function of AZA-treated normal/COPD-derived epithelial cells by (A) transepithelial electrical resistance (TEER) and (B) FITC–dextran flux (n = 12–22). (C and D) Expression of both the cadherin 1 (CDH1) (C) gene and (D) protein. (E) Measurement of TEER in mouse tracheal epithelial cells (mTECs) derived from Cdh1fl/fl mice with Cre-induced Cdh1 knockdown at the air–liquid interface culture (n = 3). Scale bar, 200 μm. The error bars represent SEM. Statistics were determined by ordinary one-way ANOVA with Sidak’s multiple comparison test, with P < 0.05 considered statistically significant. Veh = vehicle.
Figure 2.
Figure 2.
CDH1 gene expression correlates with the expression of ten-eleven translocase dioxygenase (TET1). (A) Correlation of CDH1 gene expression with TET1 in human epithelial cells by Spearman rank correlation analysis (n = 5). (B–E) Gene expressions of (B) CDH1, (C) TET1, (D) TET2, and (E) TET3 in the cigarette-smoking (CS)–exposed normal epithelial cells (n = 6–7). (F) Gene expression of CDH1 in the 16HBE cell line with TET1 knockdown (n = 3). Top: lentivirus transduction efficiency indicated as GFP-tagged fluorescence, 10×. Scale bars, 100 μm. Bottom: CDH1 expression decreases with knockdown of TET1. Error bars represent SEM. Statistics were determined by using Mann-Whitney test in (B–E) and an ordinary one-way ANOVA with Sidak’s multiple comparison test in (F), with P < 0.05 considered statistically significant. Scale bars, 100 μm.
Figure 3.
Figure 3.
Tet1 mediates Cdh1 expression in mTECs. (A–D) Measurement of gene expressions of (A) Tet1, (B) Tet2, and (C) Cdh1, as well as (D) 5-hydroxymethylcytosine (5hmC) level in mTECs derived from wild-type (WT) C57BL/6J or Tet1+/− mice after exposure to acute CS (two cigarettes per day) versus humidified air. (E and F) Gene expressions of (E) Tet1 and (F) Cdh1 in WT C57BL/6J and Tet1+/− mouse lung tissues (n = 8). Error bars represent SEM (four to nine from two independent experiments). Statistics were determined by ordinary one-way ANOVA with Sidak’s multiple comparison tests, compared with WT-air, with P < 0.05 considered statistically significant.
Figure 4.
Figure 4.
The promoter methylation level of CDH1 is not significantly changed in human epithelial cells derived from normal donors and those with COPD. (A) Top: The schematic diagram displays the percentage of cytosine–guanine dinucleotide (CpG) dinucleotide (CG) content in the 5′ promoter region of the CDH1. In an in silico analysis by MethPrimer, four CpG islands (CGIs) were identified (blue) (CG content >60%, an observed:expected ratio = 0.6). Bottom: The average methylation percentage (% Met) of the CDH1 promoter is shown among CGIs. % Met was calculated by taking an average of the methylation level of all CpG sites within CGI1, CGI2, and CGI3 and CGI4 of 3 normal donors (N) and 3 with COPD (C) by bisulfite sequencing. (B) The % Met of individual CpG sites at the CDH1 promoter (6–10 clones per donor). (C and D) Chromatin immunoprecipitation of (C) RNA polymerase II (RNAPII) and (D) histone H3 monomethylated at lysine 4 (H3K4 me1) at the TSS region (5 normal donors and 5 with COPD). Error bars represent SEM. Statistics were determined using (A) Wilcoxon matched-pairs signed rank tests and (C and D) the Mann–Whitney test, with P < 0.05 considered statistically significant. TSS = transcription start site; UTR = untranslated region.
Figure 5.
Figure 5.
DNA hypermethylation in the CDH1 enhancer D region blocks RNAPII binding. (A) The average % Met of the CDH1 enhancers A, B, and D was calculated by taking an average of the methylation level of all CpG sites within enhancers A, B, and D of each donor (N: 5–6 normal donors; C: 5–6 donors with COPD) by bisulfite sequencing. (B) The average % Met of CDH1 enhancers A, B, and D. (C) % Met of each CG site of enhancers A, B, and C are shown in graphs (left) and in dot plots (right) (3 normal donors and 3 with COPD). Unmethylated (open circles) and methylated (closed circles) nucleotides are indicated. Each row of circles corresponds to an individual clone sequenced (9–10 clones per donor). (D and E) The % Met (D) Site 1 (CG Site 9) and (E) CpG Site 2 (CG Site 74) of enhancer D in donors with COPD versus normal donors (8 normal and 8 with COPD). (F and G) Enrichment of (F) RNAPII and (G) H3K4 me1 at the enhancer D region (5 normal and 5 with COPD). (H) The methylation at the CDH1 enhancer D in AZA-treated COPD cells is shown in dot plots (left) and in % Met (right) (9–10 clones per group; 3 donors). (I) Enrichment of RNAPII in AZA-treated COPD cells (n = 3). Error bars represent SEM. Statistics were determined by (A, B, D, E, and H) Wilcoxon matched-pairs signed rank tests and (F, G, and I) Mann–Whitney test, with P < 0.05 considered statistically significant.
Figure 6.
Figure 6.
Global DNA demethylating agent AZA restores lung pulmonary remodeling in both mouse and human lungs. (A) Global DNA methylation in WT C57BL/6J-derived mTECs after acute exposure to CS (two cigarettes or humidified air in a day) (n = 7 from two independent experiments). (B) Cytotoxicity in mouse precision-cut lung slices (PCLSs) from WT C57BL/6J with acute exposure to CS (six cigarettes or humidified air in a day) by LDH level (seven to nine slices from three independent experiments). (C and D) Immunofluorescence of (C) 5-methylcytosine (5mC; red) and nucleus (blue) and of (D) E-cadherin (green), 5hmC (red), and nucleus (blue) of PCLSs derived from WT mice (n = 3 from three independent experiments). Negative controls against rabbit IgG (Rb IgG) and mouse IgG (Ms IgG) are indicated at the bottom. (E and F) Immunofluorescence of (E) 5mC (red) and nucleus (blue) and of (F) E-cadherin (green), 5hmC (red), and nucleus (blue) in human PCLSs derived from patients with COPD (n = 3 from 2 donors). Relative fluorescent intensity is indicated on the right in (E) and at the bottom in (F). The immunofluorescence images were taken at a 63× oil objective. Scale bars, 20 μm. Error bars represent SEM. Statistics were determined by using (A, E, and F) the Mann–Whitney test and (B) one-way ANOVA with Sidak’s multiple comparison tests, with P < 0.05 considered statistically significant. LDH = lactate dehydrogenase.
Figure 7.
Figure 7.
Global DNA demethylating agent AZA restores lung pulmonary remodeling in both mouse and human lungs. (A) In mouse PCLSs from WT C57BL/6J mice with acute exposure to CS (six cigarettes or humidified air in a day), AZA was found to attenuate CS-induced alveolar destruction by measuring the MLI and by hematoxylin and eosin staining (left) at 20× (3 slices from 3 mice). Scale bars, 200 μm. (B) In human PCLSs from patients with COPD, AZA was found to reduce alveolar destruction (10 images per group, 58 chords per image; total, 580 chords per group from two donors) by hematoxylin and eosin staining (left) at 2×. Scale bars, 2 mm. Error bars represent SEM. Statistics were determined by using (A) a one-way ANOVA with Sidak’s multiple comparison tests and (B) the Mann–Whitney test, with P < 0.05 considered statistically significant. (C) A schematic of the epigenetic regulations underlying CDH1 transcription in COPD. DNA hypermethylation at the CDH1 enhancer D region, not the CDH1 promoter, is accompanied by the reduction of RNAPII binding. The downregulation of TET1 in COPD contributed to the methylation pattern at the CDH1 enhancer, leading to barrier dysfunction (created from BioRender.com). MLI = mean linear intercept.

Comment in

References

    1. Joehanes R, Just AC, Marioni RE, Pilling LC, Reynolds LM, Mandaviya PR, et al. Epigenetic signatures of cigarette smoking. Circ Cardiovasc Genet . 2016;9:436–447. - PMC - PubMed
    1. Paksa A, Rajagopal J. The epigenetic basis of cellular plasticity. Curr Opin Cell Biol . 2017;49:116–122. - PMC - PubMed
    1. Feil R, Fraga MF. Epigenetics and the environment: emerging patterns and implications. Nat Rev Genet . 2012;13:97–109. - PubMed
    1. Ho SM. Environmental epigenetics of asthma: an update. J Allergy Clin Immunol . 2010;126:453–465. - PMC - PubMed
    1. Goldberg AD, Allis CD, Bernstein E. Epigenetics: a landscape takes shape. Cell . 2007;128:635–638. - PubMed

Grants and funding

LinkOut - more resources