. 2023 Dec:68:102957.
doi: 10.1016/j.redox.2023.102957. Epub 2023 Nov 3.

Enhanced fatty acid oxidation through metformin and baicalin as therapy for COVID-19 and associated inflammatory states in lung and kidney

Affiliations

Enhanced fatty acid oxidation through metformin and baicalin as therapy for COVID-19 and associated inflammatory states in lung and kidney

Verónica Miguel et al. Redox Biol. 2023 Dec.

Abstract

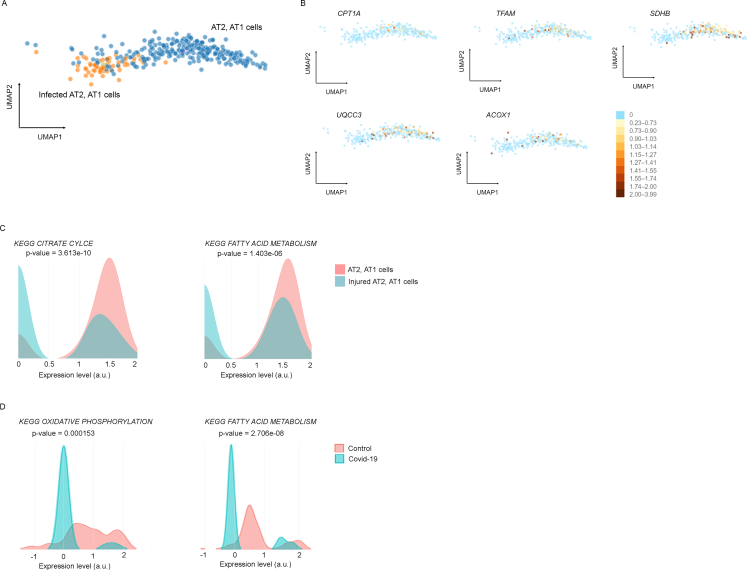
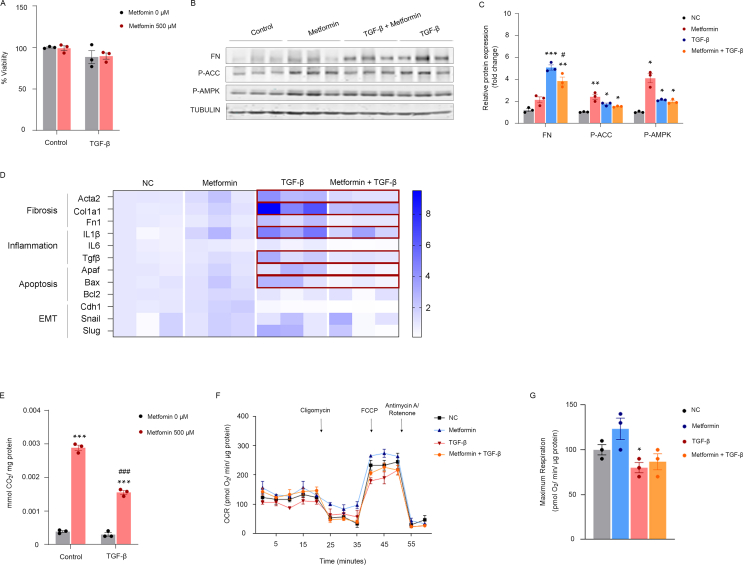
Progressive respiratory failure is the primary cause of death in the coronavirus disease 2019 (COVID-19) pandemic. It is the final outcome of the acute respiratory distress syndrome (ARDS), characterized by an initial exacerbated inflammatory response, metabolic derangement and ultimate tissue scarring. A positive balance of cellular energy may result crucial for the recovery of clinical COVID-19. Hence, we asked if two key pathways involved in cellular energy generation, AMP-activated protein kinase (AMPK)/acetyl-CoA carboxylase (ACC) signaling and fatty acid oxidation (FAO) could be beneficial. We tested the drugs metformin (AMPK activator) and baicalin (CPT1A activator) in different experimental models mimicking COVID-19 associated inflammation in lung and kidney. We also studied two different cohorts of COVID-19 patients that had been previously treated with metformin. These drugs ameliorated lung damage in an ARDS animal model, while activation of AMPK/ACC signaling increased mitochondrial function and decreased TGF-β-induced fibrosis, apoptosis and inflammation markers in lung epithelial cells. Similar results were observed with two indole derivatives, IND6 and IND8 with AMPK activating capacity. Consistently, a reduced time of hospitalization and need of intensive care was observed in COVID-19 patients previously exposed to metformin. Baicalin also mitigated the activation of pro-inflammatory bone marrow-derived macrophages (BMDMs) and reduced kidney fibrosis in two animal models of kidney injury, another key target of COVID-19. In human epithelial lung and kidney cells, both drugs improved mitochondrial function and prevented TGF-β-induced renal epithelial cell dedifferentiation. Our results support that favoring cellular energy production through enhanced FAO may prove useful in the prevention of COVID-19-induced lung and renal damage.

Keywords: COVID-19; Fibrosis; Inflammation; Metabolism; Mitochondria.


Conflict of interest statement

Declaration of competing interest The authors have no conflicts of interest.

Figures

Image 1
Graphical abstract
Fig. 1
Fig. 1
Metformin and baicalin administration ameliorate lung damage and fibrosis in an animal model of LPS-induced ARDS. (A) Timeline of the LPS-induced ARDS mouse model and metformin/baicalin administration. (B) Representative microphotographs from one mouse per group of hematoxylin and eosin (H&E) (upper panels), Masson Trichrome (medium panels) and Sirius Red (lower panels) staining of lungs from mice subjected to LPS-induced ARDS after metformin/baicalin treatment. Scale bars: 25 μm. (C) Heat map of the anatomopathological study of the lung from mice treated as described above. (D) Violin plots of histological semi-quantitative global damage evaluation of the lungs from mice treated as described above. (E) Quantification of Sirius Red staining from (B) represents the mean ± s.e.m. (F) Immunoblots depicting fibronectin (FN), phosphorylated AMP-activated protein kinase (p-AMPK) protein levels in lungs from control and LPS-induced ARDS mice after metformin/baicalin treatment. (G) Bar graphs represent the mean ± s.e.m. of fold changes corresponding to densitometric analyses from (F), n = 6 mice. (H) Violin plots of mRNA levels of fibrosis-associated genes determined by qRT-PCR in lungs from mice treated as described above. Bar graphs represent the mean ± s.e.m. of fold changes. (I) Representative micrographs of one mouse per group showing the expression of BAX in lung sections of mice treated as described above. Scale bar = 25 μm. (J) Bar graph represents the quantification of the mean ± s.e.m. of % of BAX positive stained area in lungs from mice treated as described above. n = 5–8, mice *P < 0.05, **P < 0.01, ***P < 0.001 compared to control lungs; #P < 0.05 compared to lungs from LPS-induced ARDS mice. Statistical analysis for more than two groups was done with Kruskal-Wallis test. (For interpretation of the references to colour in this figure legend, the reader is referred to the Web version of this article.)
Fig. 2
Fig. 2
Metformin increases mitochondrial function and decreases TGF-β-induced fibrosis, apoptosis and inflammation markers in human lung epithelial cells. (A) Bar graph represents the % of viable BEAS-2B cells under the treatment with 20 ng/ml TGF-β1 and/or 500 μM metformin. (B) Heat map of the mRNA levels of fibrosis-associated genes were determined by qRT-PCR in BEAS-2B cells treated as in (A). Genes whose expression is significantly reduced in the “Metformin + TGF-β1” condition compared to “TGF-β1” are boxed in red. (C) Radiolabeled palmitate-derived CO2 was determined after incubation of cells treated as in (A) with 14C-palmitate. (D) Oxygen consumption rate (OCR) of BEAS-2B cells treated as in (A) was measured with a Seahorse XFe96 Extracellular Flux Analyzer. (E) Bar graphs show the rates of OCR associated with maximum reserve capacity status. (F) Immunoblots depicting phosphorylated SMAD3 (p-SMAD3) protein levels in BEAS-2B cells treated with 20 ng/ml TGF-β1 and/or 500 μM metformin. (G) Bar graphs represent the mean ± s.e.m. of fold changes corresponding to densitometric analyses from (F). (H) Immunoblots depicting fibronectin (FN), phosphorylated AMP-activated protein kinase (p-AMPK), acetyl-CoA carboxylase (p-ACC) and SMAD3 (p-SMAD3) protein levels in BEAS-2B cells treated 500 μM metformin 24 h after than 20 ng/ml TGF-β1. (I) Bar graphs represent the mean ± s.e.m. of fold changes corresponding to densitometric analyses from (H). (A, B, C, F, H) n = 3 independent experiments. Each data point (D, E) represents the mean ± s.e.m of triplicate measures from 4 independent experiments. *P < 0.05, **P < 0.01, ***P < 0.001 compared to control cells; #P < 0.05, ###P < 0.001 compared to cells treated with TGF-β1. Statistical analysis for more than two groups was done with Kruskal-Wallis test. (For interpretation of the references to colour in this figure legend, the reader is referred to the Web version of this article.)
Fig. 3
Fig. 3
Baicalin increases mitochondrial function and decreases TGF-β-induced fibrosis, apoptosis and inflammation markers in human lung epithelial cells. (A) Bar graph represents the % of viable BEAS-2B cells treated with 20 ng/ml TGF-β1 and/or 300 μM baicalin. (B) Heat map of the mRNA levels of fibrosis-associated genes were determined by qRT-PCR in BEAS-2B cells treated as in (A). Genes whose expression is significantly reduced in the “Baicalin + TGF-β1” condition compared to “TGF-β1” are boxed in red. (C) Radiolabeled palmitate-derived CO2 was determined after incubation of cells treated as in (A) with 14C-palmitate. (D) Oxygen consumption rate (OCR) of BEAS-2B cells treated as in (A) was measured with a Seahorse XFe96 Extracellular Flux Analyzer. (E) Bar graphs show the rates of OCR associated to maximum reserve capacity status. (F) Immunoblots depicting phosphorylated SMAD3 (p-SMAD3) protein levels in BEAS-2B cells treated with 20 ng/ml TGF-β1 and/or 300 μM baicalin. (G) Bar graphs represent the mean ± s.e.m. of fold changes corresponding to densitometric analyses from (F). (H) Immunoblots depicting fibronectin (FN), phosphorylated AMP-activated protein kinase (p-AMPK), acetyl-CoA carboxylase (p-ACC) and SMAD3 (p-SMAD3) protein levels in BEAS-2B cells treated 300 μM baicalin 24 h after than 20 ng/ml TGF-β1. (I) Bar graphs represent the mean ± s.e.m. of fold changes corresponding to densitometric analyses from (H). (A, B, C, F, H) n = 3 independent experiments. Each data point (D, E) represents the mean ± s.e.m of triplicates from 4 independent experiments. *P < 0.05, **P < 0.01, ***P < 0.001 compared to control cells; #P < 0.05, ##P < 0.01 compared to cells treated with TGF-β1. Statistical analysis for more than two groups was done with Kruskal-Wallis test. (For interpretation of the references to colour in this figure legend, the reader is referred to the Web version of this article.)
Fig. 4
Fig. 4
Metformin and baicalin counteract macrophage-associated inflammation. (A) Representative micrographs of one mouse per group showing the expression of F4/80 (upper panels), CD86 (central panels) and IL-6 (lower panels) in lung sections of mice subjected to LPS-induced ARDS after Metformin/Baicalin treatment. Scale bar = 25 μm. (BD) Bar graph represents the quantification of the mean ± s.e.m. of % of F4/80 (B), CD86 (C) and IL-6 (D) positive stained area in lungs from mice treated as described above. n = 5–8 mice. (E) Timeline of the bone marrow-derived macrophage (BMDM) differentiation toward an M1 macrophage phenotype. (F) mRNA levels of IL-6 and IL-1β were determined by qRT-PCR in BMDMs from (E) under 500 μM metformin or 300 μM baicalin treatment. (G) Representative multiparameter flow cytometry dot plots showing the gating strategy for BMDMs from (E) (upper panels). Fluorescence intensity distribution depicting the expression level of the macrophage activation markers: CD86, CD80 and MHCII determined by flow cytometry in the total BMDM population (F4/80+, CD11b+) under 500 μM metformin or 300 μM baicalin treatment (lower panels). (H) Bar graphs represent the fluorescence intensity of CD86, CD80 and MHCII from (G), median ± s.e.m of 3 independent experiments, each performed in triplicate. *P < 0.05, **P < 0.01, ***P < 0.001 compared to control lungs (B–D) or cells (F, H); #P < 0.05, ##P < 0.01, ###P < 0.001 compared to lungs from LPS-induced ARDS mice (B–D) or cells treated with LPS + INF-γ (F, H). Statistical analysis for more than two groups was done with Kruskal-Wallis test.
Fig. 5
Fig. 5
Effect of metformin treatment on clinical parameters and outcomes in COVID-19 patients. (A) Graph depicting the characteristics (number of patients, age and sex) of the general patient cohort. (B) Bubble graph indicating initial pneumonia severity according to the radiological pattern (0: None, 1: Consolidation, 2: Ground-glass opacity, 3: Bronchiectasis, 4: Atelectasis, 5: Fibrosis, 6: Pulmonary embolism), days of hospitalization and % patients who needed intensive care within the cohort in (A). (C) Bar graph shows the % of different respiratory therapeutic modalities within patients from (A). IMV: Invasive mechanical ventilation, NIMV: Non-invasive mechanical ventilation, HFOT: High Flow Oxygen Therapy, OT: Oxygen therapy. (D) Heat map of the mMRC (modified Medical Research Council Dyspnea Scale) evaluation over time from patients in (A). (E) mRNA levels of ADGRE1 gene were determined by qRT-PCR in cells isolated from bronchoalveolar lavage (BAL) of 19 patients from cohort in (A). (F) Graph depicting the characteristics (number of patients, age and sex) of the diabetic patient cohort. (G) Bubble graph indicating initial pneumonia severity according to the radiological pattern, days of hospitalization and % patients who needed intensive care within the cohort in (F). (H) Bar graph shows the % of different respiratory therapeutic modalities as in (C) within patients from (F). (I) Heat map of the mMRC evaluation over time from patients in (F). *P < 0.05 compared to control. Statistical analysis for more than two independent groups was performed with Mann-Whitney test. The Chi-Square test was used to determine associations between variables.
Fig. 6
Fig. 6
Metformin and baicalin administration reduce UUO and FAN-induced kidney fibrosis. (A) Timeline of the unilateral ureteral obstruction (UUO) mouse model and metformin/baicalin administration. (B) Representative microphotographs from one mouse per group of hematoxylin and eosin (H&E) (upper panels) and Sirius Red (lower panels) staining of kidneys from mice subjected to UUO after metformin/baicalin treatment. Scale bars: 25 μm. (C) Quantification of Sirius Red staining from (B) represents the mean ± s.e.m, n = 7 mice. (D) Violin plots of mRNA levels of fibrosis-associated genes determined by qRT-PCR in kidneys from mice treated as described in (A). (E) Immunoblots depicting fibronectin (FN), phosphorylated AMP-activated protein kinase (p-AMPK) and alfa-smooth muscle actin (α-SMA) protein levels in kidneys from control and UUO mice after metformin/baicalin treatment. (F) Bar graphs represent the mean ± s.e.m. of fold changes corresponding to densitometric analyses from (E), n = 7 mice. (G) Timeline of the folic acid nephropathy (FAN) mouse model and metformin/baicalin administration. (H) Representative microphotographs from one mouse per group of hematoxylin and eosin (H&E) (upper panels) and Sirius Red (lower panels) staining of kidneys from mice subjected to FAN after metformin/baicalin treatment. Scale bars: 25 μm. (I) Quantification of Sirius Red staining from (H) represents the mean ± s.e.m, n = 6–10 mice. (J) Violin plots of mRNA levels of fibrosis-associated genes determined by qRT-PCR in kidneys from mice treated as described in (G). (K) Immunoblots depicting phosphorylated Acyl-CoA carboxylase (P-ACC), fibronectin (FN) and phosphorylated AMP-activated protein kinase (p-AMPK) protein levels in kidneys from control and FAN mice after metformin/baicalin treatment. (L) Bar graphs represent the mean ± s.e.m. of fold changes corresponding to densitometric analyses from (K), n = 7–9 mice. *P < 0.05, **P < 0.01, ***P < 0.001 compared to control lungs; #P < 0.05, ##P < 0.01, ###P < 0.001 compared to kidneys from mice subjected to UUO or FAN. Statistical analysis for more than two groups was performed with Kruskal-Wallis test. (For interpretation of the references to colour in this figure legend, the reader is referred to the Web version of this article.)
Fig. 7
Fig. 7
Metformin and baicalin improve mitochondrial function and prevent TGF-β-induced renal epithelial cell dedifferentiation. (A) Bar graph represents the % of viable HRPTEC cells treated or not with 20 ng/ml TGF-β1 and/or 500 μM metformin. (B) Immunoblots depicting fibronectin (FN), phosphorylated AMP-activated protein kinase (p-AMPK) and acetyl-CoA carboxylase (p-ACC) protein levels in HRPTEC cells treated as in (A). (C) Bar graphs represent the mean ± s.e.m. of fold changes corresponding to densitometric analyses from (B). (D) Heat map of the mRNA levels of fibrosis-associated genes were determined by qRT-PCR in HRPTEC cells treated as in (A). Genes whose expression is significantly reduced in the “Metformin + TGF-β1” condition compared to “TGF-β1” are boxed in red. (E) Radiolabeled palmitate-derived CO2 was determined after incubation of cells treated as in (A) with 14C-palmitate. (F) Bar graph represents the % of viable HRPTEC cells treated or not with 20 ng/ml TGF-β1 and/or 300 μM baicalin. (G) Immunoblots depicting fibronectin (FN), phosphorylated AMP-activated protein kinase (p-AMPK) and acetyl-CoA carboxylase (p-ACC) protein levels in HRPTEC cells treated as in (F). (H) Bar graphs represent the mean ± s.e.m. of fold changes corresponding to densitometric analyses from (G). (I) Heat map of the mRNA levels of fibrosis-associated genes were determined by qRT-PCR in HRPTEC cells treated as in (F). Genes whose expression is significantly reduced in the “Baicalin + TGF-β1” condition compared to “TGF-β1” are boxed in red. (J) Radiolabeled palmitate-derived CO2 was determined after incubation of cells treated as in (F) with 14C-palmitate, n = 3 independent experiments. *P < 0.05, **P < 0.01, ***P < 0.01 compared to control cells; #P < 0.05, ##P < 0.01 compared to cells treated with TGF-β1. Statistical analysis for more than two groups was done with Kruskal-Wallis test. (For interpretation of the references to colour in this figure legend, the reader is referred to the Web version of this article.)
Fig. 8
Fig. 8
Homozygous renal tubule overexpression of CPT1A results in enhanced protection from renal fibrosis. (A) Genomic DNA analysis by PCR for the Pax8-rtTA allele generates a 450-bp amplicon, while the FRT amplicons (400-bp and 294 bp) correspond to the tetO-Cpt1a alleles. The presence of two bands (left lane boxed in red) or a single 400-bp band (right lane boxed in red) denotes heterozygosity or homozygosity for the tetO-CPT1A allele, respectively. The 294-bp band (middle lane boxed in red) corresponds to the WT allele. See Supplemental Fig. 10A, Supplemental Table 6 and ref. [14] for details. (B) Timeline of the folic acid nephropathy (FAN) mouse model in control (WT), heterozygous (Pax8Cpt1a/+ HET) and homozygous (Pax8Cpt1a/Cpt1a HOM) CPT1A overexpressing mice. (C) mRNA levels of Cpt1a gene were determined by qRT-PCR in kidneys from mice treated as described in (B). (D) Immunoblots depicting CPT1A protein levels in kidneys from Pax8Cpt1a/+ HET or Pax8Cpt1a/Cpt1a HOM mice treated as described in (B). (E) Bar graphs represent the mean ± s.e.m. of fold changes corresponding to densitometric analyses from (D). (F) Representative microphotographs from one mouse per group of hematoxylin and eosin (H&E) (upper panels) and Sirius Red (lower panels) staining of kidneys from WT, Pax8Cpt1a/+ HET or Pax8Cpt1a/Cpt1a HOM mice subjected to FAN. Scale bars: 25 μm. (G) Quantification of Sirius Red staining from (F) represents the mean ± s.e.m. (H) Violin plots of mRNA levels of fibrosis-associated genes determined by qRT-PCR in kidneys from WT, Pax8Cpt1a/+ HET or Pax8Cpt1a/Cpt1a HOM mice treated as described in (B). Bar graphs represent the mean ± s.e.m. of fold changes, n = 6 mice. *P < 0.05, **P < 0.01 compared to control lungs; #P < 0.05, ##P < 0.01 compared to kidneys from FAN mice. Statistical analysis for more than two groups was done with Kruskal-Wallis test. (For interpretation of the references to colour in this figure legend, the reader is referred to the Web version of this article.)
figs1
figs1
figs2
figs2
figs3
figs3
figs4
figs4
figs5
figs5
figs6
figs6
figs7
figs7
figs8
figs8
figs9
figs9
figs10
figs10

References

    1. Jackson C.B., Farzan M., Chen B., et al. Mechanisms of SARS-CoV-2 entry into cells. Nat. Rev. Mol. Cell Biol. 2022;23:3–20. - PMC - PubMed
    1. Berlin D.A., Gulick R.M., Martinez F.J. Severe covid-19. N. Engl. J. Med. 2020;383:2451–2460. - PubMed
    1. Matheson N.J., Lehner P.J. How does SARS-CoV-2 cause COVID-19? Science. 2020;369:510–511. - PubMed
    1. Fajgenbaum D.C., June C.H. Cytokine storm. N. Engl. J. Med. 2020;383:2255–2273. - PMC - PubMed
    1. Ayres J.S. A metabolic handbook for the COVID-19 pandemic. Nat. Metab. 2020;2:572–585. - PMC - PubMed

LinkOut - more resources