

The 2023 report of the Lancet Countdown on health and climate change: the imperative for a health-centred response in a world facing irreversible harms
- PMID: 37977174
- PMCID: PMC7616810
- DOI: 10.1016/S0140-6736(23)01859-7
The 2023 report of the Lancet Countdown on health and climate change: the imperative for a health-centred response in a world facing irreversible harms
Abstract
The Lancet Countdown is an international research collaboration that independently monitors the evolving impacts of climate change on health, and the emerging health opportunities of climate action. In its eighth iteration, this 2023 report draws on the expertise of 114 scientists and health practitioners from 52 research institutions and UN agencies worldwide to provide its most comprehensive assessment yet.
In 2022, the Lancet Countdown warned that people’s health is at the mercy of fossil fuels and stressed the transformative opportunity of jointly tackling the concurrent climate change, energy, cost-of-living, and health crises for human health and wellbeing. This year’s report finds few signs of such progress. At the current 10-year mean heating of 1·14°C above pre-industrial levels, climate change is increasingly impacting the health and survival of people worldwide, and projections show these risks could worsen steeply with further inaction. However, with health matters gaining prominence in climate change negotiations, this report highlights new opportunities to deliver health-promoting climate change action and a safe and thriving future for all.
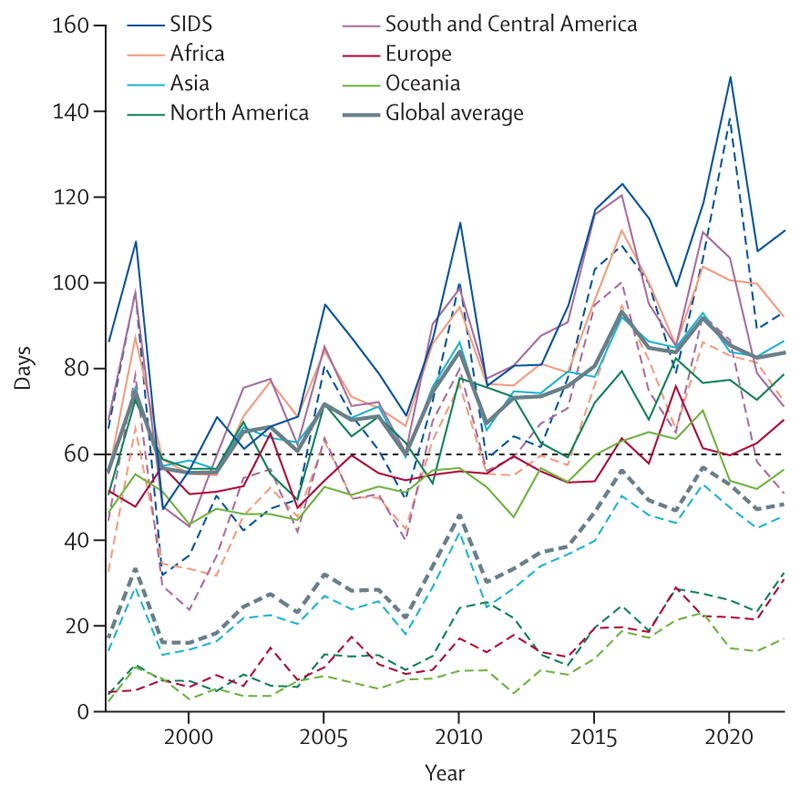
The rising health toll of a changing climate: In 2023, the world saw the highest global temperatures in over 100 000 years, and heat records were broken in all continents through 2022. Adults older than 65 years and infants younger than 1 year, for whom extreme heat can be particularly life-threatening, are now exposed to twice as many heatwave days as they would have experienced in 1986–2005 (indicator 1.1.2). Harnessing the rapidly advancing science of detection and attribution, new analysis shows that over 60% of the days that reached health-threatening high temperatures in 2020 were made more than twice as likely to occur due to anthropogenic climate change (indicator 1.1.5); and heat-related deaths of people older than 65 years increased by 85% compared with 1990–2000, substantially higher than the 38% increase that would have been expected had temperatures not changed (indicator 1.1.5).
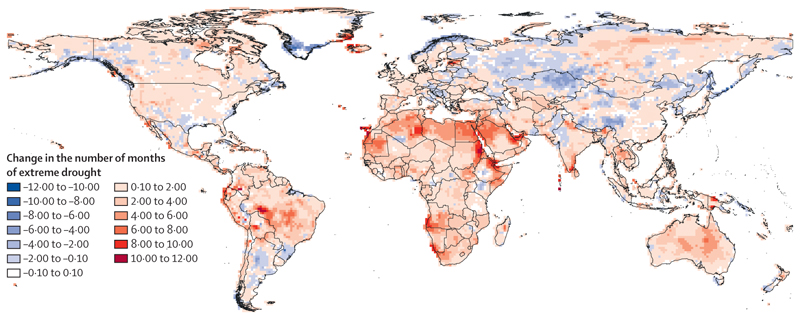
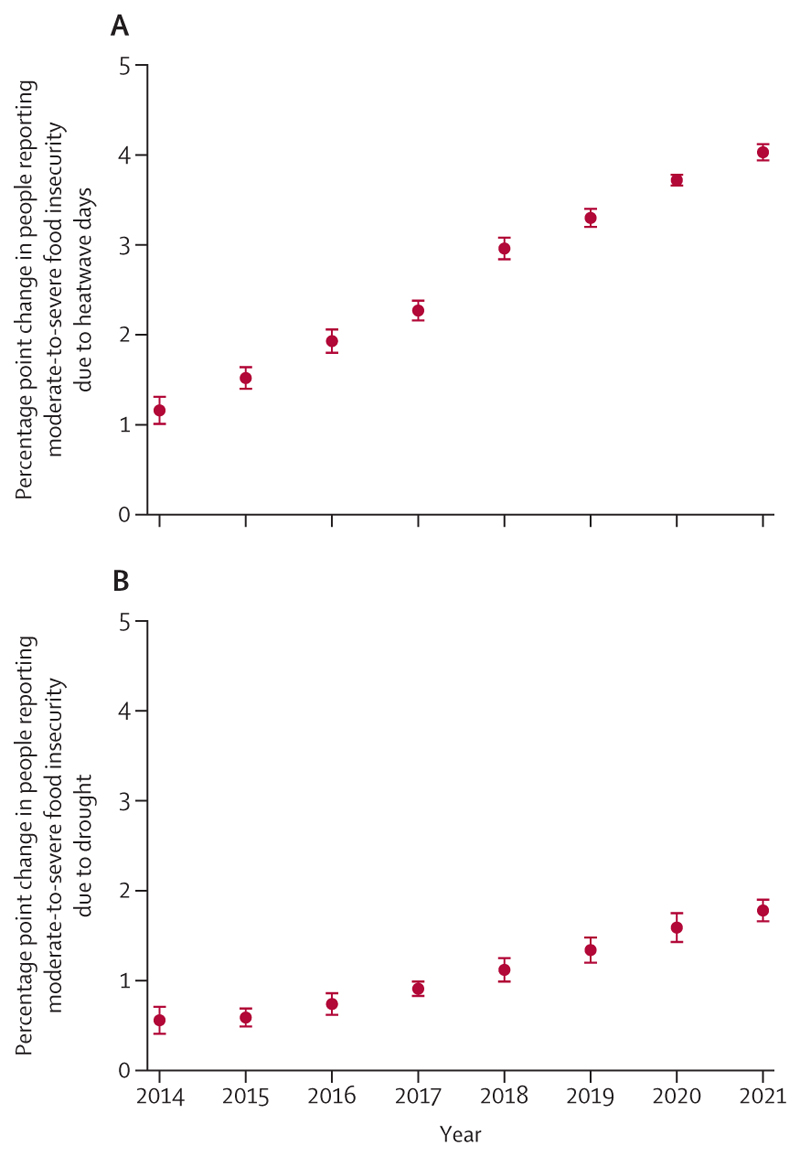
Simultaneously, climate change is damaging the natural and human systems on which people rely for good health. The global land area affected by extreme drought increased from 18% in 1951–60 to 47% in 2013–22 (indicator 1.2.2), jeopardising water security, sanitation, and food production. A higher frequency of heatwaves and droughts in 2021 was associated with 127 million more people experiencing moderate or severe food insecurity compared with 1981–2010 (indicator 1.4), putting millions of people at risk of malnutrition and potentially irreversible health effects. The changing climatic conditions are also putting more populations at risk of life-threatening infectious diseases, such as dengue, malaria, vibriosis, and West Nile virus (indicator 1.3).
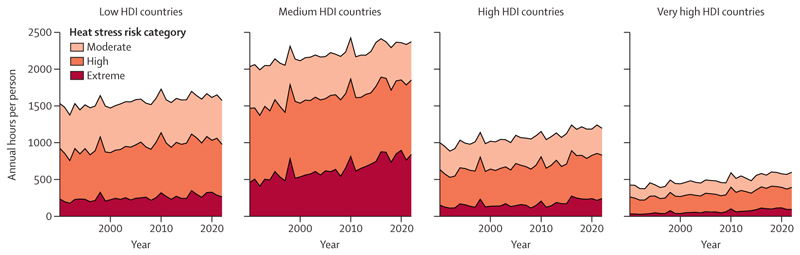
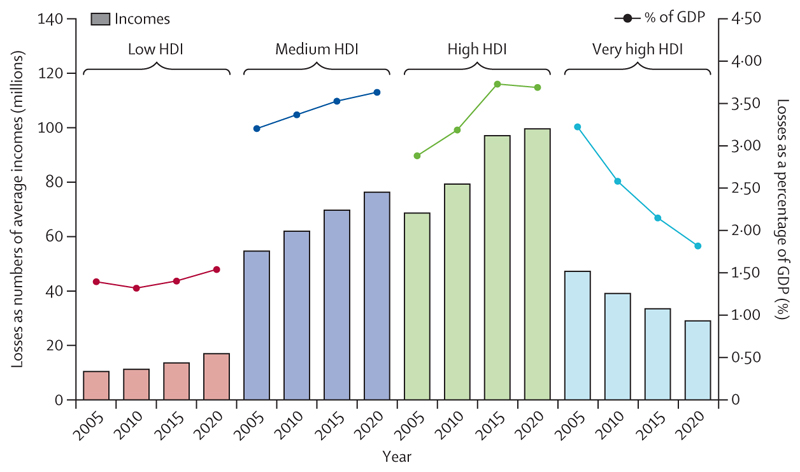
Compounding these direct health impacts, the economic losses associated with global heating increasingly harm livelihoods, limit resilience, and restrict the funds available to tackle climate change. Economic losses from extreme weather events increased by 23% between 2010–14 and 2018–22, amounting to US$264 billion in 2022 alone (indicator 4.1.1), whereas heat exposure led to global potential income losses worth $863 billion (indicators 1.1.4 and 4.1.3). Labour capacity loss resulting from heat exposure affected low and medium Human Development Index (HDI) countries the most, exacerbating global inequities, with potential income losses equivalent to 6·1% and 3·8% of their gross domestic product (GDP), respectively (indicator 4.1.3).
The multiple and simultaneously rising risks of climate change are amplifying global health inequities and threatening the very foundations of human health. Health systems are increasingly strained, and 27% of surveyed cities declared concerns over their health systems being overwhelmed by the impacts of climate change (indicator 2.1.3). Often due to scarce financial resources and low technical and human capacity, the countries most vulnerable to climate impacts also face the most challenges in achieving adaptation progress, reflecting the human risks of an unjust transition. Only 44% of low HDI countries and 54% of medium HDI countries reported high implementation of health emergency management capacities in 2022, compared with 85% of very high HDI countries (indicator 2.2.5). Additionally, low and medium HDI countries had the highest proportion of cities not intending to undertake a climate change risk assessment in 2021 (12%; indicator 2.1.3). These inequalities are aggravated by the persistent failure of the wealthiest countries to deliver the promised modest annual sum of $100 billion to support climate action in those countries defined as developing within the UN Framework Convention on Climate Change. Consequently, those countries that have historically contributed the least to climate change are bearing the brunt of its health impacts—both a reflection and a direct consequence of the structural inequities that lie within the root causes of climate change.
The human costs of persistent inaction: The growing threats experienced to date are early signs and symptoms of what a rapidly changing climate could mean for the health of the world’s populations. With 1337 tonnes of CO2 emitted each second, each moment of delay worsens the risks to people’s health and survival.
In this year’s report, new projections reveal the dangers of further delays in action, with every tracked health dimension worsening as the climate changes. If global mean temperature continues to rise to just under 2°C, annual heat-related deaths are projected to increase by 370% by midcentury, assuming no substantial progress on adaptation (indicator 1.1.5). Under such a scenario, heat-related labour loss is projected to increase by 50% (indicator 1.1.4), and heatwaves alone could lead to 524·9 million additional people experiencing moderate-to-severe food insecurity by 2041–60, aggravating the global risk of malnutrition. Life-threatening infectious diseases are also projected to spread further, with the length of coastline suitable for Vibrio pathogens expanding by 17–25%, and the transmission potential for dengue increasing by 36–37% by midcentury. As risks rise, so will the costs and challenges of adaptation. These estimates provide some indication of what the future could hold. However, poor accounting for non-linear responses, tipping points, and cascading and synergistic interactions could render these projections conservative, disproportionately increasing the threat to the health of populations worldwide.
A world accelerating in the wrong direction: The health risks of a 2°C hotter world underscore the health imperative of accelerating climate change action. With limits to adaptation drawing closer, ambitious mitigation is paramount to keep the magnitude of health hazards within the limits of the capacity of health systems to adapt. Yet years of scientific warnings of the threat to people’s lives have been met with grossly insufficient action, and policies to date have put the world on track to almost 3°C of heating.
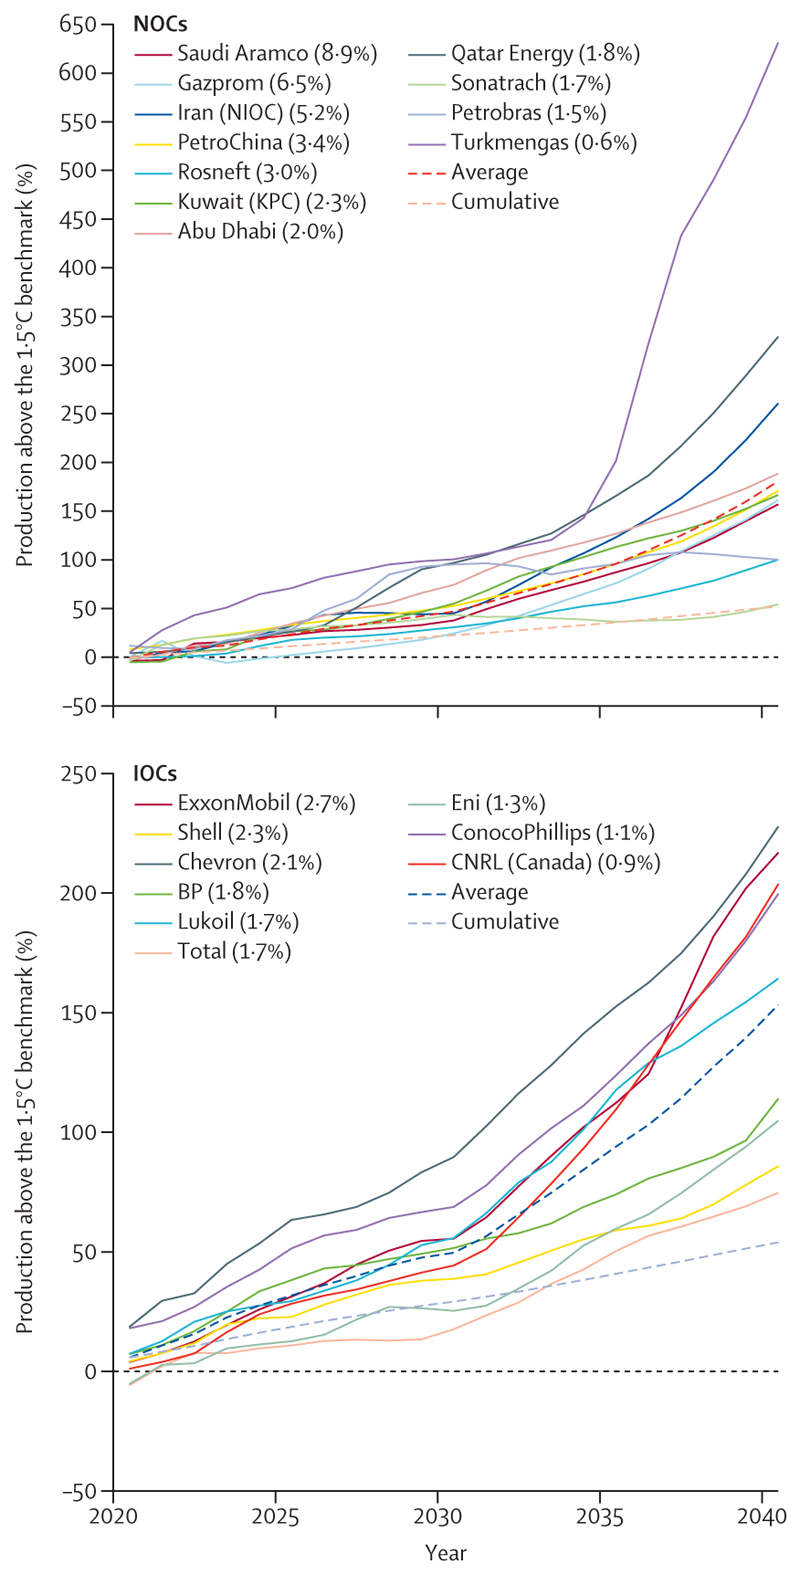
The 2022 Lancet Countdown report highlighted the opportunity to accelerate the transition away from health-harming fossil fuels in response to the global energy crisis. However, data this year show a world that is often moving in the wrong direction. Energy-related CO2 emissions increased by 0·9% to a record 36·8 Gt in 2022 (indicator 3.1.1), and still only 9·5% of global electricity comes from modern renewables (mainly solar and wind energy), despite their costs falling below that of fossil fuels. Concerningly, driven partly by record profits, oil and gas companies are further reducing their compliance with the Paris Agreement: the strategies of the world’s 20 largest oil and gas companies as of early 2023 will result in emissions surpassing levels consistent with the Paris Agreement goals by 173% in 2040—an increase of 61% from 2022 (indicator 4.2.6). Rather than pursuing accelerated development of renewable energy, fossil fuel companies allocated only 4% of their capital investment to renewables in 2022.
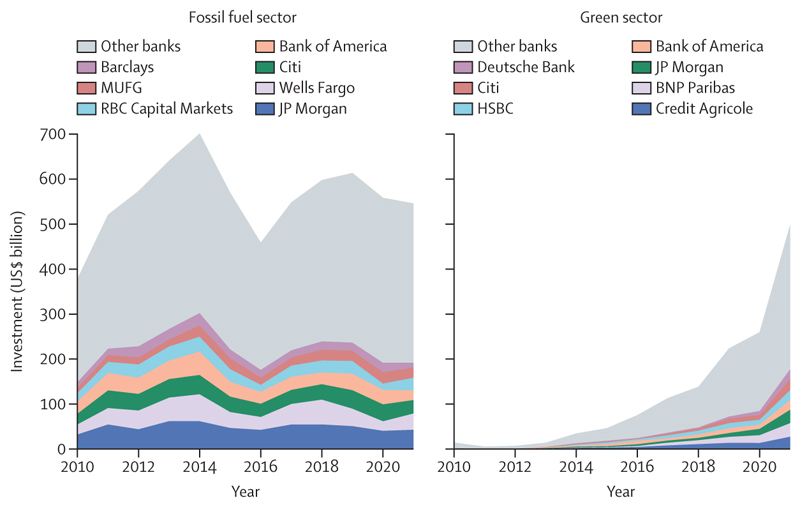
Meanwhile, global fossil fuel investment increased by 10% in 2022, reaching over $1 trillion (indicator 4.2.1). The expansion of oil and gas extractive activities has been supported through both private and public financial flows. Across 2017–21, the 40 banks that lend most to the fossil fuel sector collectively invested $489 billion annually in fossil fuels (annual average), with 52% increasing their lending from 2010–16. Simultaneously, in 2020, 78% of the countries assessed, responsible for 93% of all global CO2 emissions, still provided net direct fossil fuels subsidies totalling $305 billion, further hindering fossil fuel phase-out (indicator 4.2.4). Without a rapid response to course correct, the persistent use and expansion of fossil fuels will ensure an increasingly inequitable future that threatens the lives of billions of people alive today.
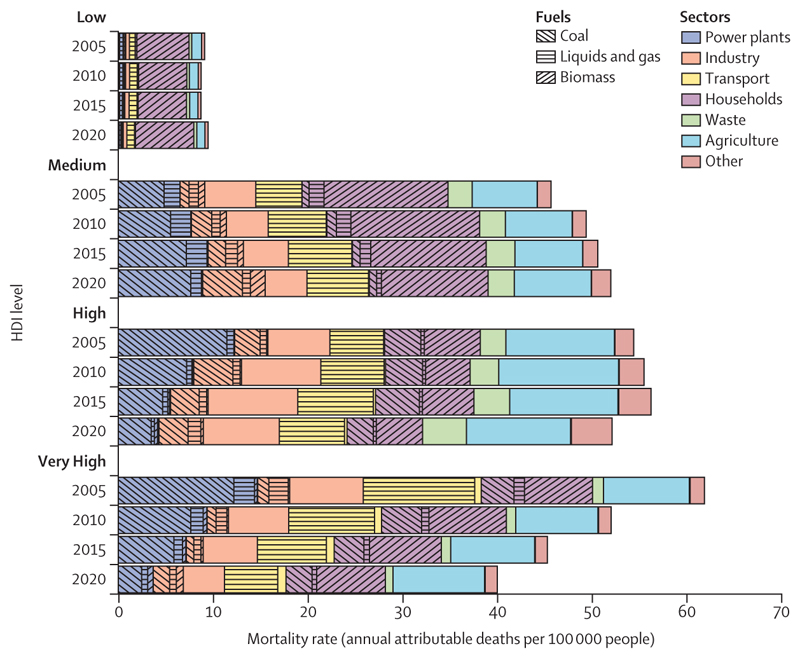
The opportunity to deliver a healthy future for all: Despite the challenges, data also expose the transformative health benefits that could come from the transition to a zero-carbon future, with health professionals playing a crucial role in ensuring these gains are maximised. Globally, 775 million people still live without electricity, and close to 1 billion people are still served by health-care facilities without reliable energy. With structural global inequities in the development of, access to, and use of clean energy, only 2·3% of electricity in low HDI countries comes from modern renewables (against 11% in very high HDI countries), and 92% of households in low HDI countries still rely on biomass fuels to meet their energy needs (against 7·5% in very high HDI countries; indicators 3.1.1 and 3.1.2). In this context, the transition to renewables can enable access to decentralised clean energy and, coupled with interventions to increase energy efficiency, can reduce energy poverty and power high quality health-supportive services. By reducing the burning of dirty fuels (including fossil fuels and biomass), such interventions could help avoid a large proportion of the 1·9 million deaths that occur annually from dirty-fuel-derived, outdoor, airborne, fine particulate matter pollution (PM2·5; indicator 3.2.1), and a large proportion of the 78 deaths per 100 000 people associated with exposure to indoor air pollution (indicator 3.2.2). Additionally, the just development of renewable energy markets can generate net employment opportunities with safer, more locally available jobs. Ensuring countries, particularly those facing high levels of energy poverty, are supported in the safe development, deployment, and adoption of renewable energy is key to maximising health gains and preventing unjust extractive industrial practices that can harm the health and livelihoods of local populations and widen health inequities.
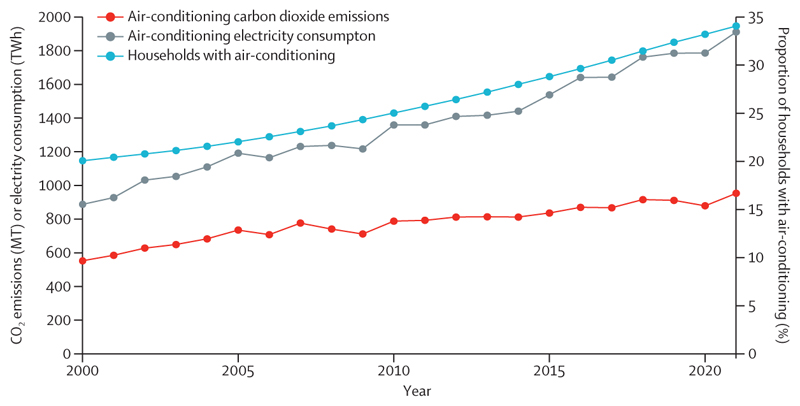
With fossil fuels accounting for 95% of road transport energy (indicator 3.1.3), interventions to enable and promote safe active travel and zero-emission public transport can further deliver emissions reduction, promote health through physical activity, and avert many of the 460 000 deaths caused annually by transport-derived PM2·5 pollution (indicator 3.2.1), and some of the 3·2 million annual deaths related to physical inactivity. People-centred, climate-resilient urban redesign to improve building energy efficiency, increase green and blue spaces, and promote sustainable cooling, can additionally prevent heat-related health harms, avoid air-conditioning-derived emissions (indicator 2.2.2), and provide direct physical and mental health benefits.
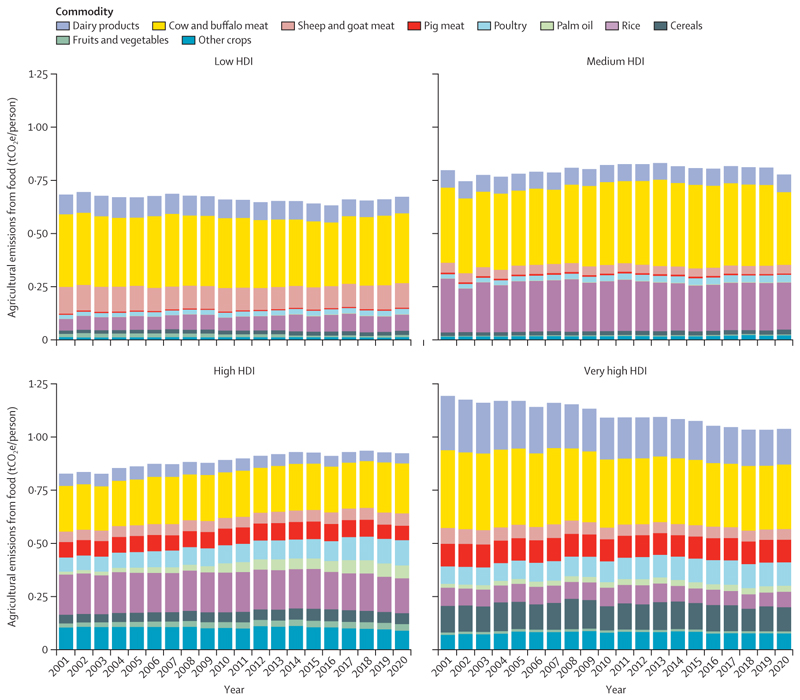
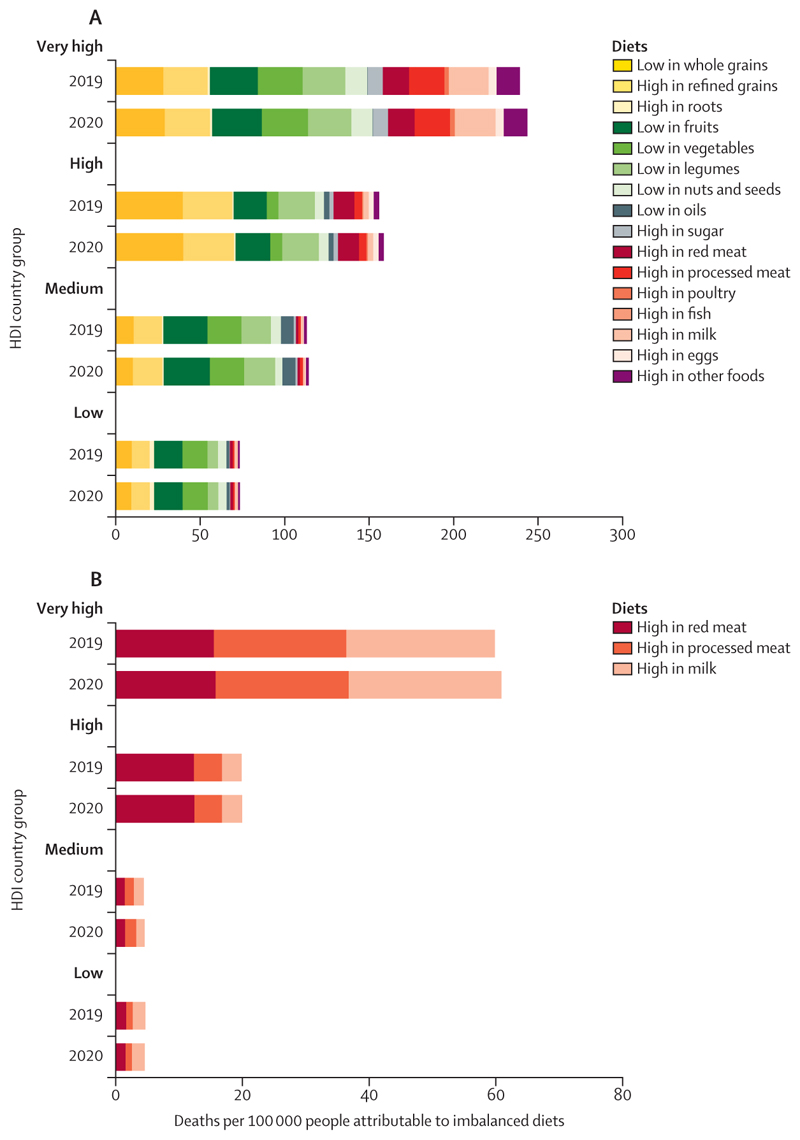
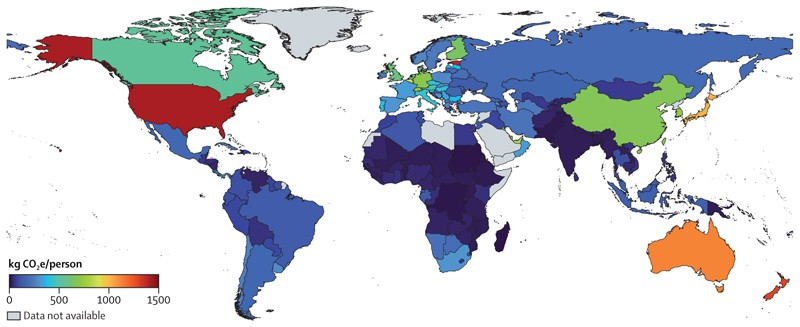
Additionally, food systems are responsible for 30% of global greenhouse gas (GHG) emissions, with 57% of agricultural emissions in 2020 being derived from the production of red meat and milk (indicator 3.3.1). Promoting and enabling equitable access to affordable, healthy, low-carbon diets that meet local nutritional and cultural requirements can contribute to mitigation, while preventing many of the 12·2 million deaths attributable to suboptimal diets (indicator 3.3.2).
The health community could play a central role in securing these benefits, by delivering public health interventions to reduce air pollution, enabling and supporting active travel and healthier diets, and promoting improvements in the environmental conditions and commercial activities that define health outcomes. Importantly, the health sector can lead by example and transition to sustainable, resource-efficient, net-zero emission health systems, thereby preventing its 4·6% contribution to global GHG emissions, with cascading impacts ultimately affecting the broader economy (indicator 3.4).
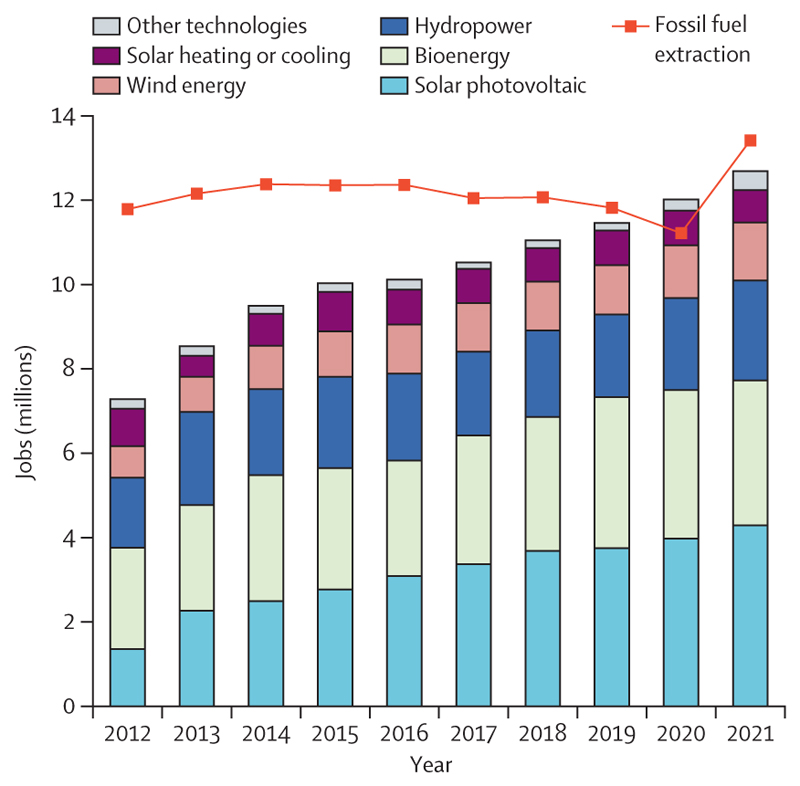
Some encouraging signs of progress offer a glimpse of the enormous human benefits that health-centred action could render. Deaths attributable to fossil-fuel-derived air pollution have decreased by 15·7% since 2005, with 80% of this reduction being the result of reduced coal-derived pollution. Meanwhile the renewable energy sector expanded to a historical high of 12·7 million employees in 2021 (indicator 4.2.2); and renewable energy accounted for 90% of the growth in electricity capacity in 2022 (indicator 3.1.1). Supporting this, global clean energy investment increased by 15% in 2022, to $1·6 trillion, exceeding fossil fuel investment by 61% (indicator 4.2.1); and lending to the green energy sector rose to $498 billion in 2021, approaching fossil fuel lending (indicator 4.2.7).
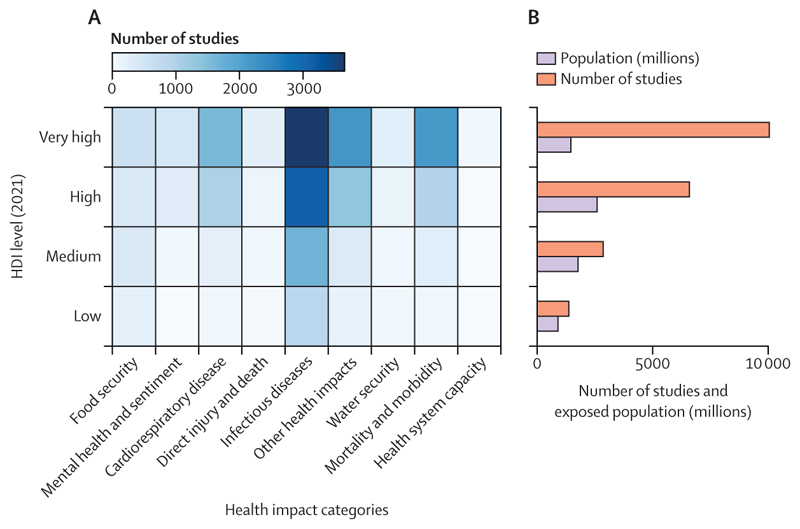
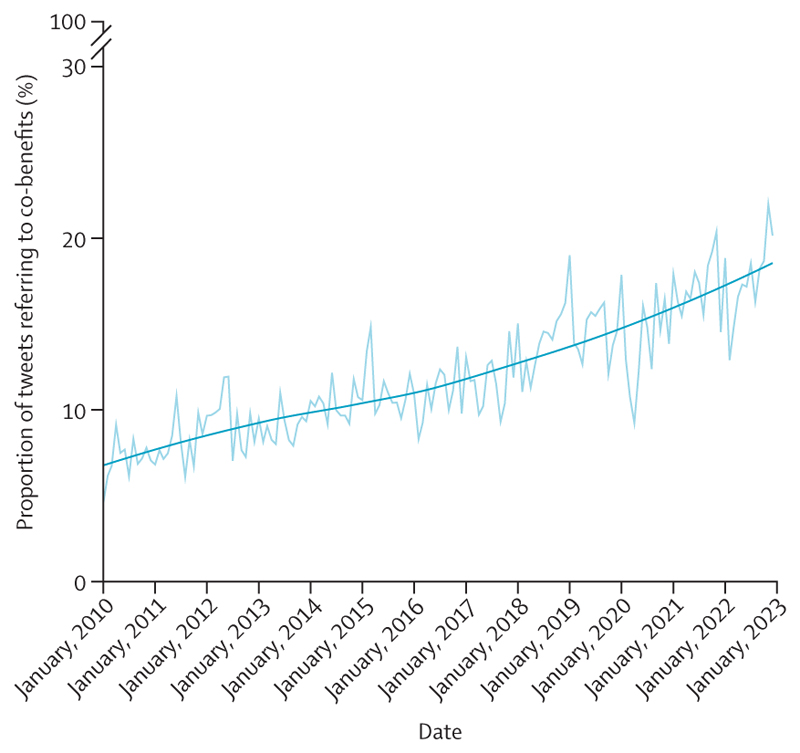
Scientific understanding of the links between health and climate change is rapidly growing, and although coverage lags in some of the most affected regions, over 3000 scientific articles covered this topic in 2022 (indicators 5.3.1 and 5.3.2). Meanwhile, the health dimensions of climate change are increasingly acknowledged in the public discourse, with 24% of all climate change newspaper articles in 2022 referring to health, just short of the 26% in 2020 (indicator 5.1). Importantly, international organisations are increasingly engaging with the health co-benefits of climate change mitigation (indicator 5.4.2), and governments increasingly acknowledge this link, with 95% of updated Nationally Determined Contributions (NDCs) under the Paris Agreement now referring to health—up from 73% in 2020 (indicator 5.4.1). These trends signal what could be the start of a life-saving transition.
A people-centred transformation: putting health at the heart of climate action: With the world currently heading towards 3°C of heating, any further delays in climate change action will increasingly threaten the health and survival of billions of people alive today. If meaningful, the prioritisation of health in upcoming international climate change negotiations could offer an unprecedented opportunity to deliver health-promoting climate action and pave the way to a thriving future. However, delivering such an ambition will require confronting the economic interests of the fossil fuel and other health-harming industries, and delivering science-grounded, steadfast, meaningful, and sustained progress to shift away from fossil fuels, accelerate mitigation, and deliver adaptation for health. Unless such progress materialises, the growing emphasis on health within climate change negotiations risks being mere healthwashing; increasing the acceptability of initiatives that minimally advance action, and which ultimately undermine—rather than protect—the future of people alive today and generations to come.
Safeguarding people’s health in climate policies will require the leadership, integrity, and commitment of the health community. With its science-driven approach, this community is uniquely positioned to ensure that decision makers are held accountable, and foster human-centred climate action that safeguards human health above all else. The ambitions of the Paris Agreement are still achievable, and a prosperous and healthy future still lies within reach. But the concerted efforts and commitments of health professionals, policy makers, corporations, and financial institutions will be needed to ensure the promise of health-centred climate action becomes a reality that delivers a thriving future for all.
Conflict of interest statement
Declaration of interests 14 of the authors (MRo, MWa, LJ, MBO'H, CO, HW, CdN, HK, PL, DS, CG, ZA, MY-G, and KRvD) were compensated for their time while drafting and developing the Lancet Countdown's report. OG was supported by the EU Horizon Grant: Climate Action To Advance Healthy Societies in Europe (Project 101057131–CATALYSE), for which there is overlap of data collection and preprocessing with the materials submitted in this report. MSp was supported by the Wellcome Trust Livestock, Environment and People (grant number 205212/Z/16/Z) and Wellcome Trust (grant number 225318/Z/22/Z). JT was supported by the Academy of Finland grants for the T-Winning (grant number 353327). CD was supported by the UK Natural Environment Research Council Independent Research Fellowship (grant number NE/N01524X/1), which ended in 2021, and by the European Research Council starting grant FLORA (grant number 101039402). OJ was supported by the NHMRC Investigator Grant entitled Heat and Health: Building resilience to extreme heat in a warming world (GNT20009507), the Wellcome Trust grant Heat stress in ready-made garment factories in Bangladesh (216059/Z/19/Z), and the Resilience New South Wales grant A new heat stress scale for general public (PJ-0000850). YL was supported by funding from the National Aeronautics and Space Administration (grant number: 80NSSC21K0507) for the wildfire population exposure and fire danger indicators. TO and IH were supported by the UK Research and Innovation Engineering and Physical Sciences Research Council Centre for Research in Energy Demand Solutions (grant number EP/R035288/1). MRo was supported by funding from IDAlert project (UK Research and Innovation project reference number 10056533). KB was supported by funding from the National Institute for Health and Care Research (NIHR) Centre on Non-communicable Diseases and Environmental Change (NIHR203247). All other authors declare no competing interests. The authors alone are responsible for the views expressed in this Commission, and they do not necessarily represent the views, decisions, or policies of the institutions with which they are affiliated.
Figures
Comment in
-
Climate change mitigation: tackling the commercial determinants of planetary health inequity.Lancet. 2023 Dec 16;402(10419):2269-2271. doi: 10.1016/S0140-6736(23)02512-6. Epub 2023 Nov 14. Lancet. 2023. PMID: 37977168 No abstract available.
-
„Nichtstun wird uns teuer zu stehen kommen!“.MMW Fortschr Med. 2023 Dec;165(21-22):28-29. doi: 10.1007/s15006-023-3193-4. MMW Fortschr Med. 2023. PMID: 38064067 German. No abstract available.
-
The Lancet Countdown on health and climate change: representation matters.Lancet. 2024 Sep 28;404(10459):1194. doi: 10.1016/S0140-6736(24)01489-2. Lancet. 2024. PMID: 39341637 No abstract available.
References
-
- World Meteorological Organization. Past eight years confirmed to be the eight warmest on record. World Meteorological Organization; 2023. Jan 12, [accessed May 9, 2023]. https://public.wmo.int/en/media/press-release/past-eight-years-confirmed... .
-
- Pörtner H-O, Roberts DC, Tignor M, et al., editors. Intergovernmental Panel on Climate Change. Climate change 2022: impacts, adaptation and vulnerability Contribution of Working Group II to the sixth assessment report of the Intergovernmental Panel on Climate Change. Cambridge University Press; Cambridge, UK, and New York, NY, USA: 2022.
-
- World Meteorological Organization. Eight warmest years on record witness upsurge in climate change impacts. World Meteorological Organization; 2022. Nov 6, [accessed April 30, 2023]. https://public.wmo.int/en/media/press-release/eight-warmest-years-record... .
-
- Yu V. China reports ‘most severe’ heatwave and third driest summer on record. The Guardian; 2022. Sept 7, [accessed April 7, 2023]. https://www.theguardian.com/world/2022/sep/07/china-reports-most-severe-... .
-
- World Meteorological Organization. WMO provisional state of the global climate 2022. 2022. [accessed April 5, 2023]. https://library.wmo.int/doc_num.php?explnum_id=11359 .
Publication types
MeSH terms
Grants and funding
LinkOut - more resources
Full Text Sources
Medical
Miscellaneous
