. 2024 Feb 15;83(3):324-334.
doi: 10.1136/ard-2023-224107.

CD_99 G1 neutrophils modulate osteogenic differentiation of mesenchymal stem cells in the pathological process of ankylosing spondylitis

Affiliations

CD_99 G1 neutrophils modulate osteogenic differentiation of mesenchymal stem cells in the pathological process of ankylosing spondylitis

Xinzhe Feng et al. Ann Rheum Dis. .

Abstract

Objectives: This study aimed to identify the types and heterogeneity of cells within the spinal enthesis and investigate the underlying mechanisms of osteogenesis.

Methods: Single-cell RNA sequencing was used to identify cell populations and their gene signatures in the spinal enthesis of five patients with ankylosing spondylitis (AS) and three healthy individuals. The transcriptomes of 40 065 single cells were profiled and divided into 7 clusters: neutrophils, monocytic cells, granulomonocytic progenitor_erythroblasts, T cells, B cells, plasma cells and stromal cells. Real-time quantitative PCR, immunofluorescence, flow cytometry, osteogenesis induction, alizarin red staining, immunohistochemistry, short hairpin RNA and H&E staining were applied to validate the bioinformatics analysis.

Results: Pseudo-time analysis showed two differentiation directions of stromal cells from the mesenchymal stem cell subpopulation MSC-C2 to two Cxcl12-abundant-reticular (CAR) cell subsets, Osteo-CAR and Adipo-CAR, within which three transcription factors, C-JUN, C-FOS and CAVIN1, were highly expressed in AS and regulated the osteogenesis of mesenchymal stem cells. A novel subcluster of early-stage neutrophils, CD99_G1, was elevated in AS. The proinflammatory characteristics of monocyte dendritic cell progenitor-recombinant adiponectin receptor 2 monocytic cells were explored. Interactions between Adipo-CAR cells, CD99_G1 neutrophils and other cell types were mapped by identifying ligand-receptor pairs, revealing the recruitment characteristics of CD99_G1 neutrophils by Adipo-CAR cells and the pathogenesis of osteogenesis induced in AS.

Conclusions: Our results revealed the dynamics of cell subpopulations, gene expression and intercellular interactions during AS pathogenesis. These findings provide new insights into the cellular and molecular mechanisms of osteogenesis and will benefit the development of novel therapeutic strategies.

Keywords: Ankylosing Spondylitis; Autoimmune Diseases; Inflammation.


Conflict of interest statement

Competing interests: None declared.

Figures
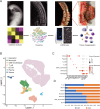
Figure 1
Figure 1
Overview of the single-cell landscape for the spinal ligament attachment site in ankylosing spondylitis (AS) and healthy control patients. (A) Processing pipeline of samples from patients with AS and healthy controls. The single-cell suspension was separated from spine entheseal tissues and subsequently loaded onto the BD scRNA-seq platform. (B) UMAP view of 40 065 single cells, colour-coded by assigned cell type. (C) Marker gene expression for each cell type, where dot size and colour represent the percentage of marker gene expression (pct. exp) and the averaged scaled expression (avg. exp. scale) value, respectively. (D) Composition and proportion of cells in AS and control groups. IL, interspinous ligament; LF, ligamentum flavum; SL, supraspinous ligament; SP, spinous process; UMAP, uniform manifold approximation and projection.
Figure 2
Figure 2
Distinct subclusters of the stroma. (A) UMAP of 368 stromal cells (as in figure 1B), annotated and coloured by their clustering. (B) Marker gene expression for each cell type, where dot size and colour represent the percentage of marker gene expression (pct. exp) and the averaged scaled expression (avg. exp. scale) value, respectively. (C) Proportion of each subcluster of stroma between patients with AS and healthy controls. (D) Upper panel: RNA velocity analysis of MSCs, Osteo-CAR cells and Adipo-CAR cells with the velocity field projected onto the UMAP plot of stroma subclusters from (A). Arrows show the local average velocity evaluated on a regular grid and indicate the extrapolated feature states of the cells. Bottom panel: monocle pseudotime analysis revealing the progression of MSCs, Osteo-CAR cells and Adipo-CAR cells. Trajectory reconstruction of all single cells revealing three branches: Pre-branch, Fate-1 and Fate-2. (E) Heatmap showing the scaled expression of differentially expressed transcription factors in three branches as in (D) catalogued into three major gene clusters (labels on left) that vary as a function of pseudo-time, highlighting specific representative transcription factors in each gene cluster along the right margin. From the centre to the left of the heatmap, the kinetic curve from the Pre-branch along the trajectory to the Fate-1 branch. From the centre to the right, the curve from Pre-branch to the Fate-2 branch. (F) GO analysis of differentially expressed genes associated with the three gene clusters in (E) identified unique response pathways for each branch. (G) The expression of c-JUN, c-FOS, CAVIN1, FOSB and EGR1 in AS and control MSC samples by RT-qPCR. (H) H&E staining and the expression of c-JUN (red), c-FOS (green), and CAVIN1 (yellow) in AS and control spinal enthesis samples by IF. Graph showed mean fluorescence intensity (right). The experiments were repeated in triplicate. The representative results are shown. Scale bar: 200 µm. (I) RNA expression of chemokines for each cell type, where dot size and colour represent the percentage of marker gene (pct. exp) and the averaged scaled expression (avg. exp. scale) value, respectively. *p<0.05; **p<0.01. AS, ankylosing spondylitis; CAR, cxcl12-abundant-reticular; EN, enthesis; GO, gene ontology; IF, immunofluorescence; IL, interspinous ligament; MSC, mesenchymal stem cells; RT-qPCR, real-time quantitative PCR; SP, spinous process; UMAP, uniform manifold approximation and projection.
Figure 3
Figure 3
Identification and characteristics of neutrophil subclusters. (A) UMAP of 21 420 neutrophils (as in figure 1B), annotated and coloured by their clustering. (B) Marker gene expression for each cell type, where dot size and colour represent the percentage of marker gene expression (pct. exp) and the averaged scaled expression (avg. exp. scale) value, respectively. (C) Proportion of each subcluster of neutrophils between patients with AS and healthy controls. (D) Application of CytoTRACE to predict the trajectory of the differentiation state of neutrophil subclusters. The predicted differentiation state was visualised in UMAP plots based on the differentiation scores. (E) The differential gene expression in CD99_G1 and G1 subclusters. Purple dots: p<0.05, grey dots: p≧0.05. (F) Violin plots showing the distinct expression patterns of the secretory protein genes in each subcluster. (G) PPI networks of hub transcript factors and target genes in CD99_G1 subclusters. (H) GO and KEGG pathway analyses of significant differential genes of CD99_G1 subclusters between AS and control groups. (I) Dot plots of flow cytometry showing percentage of CD99_G1 neutrophils in the AS and control groups. The experiments were repeated in triplicate. The representative results are shown. (J) Statistic results of flow cytometry experiments. (K) Alizarin red staining reflecting MSCs mineralisation under osteogenic induction conditions with different concentrations of IGFBP2/7 intervention. The experiments were repeated in triplicate. The representative results are shown. *p<0.05; **p<0.01. AS, ankylosing spondylitis; Con, control; GO, gene otology; KEGG, kyoto encyclopaedia of genes and genomes; OS, osteogenesis; PPI, protein–protein interaction; UMAP, uniform manifold approximation and projection.
Figure 4
Figure 4
The heterogeneity of monocytic cells and the proinflammatory phenotype of monocyte dendritic cell progenitor-recombinant adiponectin receptor 2 (MDP-ADIPOR2) subsets. (A) Uniform manifold approximation and projection (UMAP) of monocytic cells (as in figure 1B), annotated and coloured by the clustering. (B) Heatmap of marker gene expression for each cell type. (C) The differential gene expression of MDP-ADIPOR2 cells between the AS and control groups. Purple dots: p<0.05, grey dots: p≧0.05. KEGG pathway (D) and GO (E) analysis of significant differential genes of MDP-ADIPOR2 subclusters between the AS and control groups. (F) ClueGO results of gene enrichment in both the GO and KEGG pathway analyses. AS, ankylosing spondylitis; GO, gene ontology; KEGG, kyoto encyclopaedia of genes and genomes.
Figure 5
Figure 5
Cell–cell communication among specific cell types in the spinal ligament attachment site microenvironment. (A) Circos plot showing the potential cell interactions between Adipo-CAR cells (left panel), CD99_G1 neutrophils (right panel), and the other cell types in the spinal ligament attachment site predicted by CellPhoneDB. The node size represents the number of interactions. The width of the edge represents the number of significant ligand–receptor pairs between the two cell types. (B) The dot plot generated by CellPhoneDB showing potential ligand–receptor pairs between CD99_G1 neutrophils (as a receptor in the upper panel and as a ligand in the bottom panel) and all detected cellular types. The dots are coloured according to the mean expression of the ligand–receptor pairs between two clusters, and dot sizes are proportional to the value of −log10 (p value). (C) Predicted regulatory network centred on the microenvironment of the spinal ligament attachment site. CAR, cxcl12-abundant reticular. MSC, mesenchymal stem cell.

References

    1. Braun J, Sieper J. Ankylosing spondylitis. Lancet 2007;369:1379–90. 10.1016/S0140-6736(07)60635-7 - DOI - PubMed
    1. Sherlock JP, Joyce-Shaikh B, Turner SP, et al. . IL-23 induces spondyloarthropathy by acting on ROR-gammat+ CD3+CD4-CD8- entheseal resident T cells. Nat Med 2012;18:1069–76. 10.1038/nm.2817 - DOI - PubMed
    1. Lee W, Reveille JD, Weisman MH. Women with ankylosing spondylitis: a review. Arthritis Rheum 2008;59:449–54. 10.1002/art.23321 - DOI - PubMed
    1. Navarro-Compán V, Sepriano A, El-Zorkany B, et al. . Axial spondyloarthritis. Ann Rheum Dis 2021;80:1511–21. 10.1136/annrheumdis-2021-221035 - DOI - PubMed
    1. Liu D, Liu B, Lin C, et al. . Imbalance of peripheral lymphocyte Subsets in patients with ankylosing spondylitis: a meta-analysis. Front Immunol 2021;12:696973. 10.3389/fimmu.2021.696973 - DOI - PMC - PubMed

Substances