. 2023 Dec 6;10(12):ENEURO.0161-23.2023.
doi: 10.1523/ENEURO.0161-23.2023. Print 2023 Dec.

Functional Dissection of Ipsilateral and Contralateral Neural Activity Propagation Using Voltage-Sensitive Dye Imaging in Mouse Prefrontal Cortex

Affiliations

Functional Dissection of Ipsilateral and Contralateral Neural Activity Propagation Using Voltage-Sensitive Dye Imaging in Mouse Prefrontal Cortex

Pooja Gusain et al. eNeuro. .

Abstract

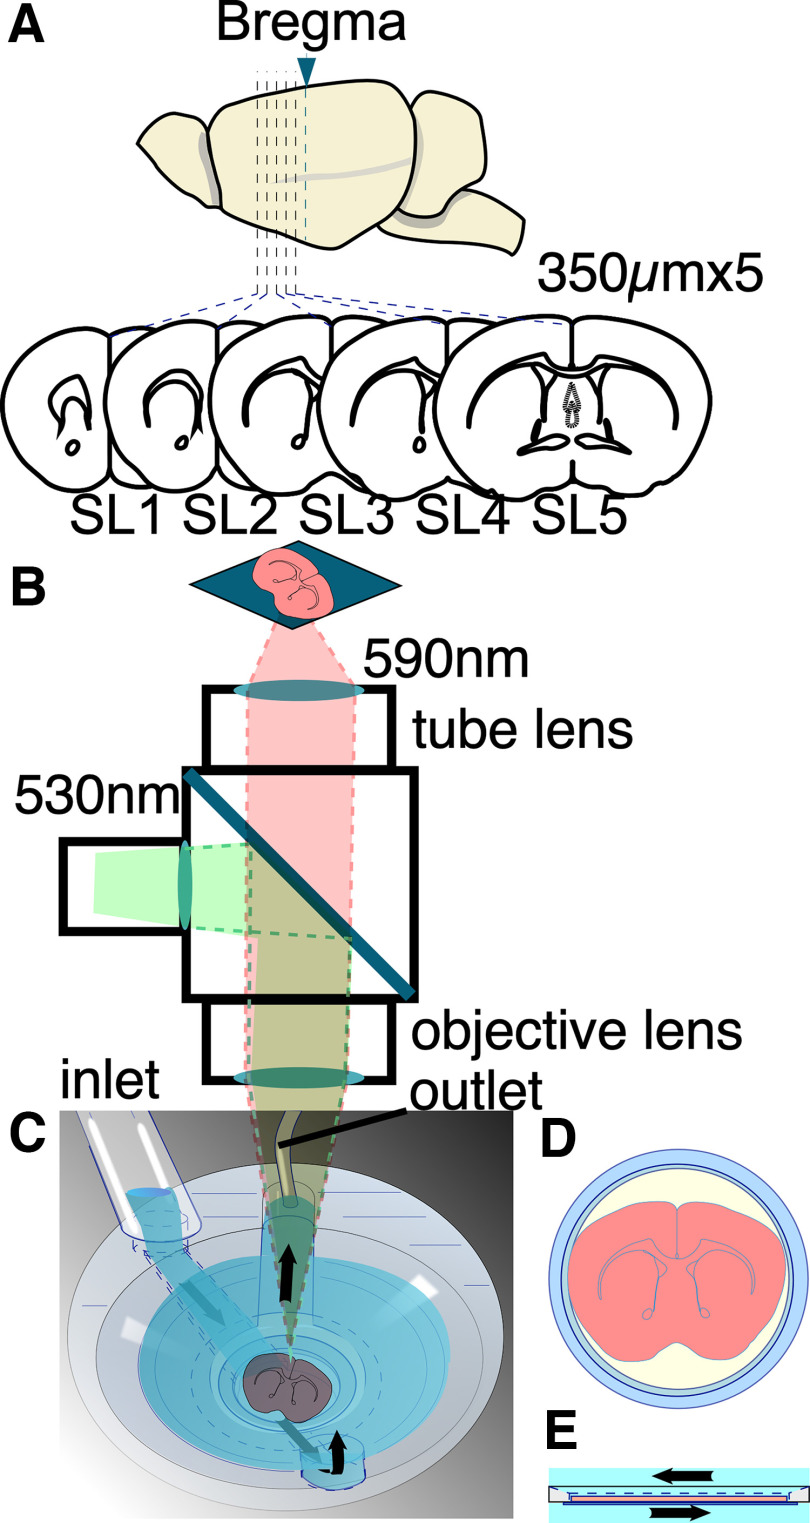
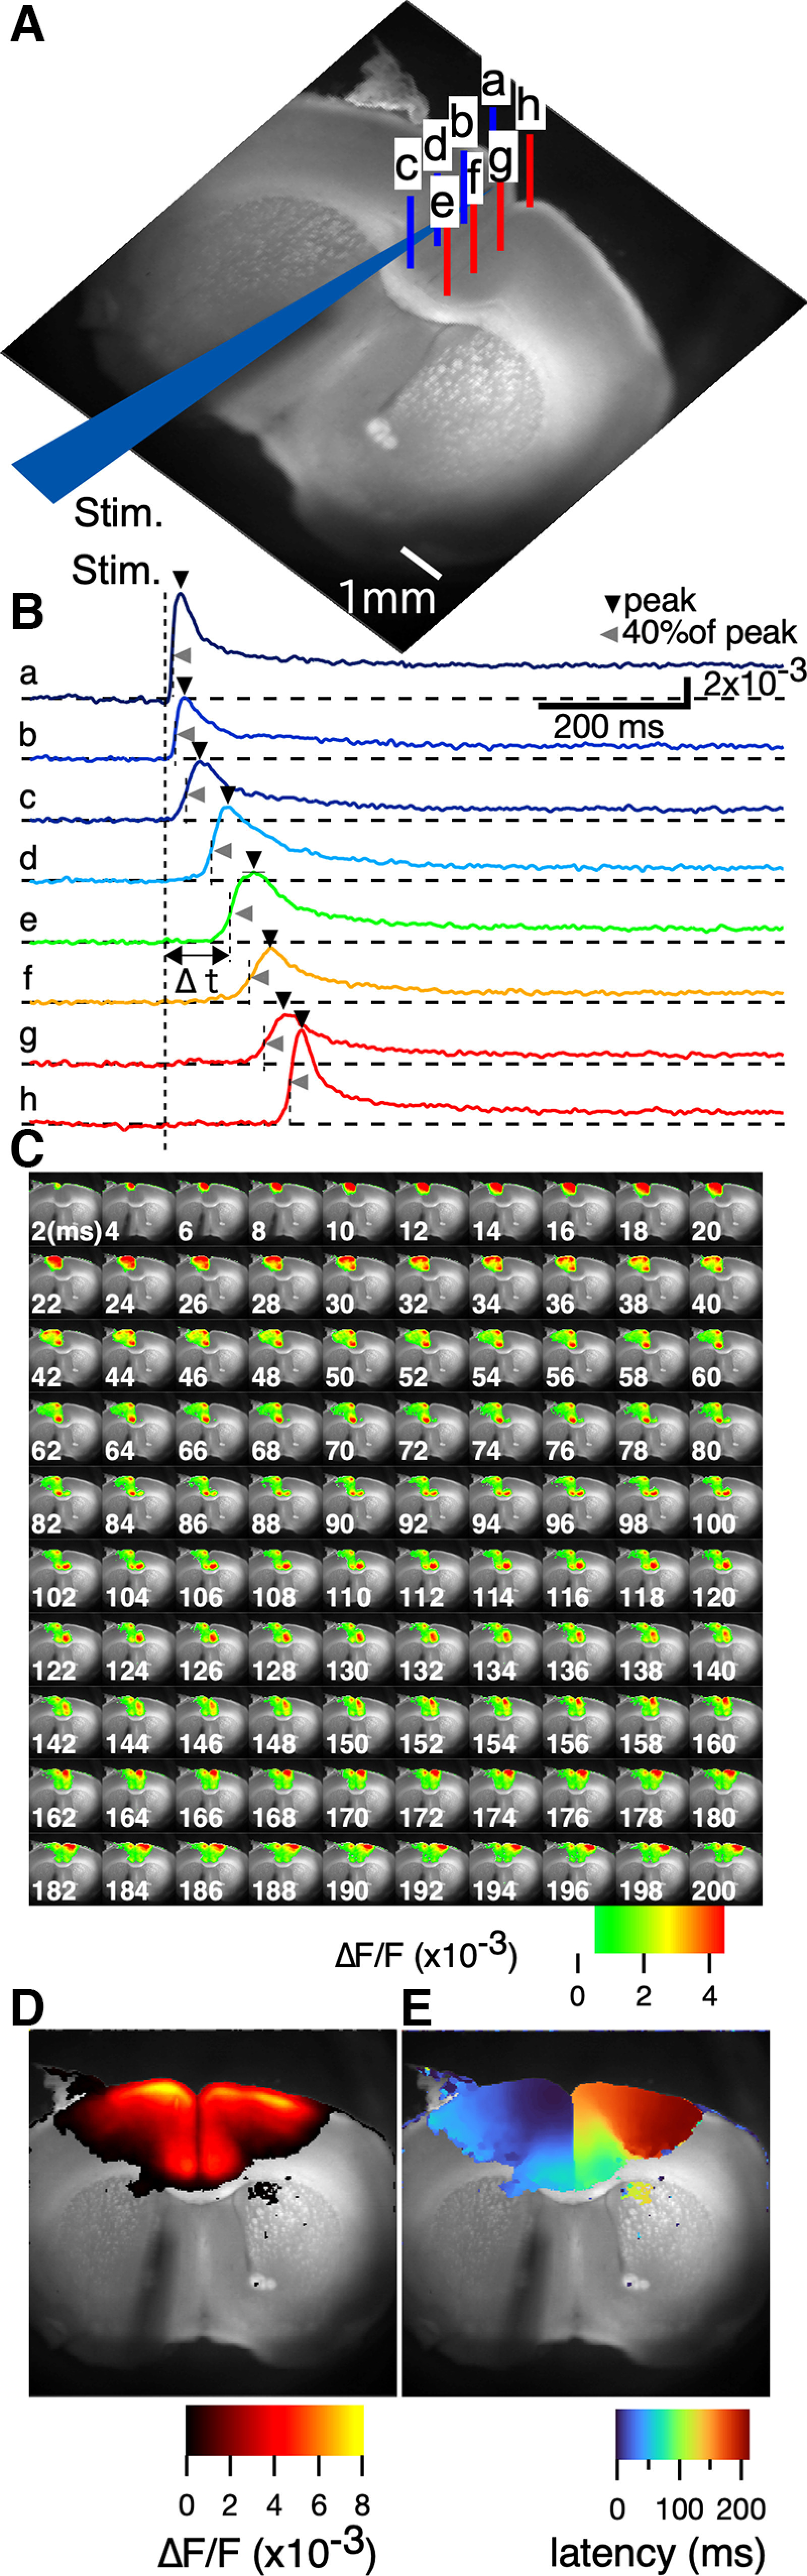
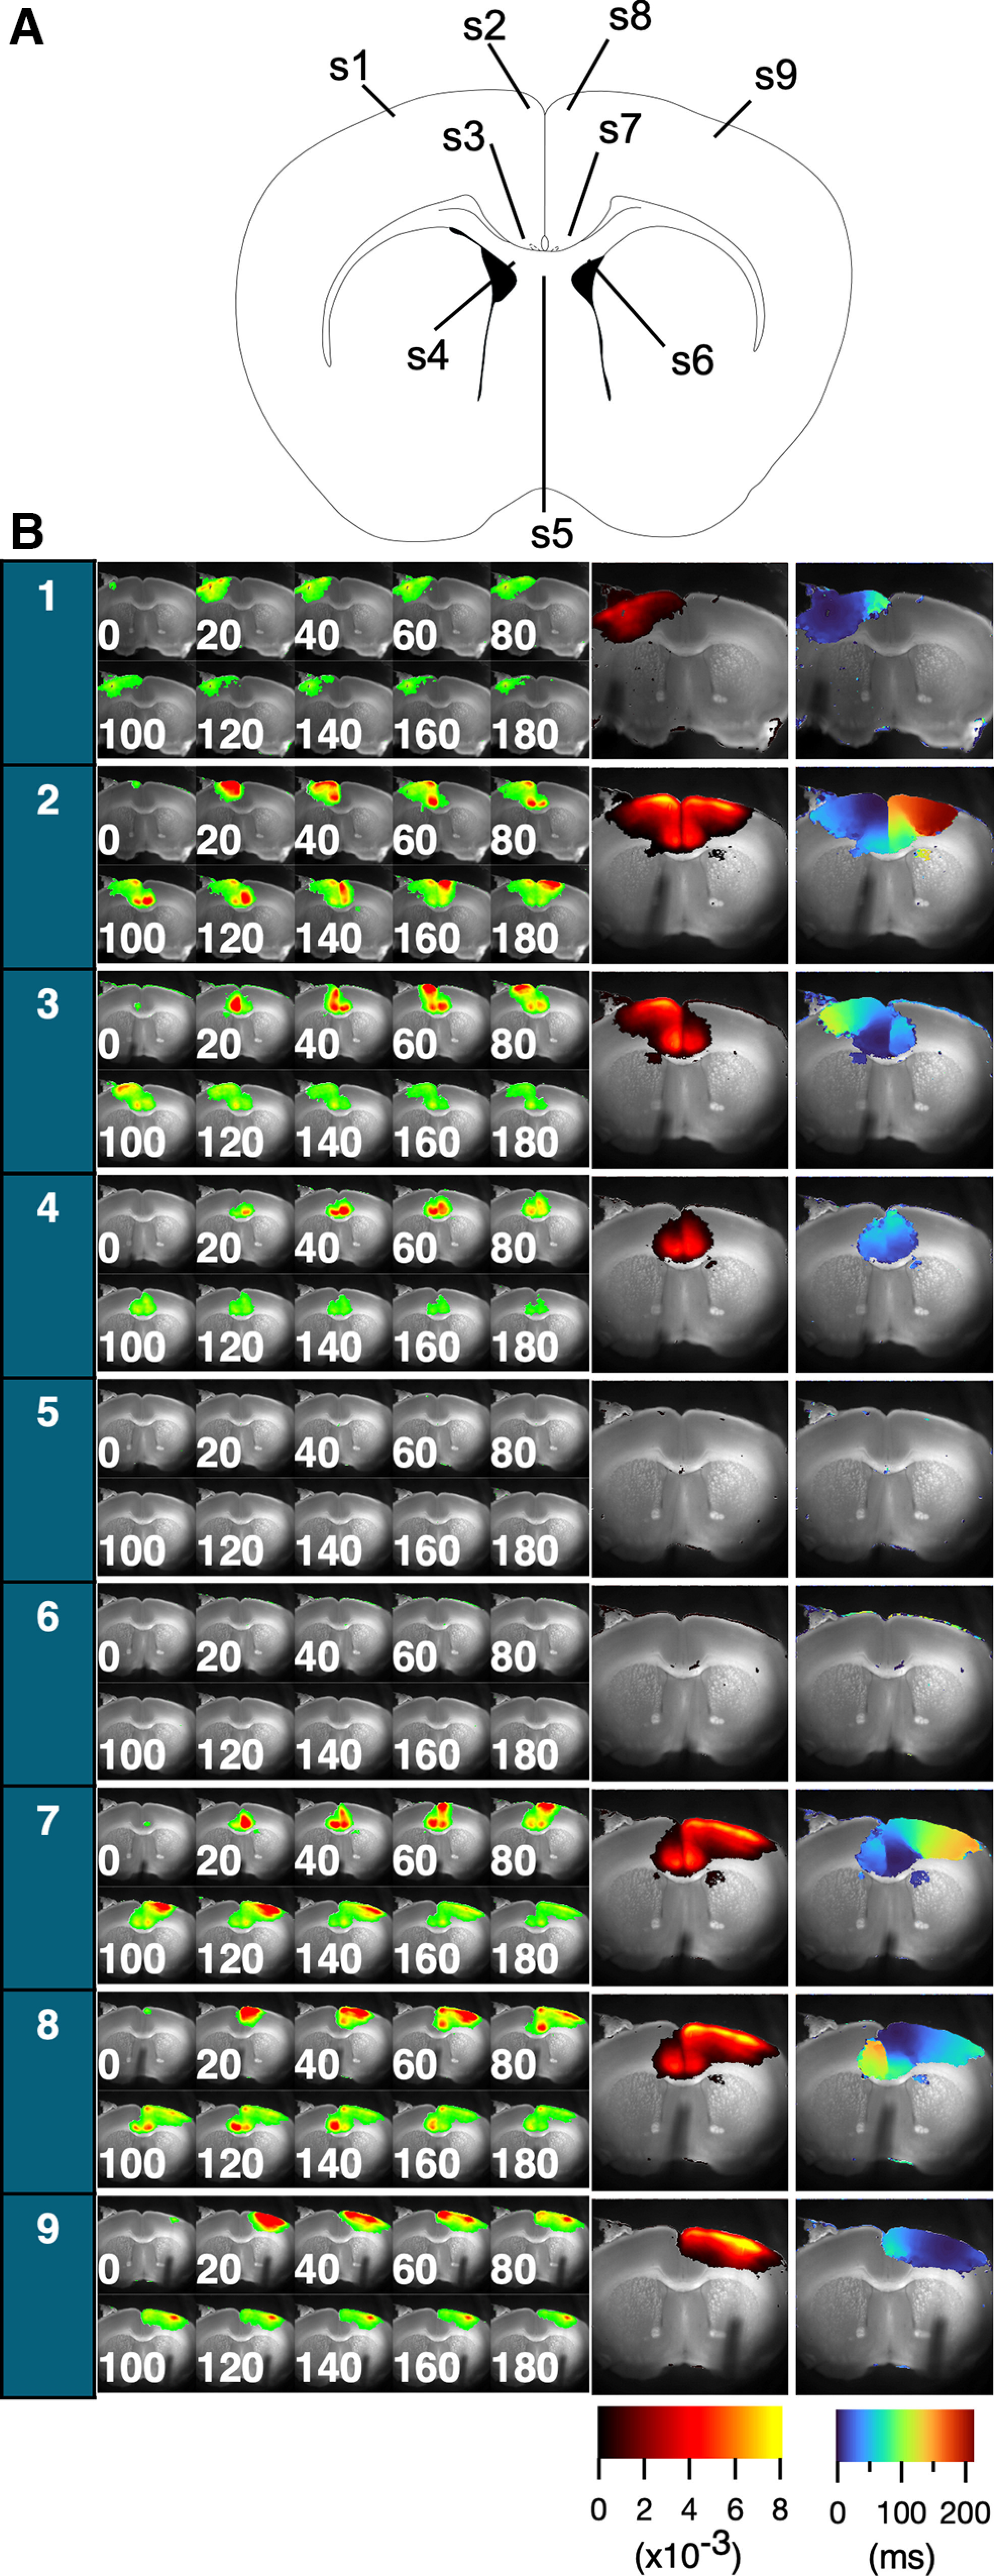
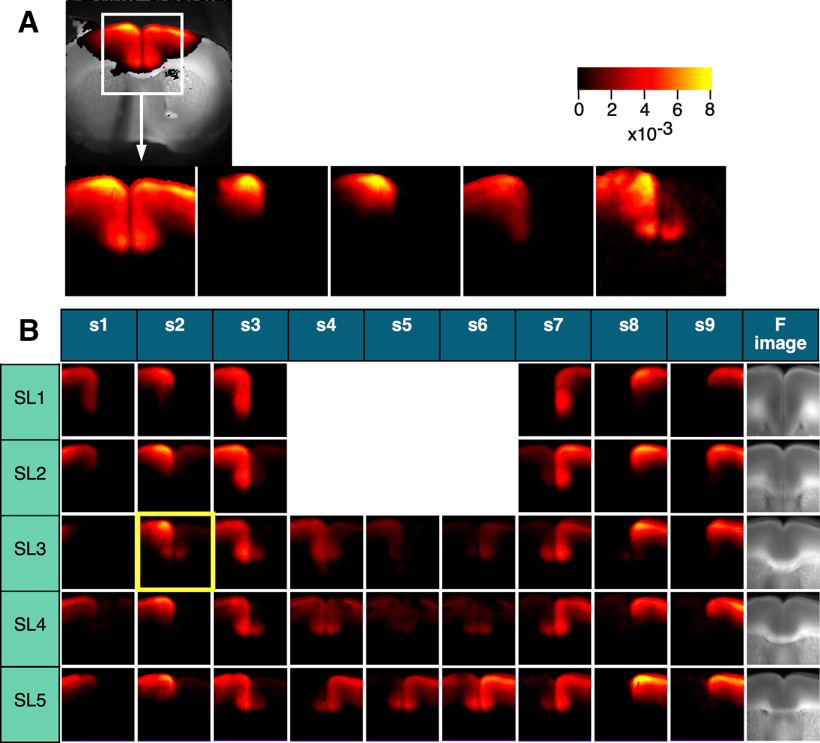
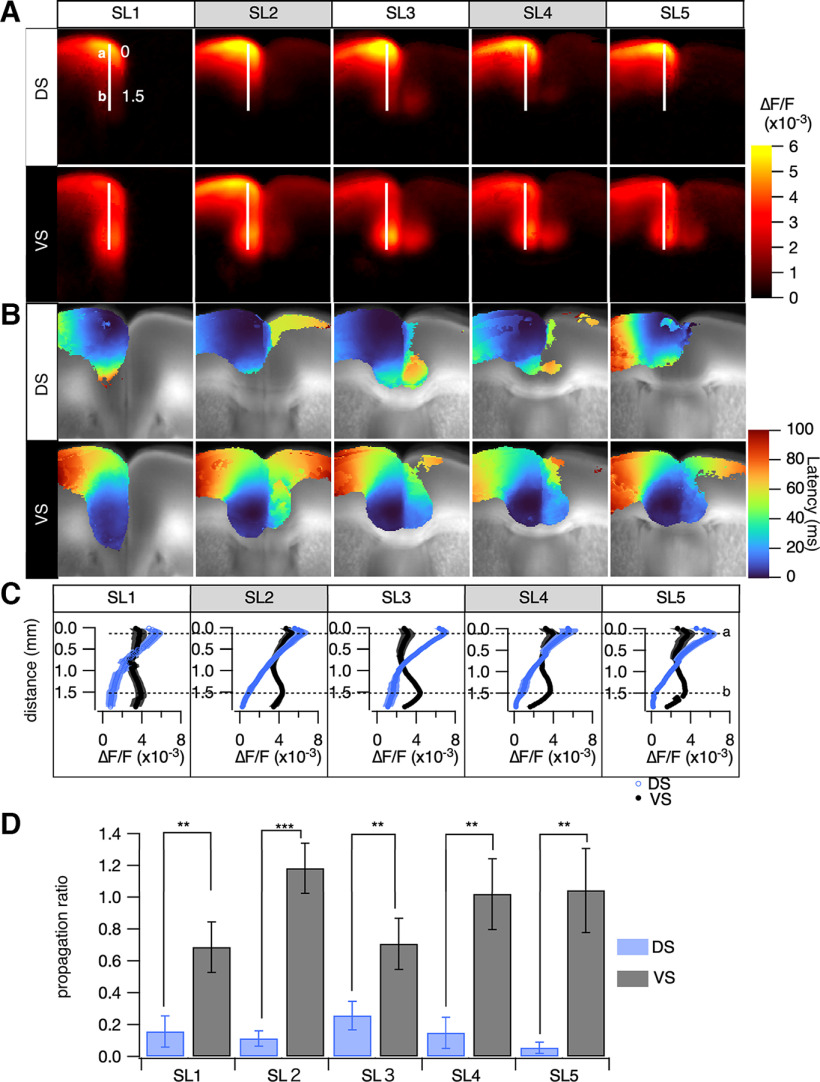
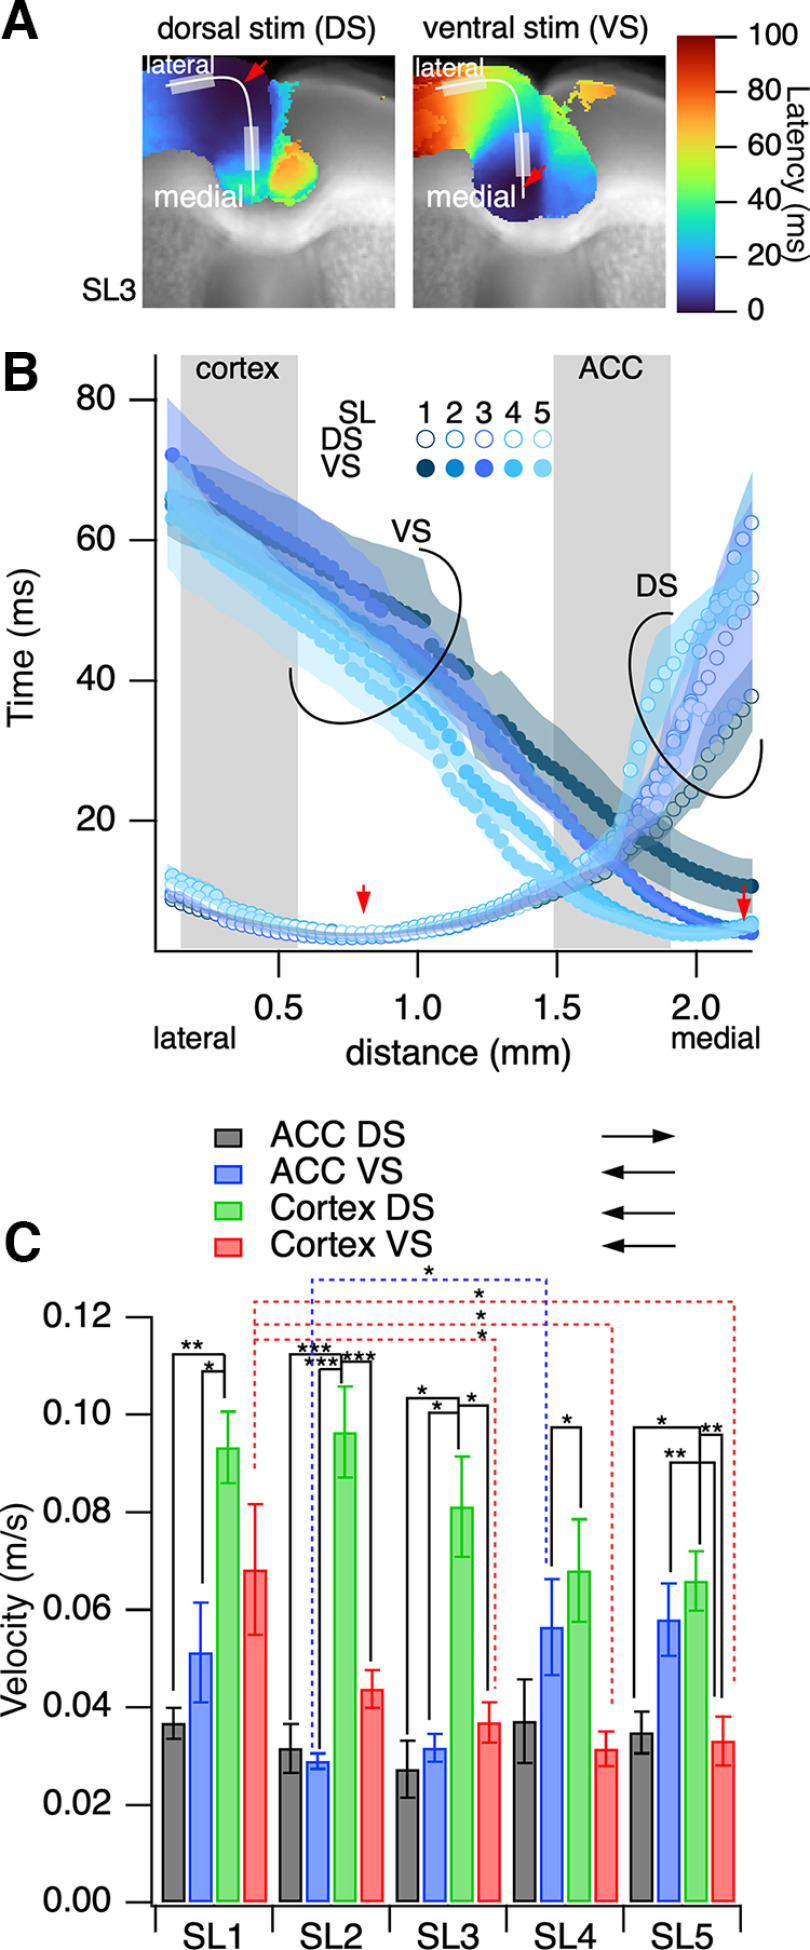
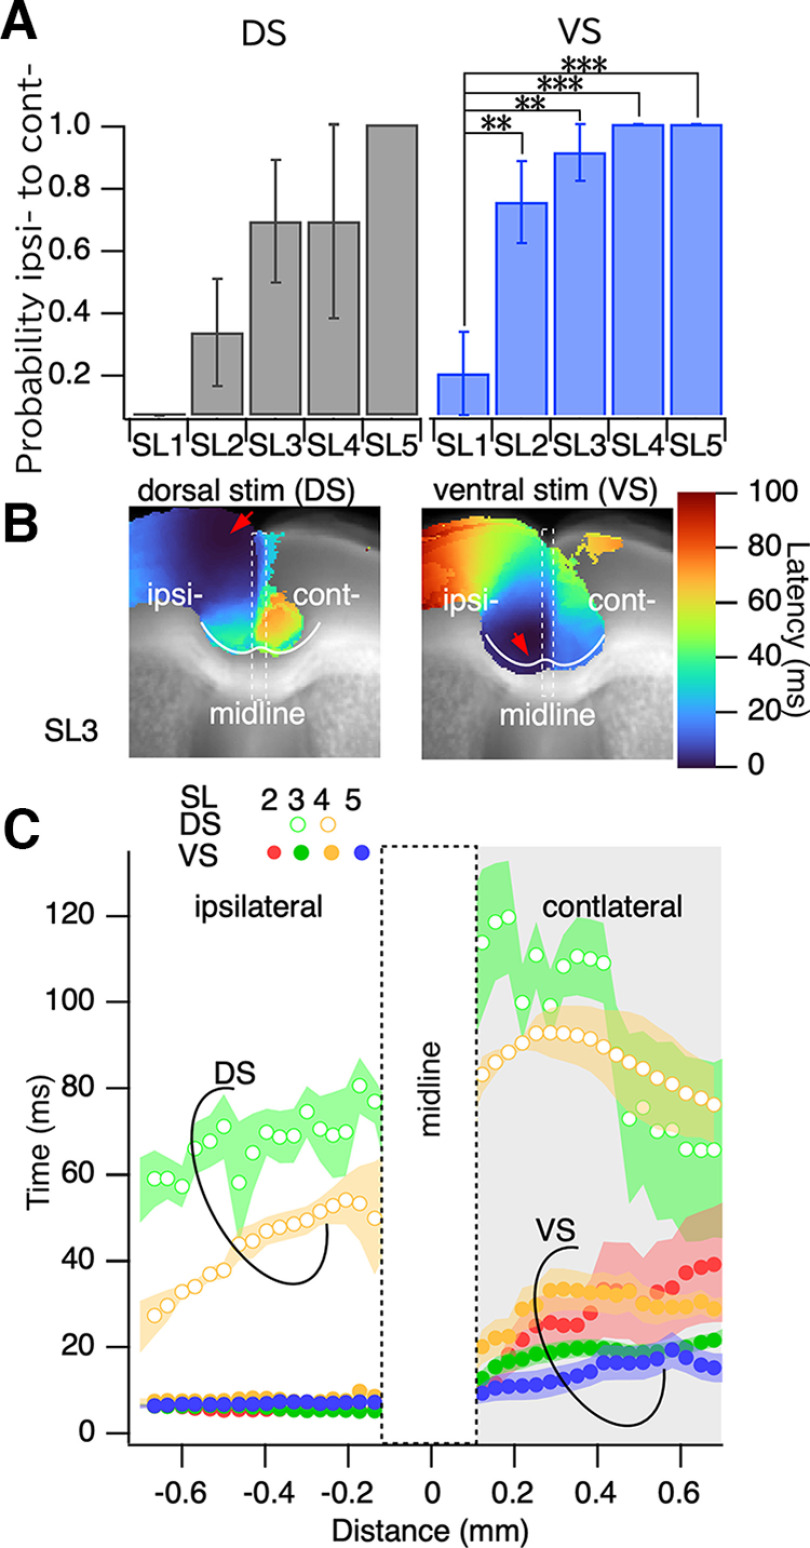
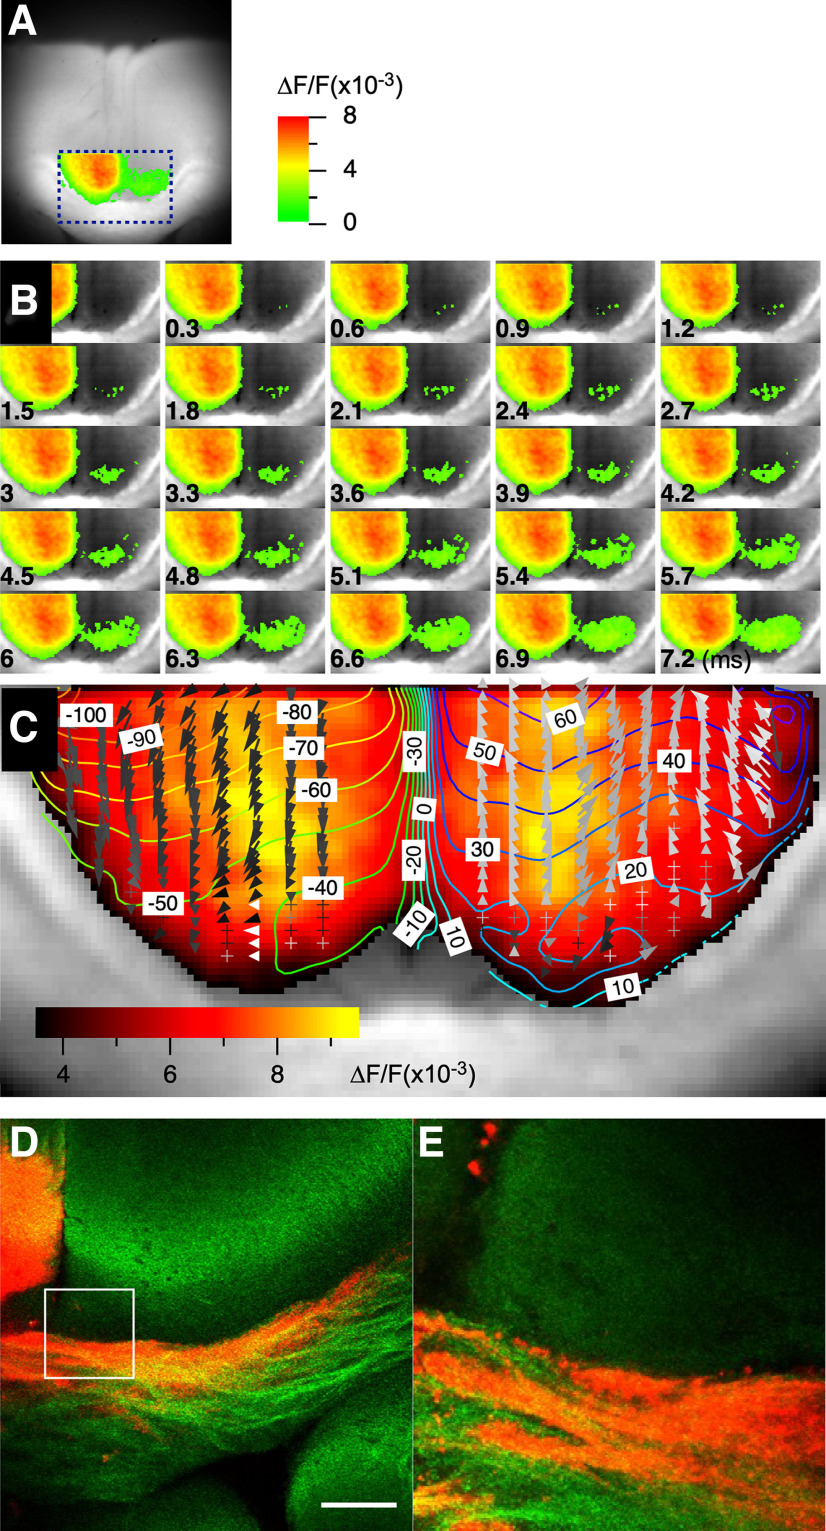
Prefrontal cortex (PFC) intrahemispheric activity and the interhemispheric connection have a significant impact on neuropsychiatric disorder pathology. This study aimed to generate a functional map of FC intrahemispheric and interhemispheric connections. Functional dissection of mouse PFCs was performed using the voltage-sensitive dye (VSD) imaging method with high speed (1 ms/frame), high resolution (256 × 256 pixels), and a large field of view (∼10 mm). Acute serial 350 μm slices were prepared from the bregma covering the PFC and numbered 1-5 based on their distance from the bregma (i.e., 1.70, 1.34, 0.98, 0.62, and 0.26 mm) with reference to the Mouse Brain Atlas (Paxinos and Franklin, 2008). The neural response to electrical stimulation was measured at nine sites and then averaged, and a functional map of the propagation patterns was created. Intracortical propagation was observed in slices 3-5, encompassing the anterior cingulate cortex (ACC) and corpus callosum (CC). The activity reached area 33 of the ACC. Direct white matter stimulation activated area 33 in both hemispheres. Similar findings were obtained via DiI staining of the CC. Imaging analysis revealed directional biases in neural signals traveling within the ACC, whereby the signal transmission speed and probability varied based on the signal direction. Specifically, the spread of neural signals from cg2 to cg1 was stronger than that from cingulate cortex area 1(cg1) to cingulate cortex area 2(cg2), which has implications for interhemispheric functional connections. These findings highlight the importance of understanding the PFC functional anatomy in evaluating neuromodulators like serotonin and dopamine, as well as other factors related to neuropsychiatric diseases.

Keywords: anterior cingulate cortex; corpus callosum; medial prefrontal cortex; voltage-sensitive dye.


Conflict of interest statement

The authors declare no competing financial interests.

Figures

Figure 1.
Figure 1.
Schematics of slice preparation and experimental apparatus. A, Schematic illustration of mouse brain slices. The slices (350 μm thickness) are continuously made from mouse brain. Each slice (5 slices per animal) is classified into SL1–SL5 depending on its morphology with reference to the brain atlas. SL1 refers to the slice collected 17.0 mm away from the bregma; SL2, 1.34 mm; SL3, 0.98 mm; SL4, 0.62 mm; and SL5, 0.26 mm. B, Schematic illustration of the optical recording system. To briefly summarize the experimental setup, the excitation light first passed through a bandpass filter (530 ± 30 nm) and was then reflected by a dichroic mirror and directed toward the specimen. The resulting fluorescence was captured using a long-pass filter (>590 nm) and projected onto an imager. The optical system consisted of an objective lens and a tube lens with the same F value, resulting in a total magnification of one. C–E, Recording chamber used for stabilizing the slice on a membrane filter (D) and for passing gas and fluid beneath the filter (E). The ACSF was delivered through the inlet and perfused from the bottom of the slice before being removed via the outlet.
Figure 2.
Figure 2.
Contralateral spread of activity after electrical stimulation to the ACC. Aa–h, Configuration of SL 3 (obtained 0.98 mm from the bregma) and the stimulation electrode. Ba–h, Traces showing the optical signals at each pixel shown in Aa–h. The vertical dotted line shows the timing of the stimulation (Stim.; 40 V, 300 μs bipolar). C, Pseudocolored consecutive images of the optical signal at each time section (frame rate, 1 ms/frame). The numbers in the images indicate the time (ms) after the stimulation. D, Color-coded projection of the peak values of each optical signal at each pixel in the field of view. E, Color-coded projection map of the latency (Δt in B; time to 40% of peak) to the initial response from stimulation time at each pixel in the field of view.
Figure 3.
Figure 3.
The figure displays consecutive images of the optical response (A), as well as projections of peak values and latencies for each stimulation site (B). Far left, Column corresponding to the site numbers (see above, Materials and Methods). The optical signal following stimulation is represented by 10 consecutive images, with each image numbered with a time point separated by 20 ms intervals and presented as a pseudocolor. Right, The two images show the projection of the peak values and latencies from the time of stimulation, presented in pseudocolor code as amplitude and latency maps, respectively. The amplitude maps show the amount of ΔF/F (×10−3), whereas the latency maps show the latency time in milliseconds, as indicated by the color bars (bottom right).
Figure 4.
Figure 4.
Map of the average peak-value projection across different slices. A, The variation of the same response to S2 in five different SL3 slices (0.98 mm from the bregma). B, Table of average peak-value projections in nine different stimuli (S1–S9) for five different slices (SL1–SL5). The averaged image highlighted in yellow (SL3/S2) is the average of five different responses shown in A. The averaged images are generated after affine conversion and trimming to best fit the shape of the slice; n = 6–8 per image.
Figure 5.
Figure 5.
Analysis of uneven intrahemispheric neuronal propagation in the mPFC, comparing dorsal stimulation (DS) and ventral stimulation (VS) in layer II/III. A, The averaged peak projection image, arranged to position the stimulation site (ipsilateral hemisphere) on the left and the contralateral hemisphere on the right. B, The averaged latency projection, corresponding to A, with latency defined as the time to reach 40% of peak amplitude from stimulation onset at each pixel. C, Line profiles of peak projections (mean ± SEM; n = 6–8), depicting responses to DS (blue) and VS (black) along a specific line in A, ranging from SL1 to SL5. Right, Dashed lines (a, b) indicate locations nearest to the stimulation sites for DS and VS, respectively. D, The propagation ratio, derived from the intensity of the optical signals (ΔF/F) at the dashed lines in C. For DS, the ratio is ascertained by comparing the signal intensities at positions a, b (dorsal to ventral), whereas for VS, the calculation is inverted from b to a (ventral to dorsal). The bar graph elucidates these ratios (mean ± SEM; n = 6-8), facilitating a comparative evaluation of neuronal propagation variability between different stimulation sites; **p < 0.03, ***p < 0.01.
Figure 6.
Figure 6.
Analysis of intrahemispheric neuronal propagation in the mPFC on dorsal stimulation (DS) and ventral stimulation (VS) in layer II/III, to evaluate response latency. A, The averaged latency projection image is summarized as having the stimulation site (ipsilateral hemisphere) on the left-hand side and the other (contralateral hemisphere) on the right. B, The line profile of the latency along a line drawn on A (SL3) along layer II/III of the cortex on DS (open circle) and VS (solid circle). C, The propagation velocity is calculated as the inverse of the slope of the profile at the lateral cortex (LC) and the ACC on DS and VS. The plots show the mean ± SEM, n = 8–12; *p < 0.05, **p < 0.03, ***p < 0.01.
Figure 7.
Figure 7.
Interhemispheric connection. A, Probability of the occurrence of interhemispheric connection from the ipsilateral cortex to the contralateral cortex. B, Latency profile along the most ventral side of the medial prefrontal cortex drawn from the lateral end of the ipsilateral cortex to the contralateral cortex. C, Profile of the latency plot along the line for dorsal stimulation (DS; open circles) and ventral stimulation (VS; solid circles); n = 8–12; **p < 0.03, ***p < 0.01.
Figure 8.
Figure 8.
Site of interhemispheric propagation. A, Location of the focal high-speed imaging (300 μs/frame) used to study interhemispheric propagation in the ACC. B, Consecutive images taken at 300 μs intervals during interhemispheric propagation of neuronal activity in the ACC. C, Amplitude map of the recorded activity superimposed with a contour plot and vector field representation of latency map, illustrating the direction and speed of the interhemispheric propagation. D, E, Representative images of DiI microdot staining in the ACC when the microdot was placed on the left side of the slice, showing the ipsilateral projection from the cingulate cortex and the corresponding interhemispheric callosal fiber projection to the contralateral side. Scale bar, 30 μm.

Similar articles

Cited by

References

    1. Aboitiz F, Montiel J (2003) One hundred million years of interhemispheric communication: the history of the corpus callosum. Braz J Med Biol Res 36:409–420. 10.1590/s0100-879x2003000400002 - DOI - PubMed
    1. Apps MAJ, Rushworth MFS, Chang SWC (2016) The anterior cingulate gyrus and social cognition: Tracking the motivation of others. Neuron 90:692–707. - PMC - PubMed
    1. Asadi-Pooya AA, Sharan A, Nei M, Sperling MR (2008) Corpus callosotomy. Epilepsy Behav 13:271–278. 10.1016/j.yebeh.2008.04.020 - DOI - PubMed
    1. Barthas F, Sellmeijer J, Hugel S, Waltisperger E, Barrot M, Yalcin I (2015) The anterior cingulate cortex is a critical hub for pain-induced depression. Biol Psychiatry 77:236–245. 10.1016/j.biopsych.2014.08.004 - DOI - PubMed
    1. Brodovskaya A, Batabyal T, Shiono S, Sun H, Kapur J (2022) Distinct roles of rodent thalamus and corpus callosum in seizure generalization. Ann Neurol 91:682–696. 10.1002/ana.26338 - DOI - PMC - PubMed

LinkOut - more resources