. 2023 Nov 17;14(1):7454.
doi: 10.1038/s41467-023-43241-y.

Synthetic genetic oscillators demonstrate the functional importance of phenotypic variation in pneumococcal-host interactions

Affiliations

Synthetic genetic oscillators demonstrate the functional importance of phenotypic variation in pneumococcal-host interactions

Anne-Stéphanie Rueff et al. Nat Commun. .

Abstract

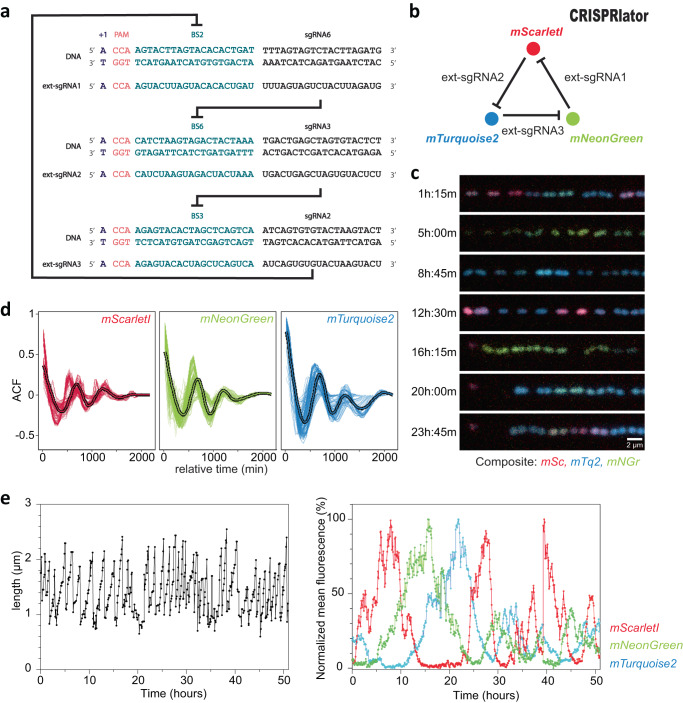
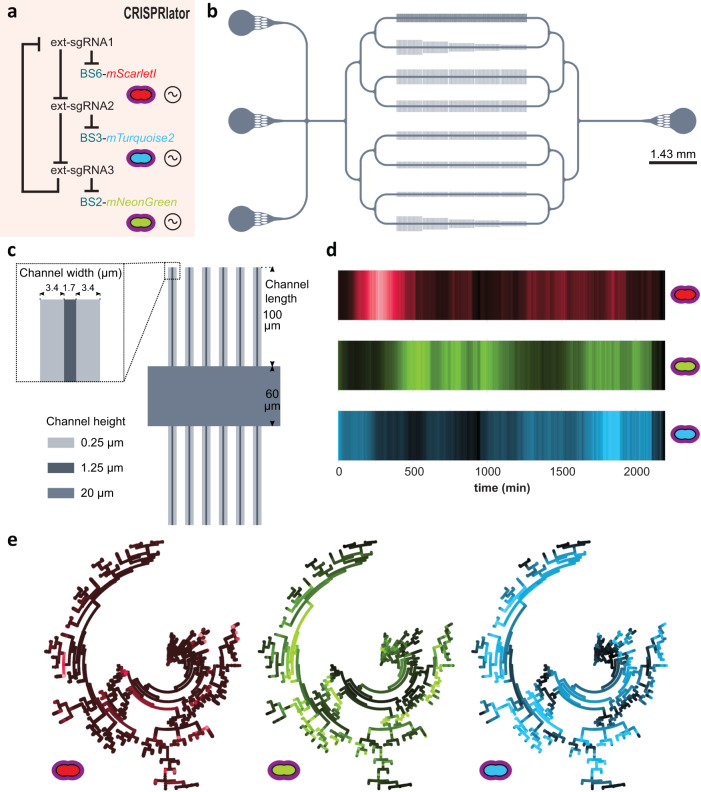
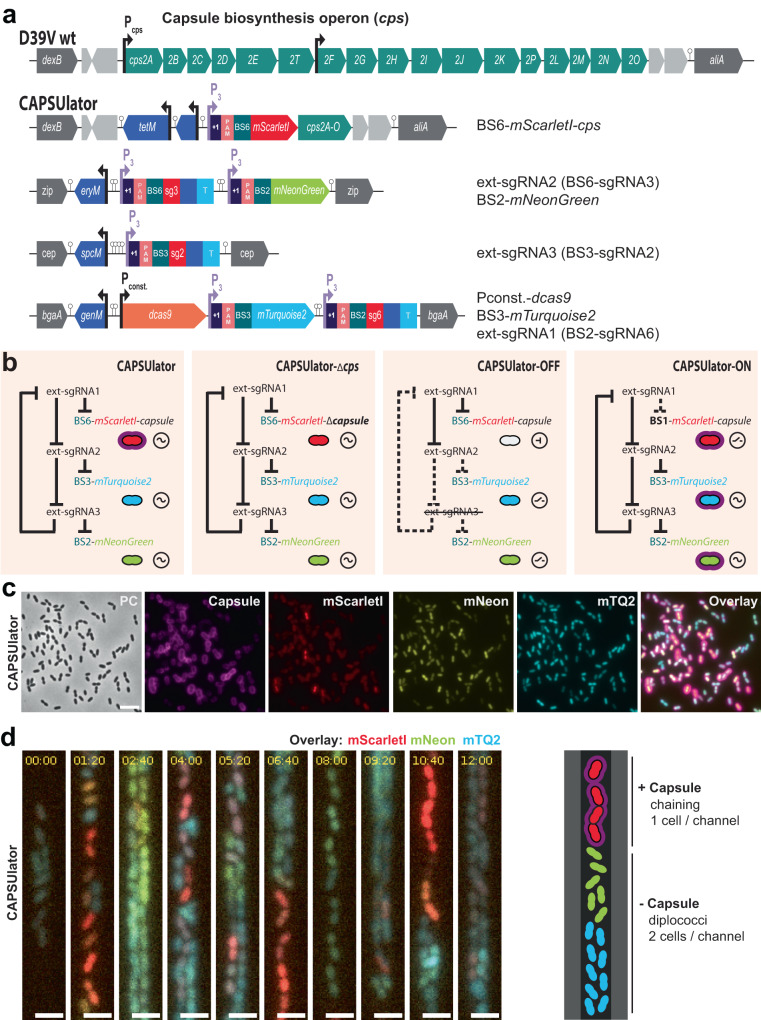
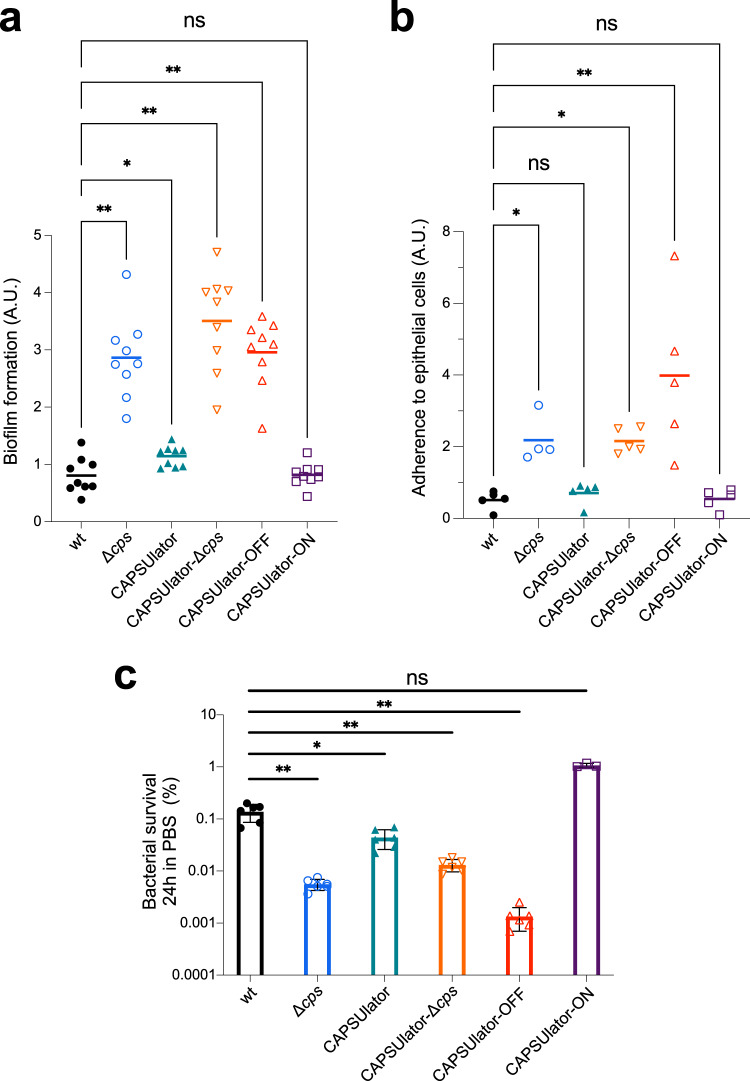
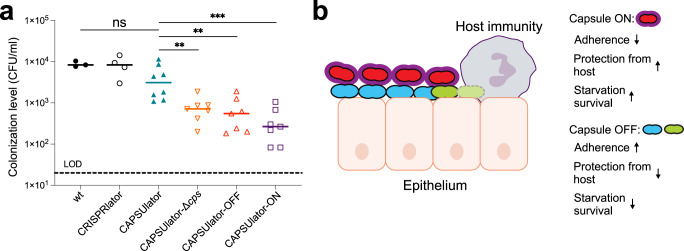
Phenotypic variation is the phenomenon in which clonal cells display different traits even under identical environmental conditions. This plasticity is thought to be important for processes including bacterial virulence, but direct evidence for its relevance is often lacking. For instance, variation in capsule production in the human pathogen Streptococcus pneumoniae has been linked to different clinical outcomes, but the exact relationship between variation and pathogenesis is not well understood due to complex natural regulation. In this study, we use synthetic oscillatory gene regulatory networks (GRNs) based on CRISPR interference (CRISPRi) together with live cell imaging and cell tracking within microfluidics devices to mimic and test the biological function of bacterial phenotypic variation. We provide a universally applicable approach for engineering intricate GRNs using only two components: dCas9 and extended sgRNAs (ext-sgRNAs). Our findings demonstrate that variation in capsule production is beneficial for pneumococcal fitness in traits associated with pathogenesis providing conclusive evidence for this longstanding question.


Conflict of interest statement

The authors declare no competing interests.

Figures

Fig. 1
Fig. 1. Design and characterization of a three-node ring oscillator ‘CRISPRlator’ using extended sgRNAs.
a Schematic overview of the use of ext-sgRNAs to construct a three-node ring oscillator. Ext-sgRNA1 has a spacer sequence (sgRNA6) that is complementary to binding site 6 (BS6) of the non-template strand of the DNA sequence encoding ext-sgRNA2. Ext-sgRNA2 has a spacer (sgRNA3) targeting BS3 present on the DNA sequence of ext-sgRNA3. Ext-sgRNA3 has a spacer (sgRNA2) targeting BS2 present on the DNA sequence of ext-sgRNA1. For clarity, only the variable 5’ region of ext-sgRNAs sequences is shown (the dCas9-binding handle and transcription terminator are not shown). b Graphical representation of the three-node ring oscillator called CRISPRlator. Expression of ext-sgRNA1 represses transcription of the mScarlet-I reporter (red); ext-sgRNA2 represses mTurquoise2 (blue) and ext-sgRNA3 represses mNeonGreen (green). As the ext-sgRNAs also repress each other’s transcription (a), this GRN is expected to periodically express the three reporters in the order red->green->blue. c Snapshots with 3h45min intervals of a typical microfluidics experiment of the CRISPRlator strain are shown. Scale bar 2 µm. Time in hours and minutes. d Autocorrelation function (ACF) of the CRISRlator cells grown in mother machine channels. ACF calculated in one mother machine lane for individual cells (thin lines) and averaged (fat line with black outlines) shows oscillations for all three fluorescent signals. e Progression of cell length (left) and progression of normalized fluorescent signals (right) of one individual mother cell in the mother machine over time. Source data for d and e are provided as a Source Data file.
Fig. 2
Fig. 2. Characterization of the pneumococcal CRISPRlator.
a Expression of ext-sgRNA2 represses transcription of the mTurquoise2 reporter (blue) and ext-sgRNA3; ext-sgRNA3 represses mNeonGreen (green) and ext-sgRNA1, and ext-sgRNA1 represses mScarlet-I (red) and ext-sgRNA2, leading to oscillatory behavior (~symbol). b Schematic overview of the here designed and used microfluidics device. The chip, measured from the outer edge of the inputs/output, is 14.3 × 6.8 mm. Bacteria were injected via the top inlet and C + Y media was pumped through the middle inlet at a flow rate of 0.5 ml/h. The bottom left inlet was blocked. The single waste outlet is shown on the right. Scale bar = 1.43 mm. c Zoom in on a mother machine lane within the microfluidic device. Mother machine channels are 1.7 µm wide, 1.25 µm high and have 3.4 µm wide side channels of 250 nm height to increase nutrient/waste flow. The main feeding/flow channel is 20 µm high and 60 µm wide. d Mean expression of a total lineage of cells over time in one mother machine lane shows red-green-blue oscillation over time. e Circular lineage tree of the same population shown in d, where color intensity is the mean fluorescence intensity of each single cell in the lineage (left-right: mScarletI, mNeonGreen and mTurquoise2). The ancestor cell is positioned in the middle of each tree.
Fig. 3
Fig. 3. CAPSUlator design and characterization.
a Top: capsule operon and genetic context in wild type D39V. Bottom: CAPSUlator construct placed in four genetic loci on the chromosome. b Gene regulatory circuits of the CAPSUlator and control strains. The ~ symbol indicates that the three-node oscillatory network is intact. The ⊣ symbol signifies repression and the _/- symbol indicates the ring-node network is interrupted. c The CAPSUlator shows heterogeneous production of capsule and the three fluorescent proteins. Capsule production correlates with the production of mScarletI (see also Fig. S2). A micrograph from a representative experiment is shown (the experiment was performed at least 3 times). Scale bar 5 µm. d Left: snap-shots of a microfluidic time-lapse microscopy movie of the CAPSUlator with 1h20m time intervals. Scale bar 2 µm. Cells producing mScarlet-I produce capsule: the cells occupy more space, thereby fitting only one cell in the width of the channel, while cells mainly producing mNeonGreen and mTurquoise2 can fit two cells in the width of a channel and are not growing as a chain. Right: schematic representation.
Fig. 4
Fig. 4. Characterization of synthetic GRNs driving pneumococcal capsule production in traits associated with virulence.
a Pneumococcal biofilm formation was measured by growing strains in microtiter plates at 34 °C. After 6 h, biofilm formation to the wells was quantified using crystal violet staining (see Methods). The amount of biofilm formed by each strain was compared to wild type S. pneumoniae D39V using a two-tailed Wilcoxon signed rank test (n = 9). b The ability of the engineered CAPSUlator strains to adhere to human nasopharyngeal epithelial Detroit-562 cells was tested by infecting a monolayer of cells at an MOI of 5. After 1 h of incubation at 37 °C the non-adherent and adherent bacteria were enumerated by plating (see Methods). The ratio of adherent vs non-adherent bacteria is shown and compared to wild type D39V using a Kruskal–Wallis test (n > 4). c Bacterial survival during starvation was tested by resuspending exponentially growing cells in 1 x PBS followed by incubation at 25 °C. Viable bacteria were quantified by plating and colony counting (see Methods). After 24 h of starvation, all synthetic GRNs except for the CAPSUlator-ON strain showed significantly reduced survival compared to wild type D39V (two-tailed Mann–Whitney test). *p < 0.05, **p < 0.01 (n > 3). Data are presented as mean values +/− SD. Each symbol represents a biologically independent replicate. Source data are provided as a Source Data file. a.u. arbitrary units.
Fig. 5
Fig. 5. Heterogeneous pneumococcal capsule production is beneficial for in vivo colonization compared to homogenous capsule expression.
a Four-day-old mouse pups were inoculated intranasally with 105 CFU of pneumococci and after 24 h sacrificed and bacterial loads were enumerated in nasal lavages. There was no statistically significant difference between wild type and the CAPSUlator strain, while all other GRNs (CAPSUlator-Δcps, CAPSUlator-OFF, CAPSUlator-ON) colonized worse than the CAPSUlator (Mann–Whitney test). *p < 0.05, **p < 0.01, ***p < 0.001 (n > 3, each symbol represents a biologically independent replicate). Source data are provided as a Source Data file. b Conceptual model of the different phenotypes driven by the CAPSUlator GRN and their biological advantages and disadvantages.

Update of

References

    1. Ackermann M. A functional perspective on phenotypic heterogeneity in microorganisms. Nat. Rev. Microbiol. 2015;13:497–508. doi: 10.1038/nrmicro3491. - DOI - PubMed
    1. Reyes Ruiz LM, Williams CL, Tamayo R. Enhancing bacterial survival through phenotypic heterogeneity. PLoS Pathog. 2020;16:e1008439. doi: 10.1371/journal.ppat.1008439. - DOI - PMC - PubMed
    1. Veening J-W, Smits WK, Kuipers OP. Bistability, epigenetics, and bet-hedging in bacteria. Annu. Rev. Microbiol. 2008;62:193–210. doi: 10.1146/annurev.micro.62.081307.163002. - DOI - PubMed
    1. Spratt MR, Lane K. Navigating environmental transitions: the role of phenotypic variation in bacterial responses. mBio. 2022;13:e0221222. doi: 10.1128/mbio.02212-22. - DOI - PMC - PubMed
    1. Ronneau S, Hill PW, Helaine S. Antibiotic persistence and tolerance: not just one and the same. Curr. Opin. Microbiol. 2021;64:76–81. doi: 10.1016/j.mib.2021.09.017. - DOI - PubMed

Publication types

Substances

Associated data