. 2023 Nov 17;14(1):7456.
doi: 10.1038/s41467-023-42924-w.

ATP synthase evolution on a cross-braced dated tree of life

Affiliations

ATP synthase evolution on a cross-braced dated tree of life

Tara A Mahendrarajah et al. Nat Commun. .

Abstract

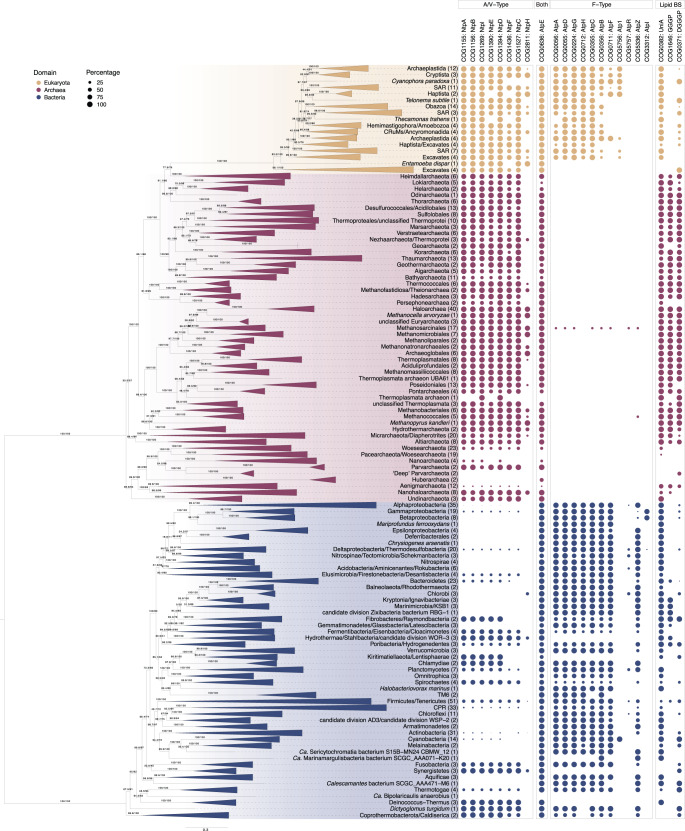
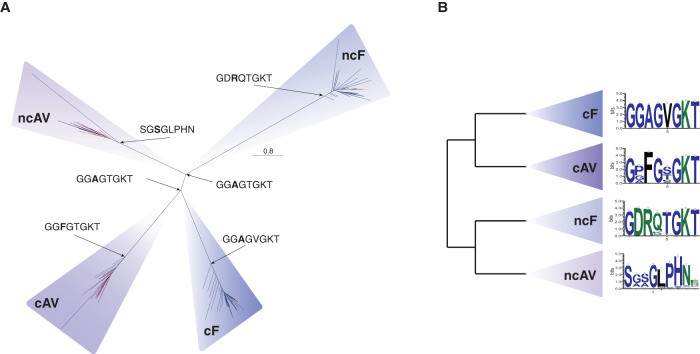
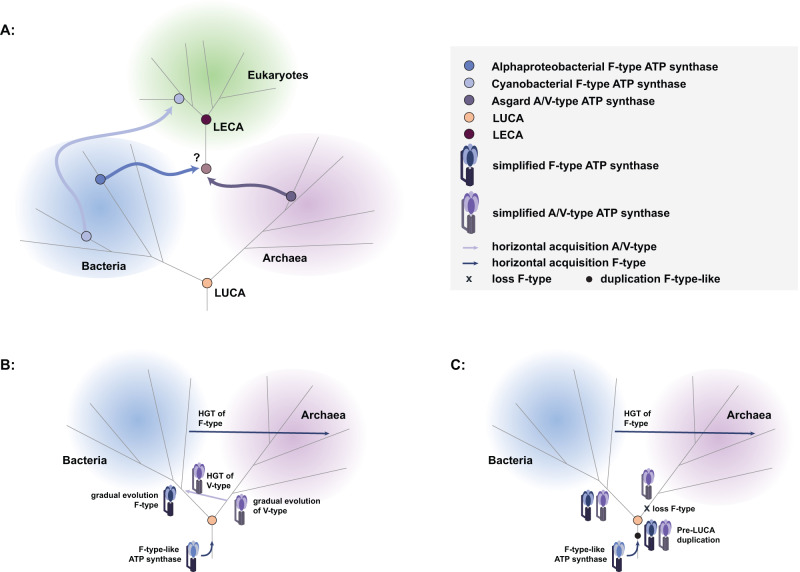
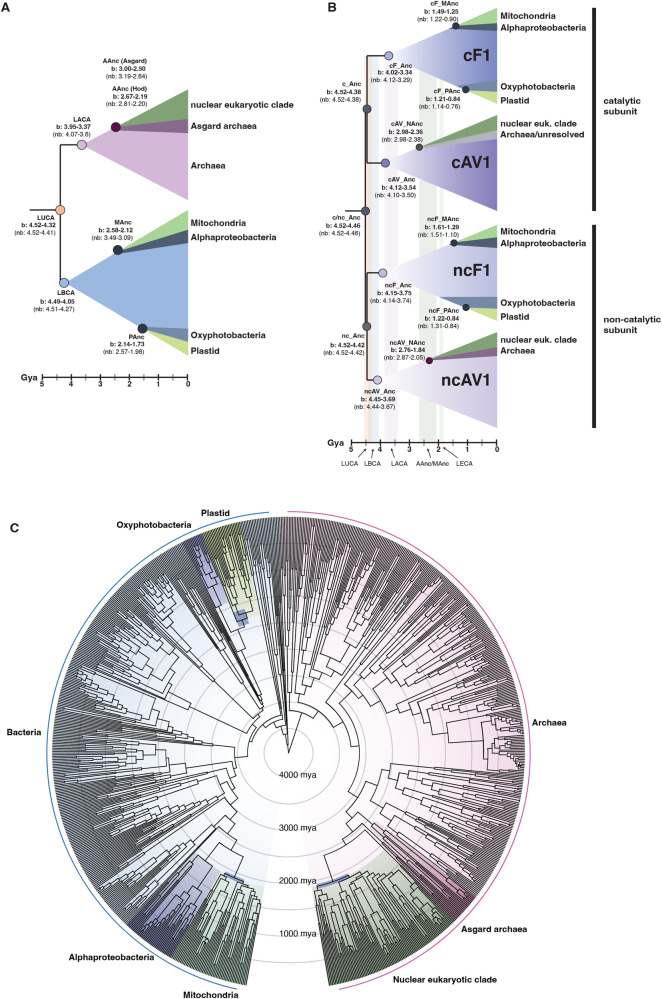
The timing of early cellular evolution, from the divergence of Archaea and Bacteria to the origin of eukaryotes, is poorly constrained. The ATP synthase complex is thought to have originated prior to the Last Universal Common Ancestor (LUCA) and analyses of ATP synthase genes, together with ribosomes, have played a key role in inferring and rooting the tree of life. We reconstruct the evolutionary history of ATP synthases using an expanded taxon sampling set and develop a phylogenetic cross-bracing approach, constraining equivalent speciation nodes to be contemporaneous, based on the phylogenetic imprint of endosymbioses and ancient gene duplications. This approach results in a highly resolved, dated species tree and establishes an absolute timeline for ATP synthase evolution. Our analyses show that the divergence of ATP synthase into F- and A/V-type lineages was a very early event in cellular evolution dating back to more than 4 Ga, potentially predating the diversification of Archaea and Bacteria. Our cross-braced, dated tree of life also provides insight into more recent evolutionary transitions including eukaryogenesis, showing that the eukaryotic nuclear and mitochondrial lineages diverged from their closest archaeal (2.67-2.19 Ga) and bacterial (2.58-2.12 Ga) relatives at approximately the same time, with a slightly longer nuclear stem-lineage.


Conflict of interest statement

The authors declare no competing interests.

Figures

Fig. 1
Fig. 1. Distribution of COG families representing the F- and A/V-type ATP synthase subunits and select lipid biosynthesis genes across the tree of life.
COG families corresponding to the ATP synthase subunits and lipid biosynthesis genes (see Methods for selection of COG families, Supplementary Data 3) are represented as a percentage presence by phylogenetic cluster, consistent with collapsed taxonomic clades in the maximum-likelihood concatenated species tree. The concatenated alignment contains 780 taxa and was trimmed with BMGE v1.12 (settings: -m BLOSUM30 -h 0.55) to remove poorly-aligning positions (final alignment length = 3367 amino acids). The maximum-likelihood tree was inferred using IQ-TREE2 v2.1.2 with the LG+C20+R+F model with SH-like approximate likelihood (left) and ultrafast bootstrap approximation (right), each with 1000 replicates,,. The scale bar corresponds to the expected number of substitutions per site. Color code: archaea = red, bacteria = blue, eukaryotes = yellow.
Fig. 2
Fig. 2. Occurrence of COG families representing the F- and A/V-type ATP synthase subunits and the presence/absence of key metabolic organelles across the 100 sampled eukaryotes.
COG families representing the ATP synthase subunits (see Methods for selection of COG families, Supplementary Data 3) are presented as binary presence-absence counts per taxon. The relationships among eukaryotic supergroups is consistent with Burki, 2020. Dashed lines represent groups with greater uncertainty. Mito = mitochondria and mitochondrion-related organelles (MROs). Plastid = primary-, secondary-, and tertiary-plastid, and kleptoplast. See Supplementary Data 5 for additional information on organelle distribution. The list of eukaryotic ATP synthase sequences flagged as putative bacterial contamination can be found in Supplementary Data 4.
Fig. 3
Fig. 3. Maximum-likelihood tree of all ATP synthase headpiece subunits identified in sampled Archaea (red), Bacteria (blue), and Eukaryotes (yellow).
A Homologs corresponding to each subunit form monophyletic clusters for each protein family. Catalytic subunits (cF1 and cA1V1) and non-catalytic subunits (ncF1 and ncA1V1) cluster together on either side of the root. The alignment contains 1520 sequences and was trimmed with BMGE v1.12 (settings: -m BLOSUM30 -h 0.55) (alignment length = 350 amino acids). The maximum-likelihood tree was inferred using IQ-TREE2 v2.1.2 with the LG+C50+R+F model, selected using the best-fitting model (chosen by BIC),,. The scale bar corresponds to the expected number of substitutions per site. The Walker-A motif from ancestrally reconstructed sequences are shown at their respective nodes. B Conserved protein motifs for each subunit derived from the same alignment.
Fig. 4
Fig. 4. ATP synthase evolutionary scenarios.
A Overview of possible ancestral ATP synthase acquisition in LECA from the putative prokaryotic hosts; the A/V-type derived from the archaeal host, and F-type ATP synthases derived from bacterial endosymbionts. B Evolutionary proposal supporting an F-type-like ancestral ATP synthase present pre-LUCA with subsequent divergence consistent with the split between Bacteria and Archaea and early transfers of A/V-type ATP synthases into the bacterial stem, and late HGT of F-type ATP synthases to Archaea. C Evolutionary proposal supporting an F-type-like ancestral ATP synthase and pre-LUCA duplication and divergence of at least the head components of the F- and A/V-type subunits with subsequent loss of the F-type components along the archaeal stem. The cartoon of the ATP synthase was drawn manually in Adobe illustrator.
Fig. 5
Fig. 5. Timing of cellular evolution across the tree of life based on a cross-braced dated ribosomal species tree and ATP synthase gene tree.
A Suggested timing of key evolutionary events based on a schematic ribosomal species tree. B Suggested timing of key evolutionary events based on a schematic ATP synthase gene tree. C Dated cross-braced ribosomal species tree (Edited2, see Methods) including nuclear, mitochondrial, and plastid eukaryotic homologs. See Methods for inference of the maximum-likelihood concatenated ribosomal species phylogeny and constraints (Edited2). The alignment contained 863 sequences and was trimmed with TRIMAL (alignment length = 2133 amino acids), and the maximum-likelihood phylogeny was inferred using IQ-TREE2 v2.1.2 the LG+C60+R+F model,,. Abbreviations: b braced, nb non-braced, MAncL shared ancestor of mitochondria and closest alphaproteobacterial sister lineage, AAnc: shared ancestor of eukaryotic host lineage and closest asgardarchaeal sister lineage; Hod, Hodarchaeales; PAnc, shared ancestor of plastid and closest cyanobacterial sister lineage; c catalytic; nc non-catalytic; F F-type ATP-synthase; AV AV-type ATP-synthase.

References

    1. Spang, A., Mahendrarajah, T. A., Offre, P. & Stairs, C. W. Evolving perspective on the origin and diversification of cellular life and the virosphere. Genome Biol. Evol. 14, 1–19 (2022). - PMC - PubMed
    1. Hug LA, et al. A new view of the tree of life. Nat. Microbiol. 2016;1:16048. doi: 10.1038/nmicrobiol.2016.48. - DOI - PubMed
    1. Spang A, et al. Complex archaea that bridge the gap between prokaryotes and eukaryotes. Nature. 2015;521:173–179. doi: 10.1038/nature14447. - DOI - PMC - PubMed
    1. Zaremba-Niedzwiedzka K, et al. Asgard archaea illuminate the origin of eukaryotic cellular complexity. Nature. 2017;541:353–358. doi: 10.1038/nature21031. - DOI - PubMed
    1. Spang A, et al. Asgard archaea are the closest prokaryotic relatives of eukaryotes. PLoS Genet. 2018;14:e1007080. doi: 10.1371/journal.pgen.1007080. - DOI - PMC - PubMed

Publication types

Substances

LinkOut - more resources