. 2024 Jan;31(1):53-64.
doi: 10.1038/s41418-023-01239-5. Epub 2023 Nov 17.

TRIM3 facilitates ferroptosis in non-small cell lung cancer through promoting SLC7A11/xCT K11-linked ubiquitination and degradation

Affiliations

TRIM3 facilitates ferroptosis in non-small cell lung cancer through promoting SLC7A11/xCT K11-linked ubiquitination and degradation

Zhangjie Wang et al. Cell Death Differ. 2024 Jan.

Abstract

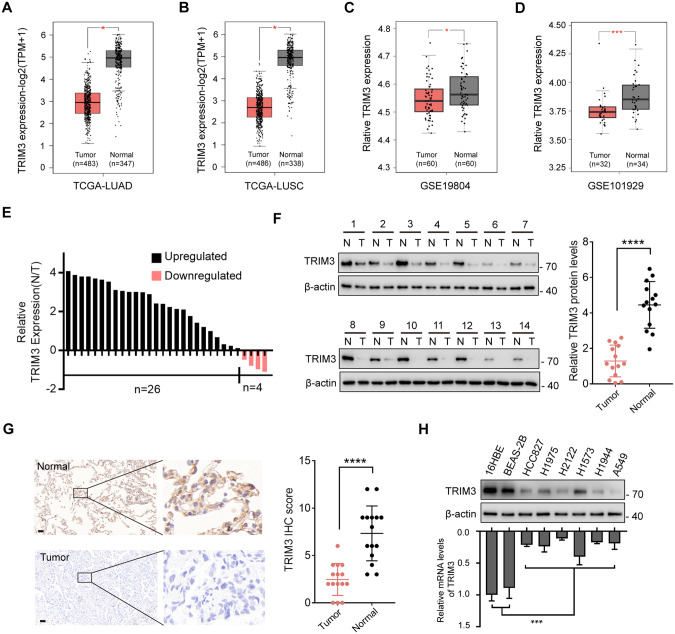
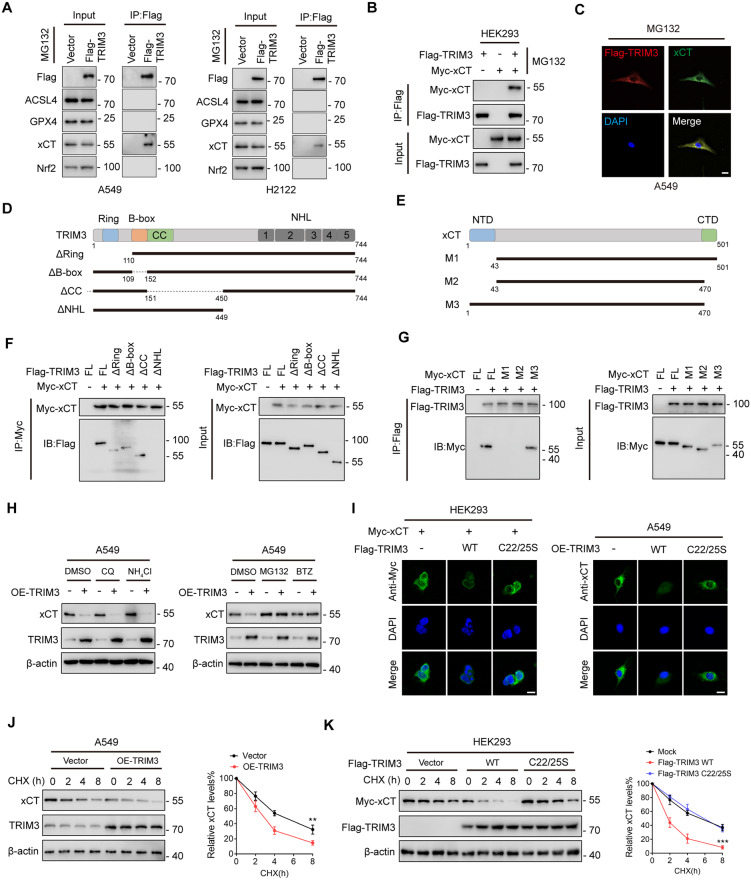
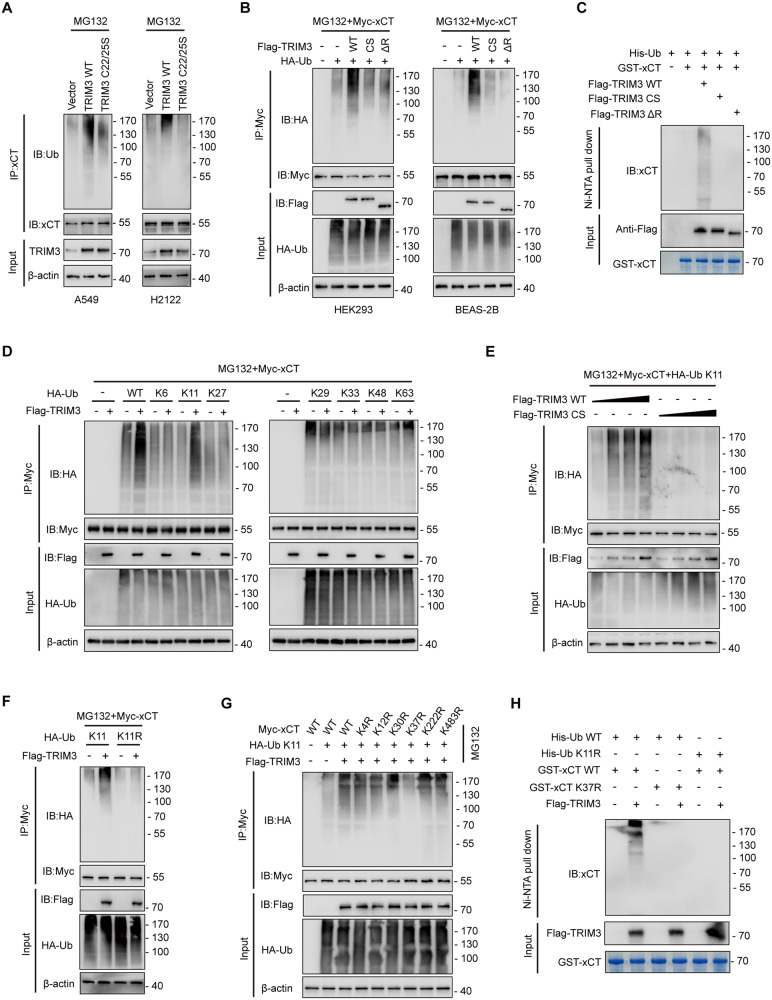
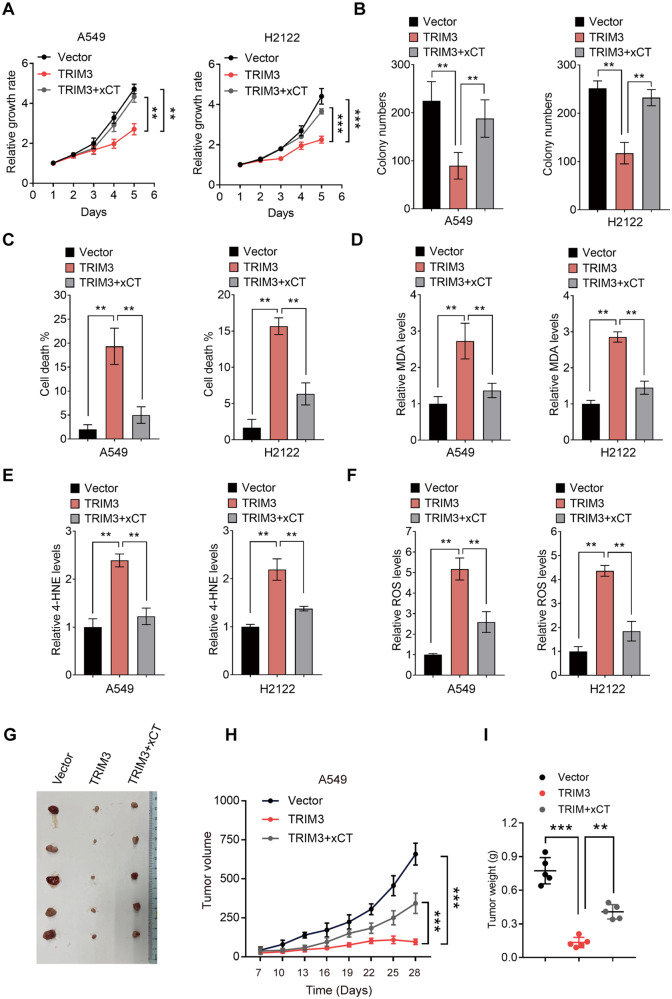
Ferroptosis, a unique form of regulated necrotic cell death, is caused by excessive iron-dependent lipid peroxidation. However, the underlying mechanisms driving ferroptosis in human cancers remain elusive. In this study, we identified TRIM3, an E3 ubiquitin-protein ligase, as a key regulator of ferroptosis. TRIM3 is downregulated in lung adenocarcinoma (LUAD) and lung squamous cell carcinoma (LUSC), two major types of non-small cell lung cancer (NSCLC). Forced expression of TRIM3 promotes cell death by enhancing the cellular level of ROS and lipid peroxidation. Moreover, our in vivo study determined that TRIM3 overexpression diminishes the tumorigenicity of NSCLC cells, indicating that TRIM3 functions as a tumor suppressor in NSCLC. Mechanistically, TRIM3 directly interacts with SLC7A11/xCT through its NHL domain, leading to SCL7A11 K11-linked ubiquitination at K37, which promotes SLC7A11 proteasome-mediated degradation. Importantly, TRIM3 expression exhibits a negative correlation with SCL7A11 expression in clinical NSCLC samples, and low TRIM3 expression is associated with a worse prognosis. This study reveals that TRIM3 functions as a tumor suppressor that can impede the tumorigenesis of NSCLC by degrading SLC7A11, suggesting a novel therapeutic strategy against NSCLC.


Conflict of interest statement

The authors declare that they have no competing interests.

Figures

Fig. 1
Fig. 1. TRIM3 is downregulated in non-small cell lung cancer.
A Box plot analysis of TRIM3 mRNA levels in lung adenocarcinoma (LUAD) tissues (n = 483) and normal lung tissues (n = 347) from the TCGA database. B Box plot analysis of TRIM3 mRNA levels in lung squamous cell carcinoma (LUSC) tissues (n = 486) and normal lung tissues (n = 338) from the TCGA database. C, D Box plot analysis of TRIM3 mRNA levels in non-small cell lung cancer (NSCLC) tissues and normal lung tissues from the GSE19804 (C) and GSE101929 (D) datasets. E Expression of TRIM3 in 30 paired clinical samples with NSCLC and adjacent tissues was analyzed by q-PCR. F Western blot analysis for the protein levels of TRIM3 in 14 paired clinical samples with NSCLC and adjacent tissues. G Representative IHC images of TRIM3 expression in normal and tumor tissues. Scale bars: 100 μm. H Protein and relative mRNA levels of TRIM3 in human normal lung epithelial cells, human normal bronchial epithelial cells, and a panel of lung cancers were determined by western blot and q-PCR, respectively. Data are represented as the mean ± SD. Statistical analysis was performed using Student’s t-test (AD, F, and G) and two-sided t-test (H), *p < 0.05; ***p < 0.001; ****p < 0.0001.
Fig. 2
Fig. 2. TRIM3 overexpression impedes the proliferation and invasion of lung cancer cells.
A Western blot assay of TRIM3 expression in A549 and H2122 cells transfected with TRIM3 or vector control. B Western blot assay of TRIM3 expression in H1573 cells transfected with siTRIM3 RNA or siRNA control. C, D CCK-8 assay of A549, H2122 (C) and H1573 (D) cells transfected as indicated. E, F Colony formation assay of A549, H2122 (C) and H1573 (D) cells transfected as indicated. Scale bars: 0.5 cm. G, H Invasion (G) and wound-healing assay (H) of A549 and H2122 cells transfected with TRIM3 or vector control. I, J Invasion (I) and wound-healing assay (J) of H1573 cells transfected with siTRIM3 RNA or siRNA control. K Representative tumor images in nude mice bearing A549 cells transfected as indicated. L The tumor volume was monitored every 3 days. M The tumor weight. N The tumors were harvested and the expression of Ki-67 in different groups was determined by IHC. Data are represented as the mean ± SD (n = 3). Statistical analysis was performed using Student’s t-test, *p < 0.05; **p < 0.01; ***p < 0.001; ****p < 0.0001.
Fig. 3
Fig. 3. TRIM3 facilitates ferroptosis in lung cancer cells.
A, B Trypan blue staining assays using vector control- or TRIM3-overexpressing A549 and H2122 cells treated with two ferroptosis inhibitors (500 nM Lip-1 and 10 μM Fer-1), an apoptosis inhibitor (10 μM Z-VAD-FMK), a necrosis inhibitor (10 μM Nec-1), or an autophagy inhibitor (1 mmol/L 3-MA). C Trypan blue staining assays using H1573 cells transfected with siRNA control or siTRIM3 RNA upon treatment with the ferroptosis inducer (20 μM Erastin). DG Relative expression levels of MDA (D-E), 4-HNE (F) and ROS (G) in A549 and H2122 cells transfected with TRIM3 or vector control. HK Relative expression levels of MDA (H, I), 4-HNE (J), and ROS (K) in H1573 cells transfected with siTRIM3 RNA or siRNA control. Data are represented as the mean ± SD (n = 3). Statistical analysis was performed using Student’s t-test, *p < 0.05; **p < 0.01; ***p < 0.001; ****p < 0.0001.
Fig. 4
Fig. 4. TRIM3 promotes xCT degradation.
A A549 and H2122 cells transfected with Flag-TRIM3 were subjected to IP analysis with anti-Flag antibody and then analyzed by IB with the indicated antibodies. B HEK293 cells transfected with Flag-TRIM3 and Myc-xCT were subjected to IP analysis with anti-Flag antibody and then analyzed by IB with the indicated antibodies. C Confocal assay showing co-localization of Flag-TRIM3 (red) and xCT (green) in A549 cells. Nuclei were counterstained with DAPI (blue). Scale bar: 10 μm. D, E Sketch map of full-length (FL) Flag-labeled TRIM3, Myc-labeled xCT, and their various deletion mutants. F HEK293 cells were co-transfected with Myc-xCT and FL Flag-TRIM3 or deletion mutants. After treatment with MG132 (20 μM) for 6 h, cell lysates were subjected to IP followed by western blotting assay with the indicated antibodies. G HEK293 cells were co-transfected with Flag-TRIM3 and FL Myc-xCT or deletion mutants. After treatment with MG132 (20 μM) for 6 h, cell lysates were subjected to IP followed by western blot assay with the indicated antibodies. H A549 cells transfected with TRIM3 or vector control were treated as indicated. The xCT and TRIM3 expression levels were determined by western blotting. I Confocal assay of xCT expression in HEK293 and A549 cells transfected as indicated. J A549 cells transfected with TRIM3 or vector control were treated with CHX for the indicated times. The protein levels of xCT and TRIM3 were determined by western blotting. Quantification of xCT levels relative to β-actin are shown. K Myc-xCT was co-transfected with vector control, Flag-TRIM3 WT or Flag-TRIM3 C22/25S into HEK293 cells. After being treated with CHX for the indicated times, the cells were subjected to western blot analysis. Quantification of xCT levels relative to β-actin is shown. Data are represented as the mean ± SD (n = 3). Statistical analysis was performed using Student’s t-test, **p < 0.01; ***p < 0.001.
Fig. 5
Fig. 5. TRIM3 catalyzes K11-linked ubiquitination of xCT at K37.
A A549 and H2122 cells transfected with vector control, TRIM3 WT or TRIM3 C22/25S were subjected to denaturing-IP (d-IP) with ant-xCT antibody and analyzed by western blotting. Cells were treated with MG132 (20 μM) for 6 h before collection. B Myc-xCT was co-transfected with Flag-TRIM3 WT, Flag-TRIM3 C22/25S or Flag-TRIM3 ΔR into HEK293 cells. After treatment with MG132 (20 μM) for 6 h, the cells were collected and subjected to d-IP and western blot assays. C Purified GST-xCT was incubated with purified Flag-TRIM3 WT, Flag-TRIM3 C22/25S or Flag-TRIM3 ΔR proteins. Then the reaction mixtures were subjected to Ni-NTA pull down and the precipitated proteins were analyzed by western blotting using an anti-xCT antibody. D HEK293 cells were transfected with Myc-xCT and Flag-TRIM3 together with ubiquitin WT or different ubiquitin mutants. After treatment with MG132 (20 μM) for 6 h, the cells were collected and subjected to d-IP and western blot assays. E HEK293 cells transfected with Myc-xCT and increasing amounts of Flag-TRIM3 WT or Flag-TRIM3 C22/25S were subjected to d-IP with anti-Myc antibody and analyzed by western blotting. Cells were treated with MG132 (20 μM) for 6 h before collection. F HEK293 cells were transfected with Myc-xCT and Flag-TRIM3 together with ubiquitin WT or ubiquitin K11R mutant. After treatment with MG132 (20 μM) for 6 h, the cells were collected and subjected to d-IP and western blot assays. G HEK293 cells transfected with Flag-TRIM3, ubiquitin K11, and different Myc-xCT mutants were subjected to d-IP with anti-Myc antibody and analyzed by western blotting. Cells were treated with MG132 (20 μM) for 6 h before collection. H Purified GST-xCT WT or GST-xCT K37R was incubated with purified Flag-TRIM3 proteins and His-ubiquitin WT or His-ubiquitin K11R. Then the reaction mixtures were subjected to Ni-NTA pull down, and the precipitated proteins were analyzed by western blotting using an anti-xCT antibody.
Fig. 6
Fig. 6. TRIM3 promotes ferroptosis in NSCLC cells through xCT.
A CCK-8 assay of A549 and H2122 cells transfected as indicated. B Colony formation assay of A549 and H2122 cells transfected as indicated. C The cell death rate in A549 and H2122 cells transfected as indicated was determined by trypan blue staining assay. DF Relative ferroptosis levels in A549 and H2122 cells transfected as indicated were determined by MDA (D), 4-HNE (E), and ROS (F) levels. G Representative tumor images in nude mice bearing A549 cells transfected as indicated. H The tumor volume was monitored every 3 days. I The tumor weight. Data are represented as the mean ± SD (n = 3). Statistical analysis was performed using Student’s t-test, *p < 0.05; **p < 0.01; ***p < 0.001; ****p < 0.0001.
Fig. 7
Fig. 7. TRIM3 shows a negative correlation with xCT protein levels in clinical NSCLC samples.
A Representative images of IHC assay of TRIM3, xCT, and MDA in clinical NSCLC samples. Scale bars: 100 µm. B Correlation analysis of TRIM3 and xCT expression in (A); chi-square test. C Kaplan–Meier analyses for patients in (A); long-rank test. D Pan-cancer analysis of relative TRIM3 mRNA levels in the TCGA database.

References

    1. Brody H. Lung cancer. Nature. 2020;587:S7. doi: 10.1038/d41586-020-03152-0. - DOI - PubMed
    1. Sung H, Ferlay J, Siegel RL, Laversanne M, Soerjomataram I, Jemal A, et al. Global Cancer Statistics 2020: GLOBOCAN Estimates of Incidence and Mortality Worldwide for 36 Cancers in 185 Countries. CA Cancer J Clin. 2021;71:209–49. doi: 10.3322/caac.21660. - DOI - PubMed
    1. Le X, Nilsson M, Goldman J, Reck M, Nakagawa K, Kato T, et al. Dual EGFR-VEGF pathway inhibition: a promising strategy for patients With EGFR-Mutant NSCLC. J Thorac Oncol. 2021;16:205–15. doi: 10.1016/j.jtho.2020.10.006. - DOI - PubMed
    1. Herbst RS, Morgensztern D, Boshoff C. The biology and management of non-small cell lung cancer. Nature. 2018;553:446–54. doi: 10.1038/nature25183. - DOI - PubMed
    1. Wang M, Herbst RS, Boshoff C. Toward personalized treatment approaches for non-small-cell lung cancer. Nat Med. 2021;27:1345–56. doi: 10.1038/s41591-021-01450-2. - DOI - PubMed

Publication types

MeSH terms