. 2023 Nov 17;14(1):7471.
doi: 10.1038/s41467-023-42277-4.

Inflammatory macrophages reprogram to immunosuppression by reducing mitochondrial translation

Affiliations

Inflammatory macrophages reprogram to immunosuppression by reducing mitochondrial translation

Marlies Cortés et al. Nat Commun. .

Abstract

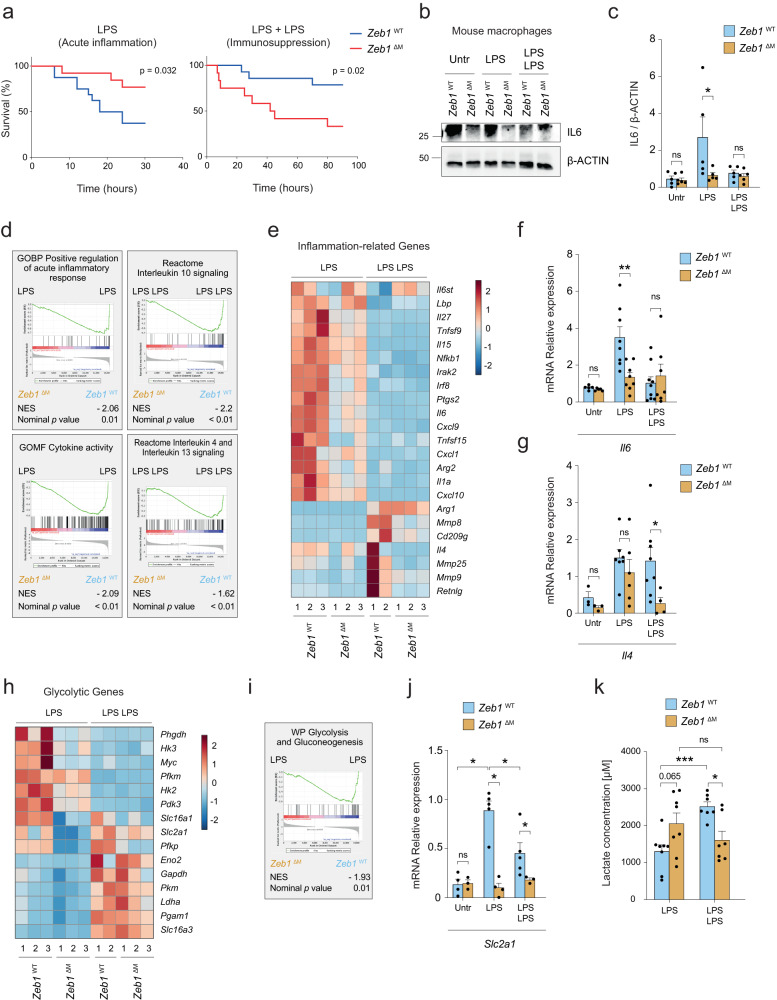
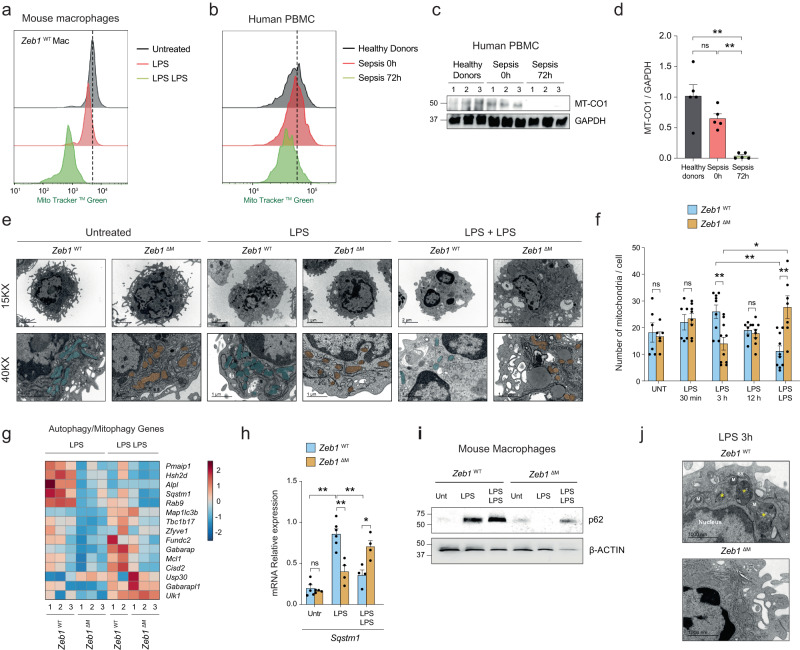
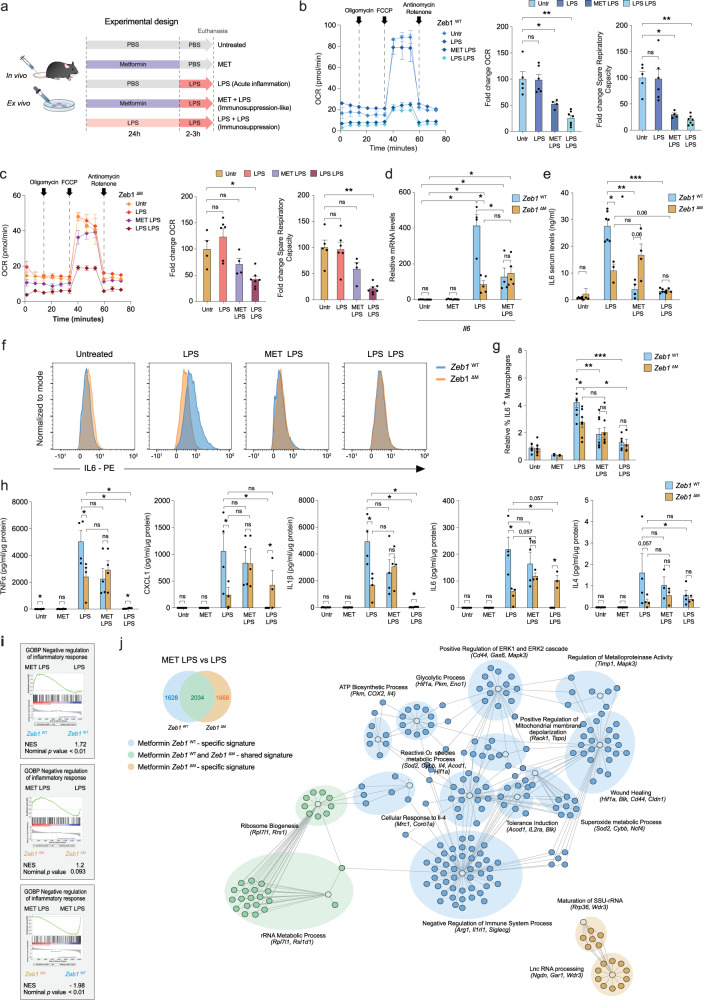
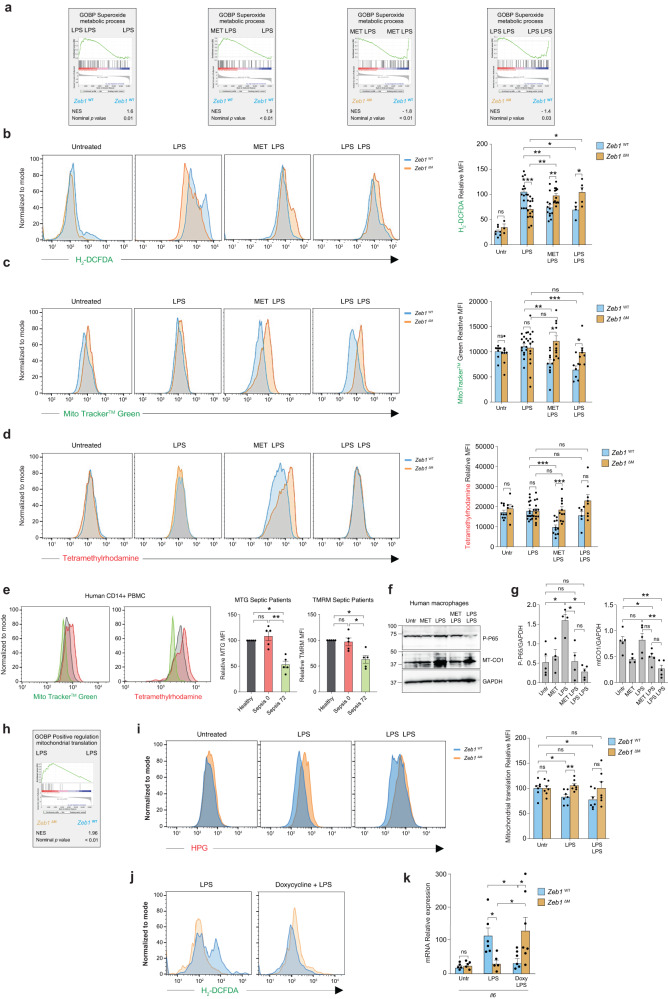
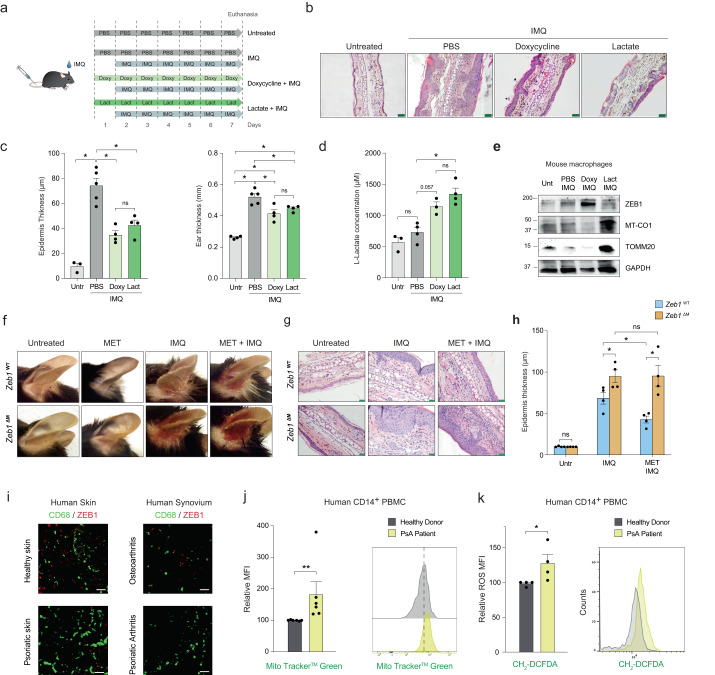
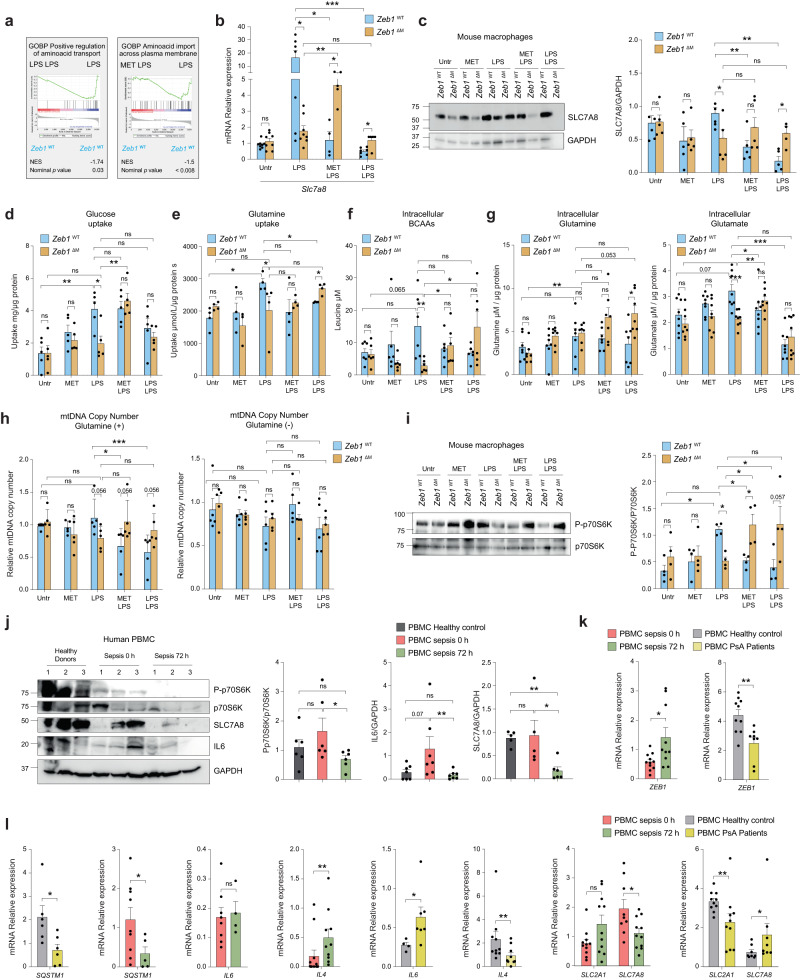
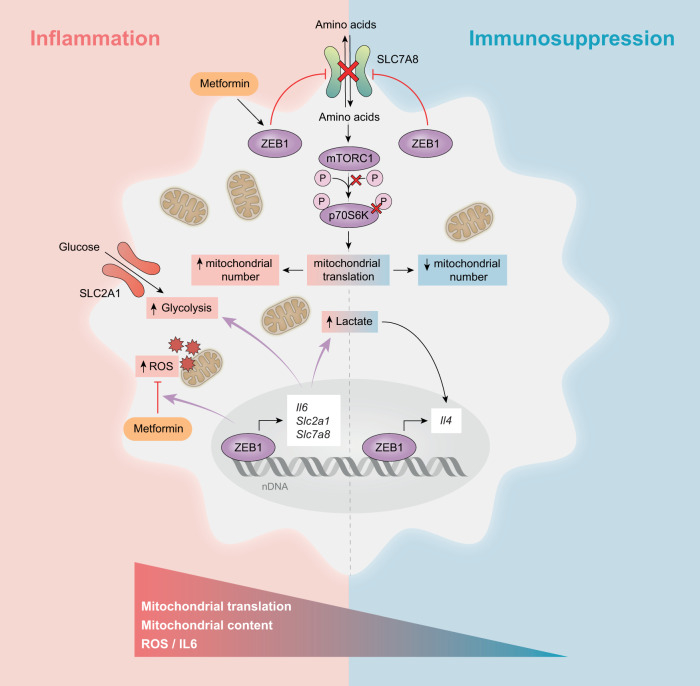
Acute inflammation can either resolve through immunosuppression or persist, leading to chronic inflammation. These transitions are driven by distinct molecular and metabolic reprogramming of immune cells. The anti-diabetic drug Metformin inhibits acute and chronic inflammation through mechanisms still not fully understood. Here, we report that the anti-inflammatory and reactive-oxygen-species-inhibiting effects of Metformin depend on the expression of the plasticity factor ZEB1 in macrophages. Using mice lacking Zeb1 in their myeloid cells and human patient samples, we show that ZEB1 plays a dual role, being essential in both initiating and resolving inflammation by inducing macrophages to transition into an immunosuppressed state. ZEB1 mediates these diverging effects in inflammation and immunosuppression by modulating mitochondrial content through activation of autophagy and inhibition of mitochondrial protein translation. During the transition from inflammation to immunosuppression, Metformin mimics the metabolic reprogramming of myeloid cells induced by ZEB1. Mechanistically, in immunosuppression, ZEB1 inhibits amino acid uptake, leading to downregulation of mTORC1 signalling and a decrease in mitochondrial translation in macrophages. These results identify ZEB1 as a driver of myeloid cell metabolic plasticity, suggesting that targeting its expression and function could serve as a strategy to modulate dysregulated inflammation and immunosuppression.


Conflict of interest statement

The authors declare no competing interests.

Figures

Fig. 1
Fig. 1. ZEB1 plays a dual role being required for both the induction and resolution of inflammation.
a Survival plots of 8–10 weeks old female Zeb1WT and Zeb1∆M mice treated with LPS (15 Zeb1WT, 12 Zeb1∆M) to induce acute inflammation, and treated with LPS + LPS (14 Zeb1WT, 12 Zeb1∆M) to induce immunosuppression. b Peritoneal macrophages from Zeb1WT and Zeb1∆M mice were untreated, or treated with LPS or LPS + LPS and blotted for IL6 along with β-ACTIN as a loading control. The blot shown is representative of five independent experiments. c quantification of IL6 levels relative to β-ACTIN levels in n = 5 biologically independent experiments as in (b). d Left Panel: GSEA plots for inflammatory signatures comparing macrophages from Zeb1WT and Zeb1∆M mice treated with LPS. Right panel: GSEA plots for anti-inflammatory signatures comparing macrophages from Zeb1WT and Zeb1∆M mice treated with LPS + LPS. e Heatmap of inflammation-related genes in peritoneal macrophages from Zeb1WT and Zeb1∆M mice treated with either LPS or LPS + LPS. f Il6 mRNA levels in peritoneal macrophages from Zeb1WT and Zeb1∆M mice either untreated, treated with LPS, or treated with LPS + LPS (n = 5,5,8,8,9,7). g as in (f), but for Il4 (n = 3,3,7,6,8,4). h Heatmap of glycolytic genes in peritoneal macrophages from Zeb1WT and Zeb1∆M mice subjected to either LPS or LPS + LPS. i GSEA plots for Glycolysis and Gluconeogenesis signature comparing macrophages from Zeb1WT and Zeb1∆M mice treated with LPS. j As in (f), but for Slc2a1 (n = 4,3,5,4,5,3). k Lactate levels in macrophages from Zeb1WT and Zeb1∆M mice treated with LPS (n = 8) or LPS + LPS (n = 7). Statistical analysis of Kaplan Meier survival plots was assessed by the Log-rank (Mantel-Cox) test. Graph bars represent mean values +/− SEM with two-tailed unpaired Mann-Whitney test. p ≤ 0.001 (***), p ≤ 0.01 (**) or p ≤ 0.05 (*) levels, or non-significant (ns) for values of p > 0.05. Numerical values had been added for 0.05 < p < 0.075. Raw data along p values for statistical analyses are included in the Source Data file.
Fig. 2
Fig. 2. ZEB1 regulates mitochondrial content and autophagy during inflammation.
a MTG staining in peritoneal macrophages from wild-type mice untreated, treated with LPS, or treated with LPS + LPS. The FACS plot is representative of at least 3 independent experiments. b MTG staining in the monocyte-enriched PBMC of healthy controls and septic patients at 0 h and 72 h. The FACS plot is representative of at least 5 independent experiments. c Western blot for MT-CO1 and GAPDH in PBMCs from three healthy donors and three septic patients at 0 and 72 h. The blot is representative of three independent experiments. d MT-CO1 protein levels in five healthy controls and five patients relative to GAPDH. e TEM of mitochondria in sorted macrophages from Zeb1WT (labeled in blue) and Zeb1∆M (orange) mice treated with PBS (Untreated), LPS for the indicated periods, or LPS + LPS. A representative macrophage from a 4–5 mice pool for each genotype and condition at 15,000X and 40,000X magnification. Scale bar: 2 μm. f At least 6 pictures were quantified for each genotype and condition. (n = 7,6,6,8,9,10,6,8,10,7) g Heatmap of autophagy-related genes in peritoneal macrophages from Zeb1WT and Zeb1∆M mice treated with LPS or LPS + LPS. h Sqstm1 mRNA in peritoneal macrophages from Zeb1WT and Zeb1∆M untreated, treated with LPS or LPS + LPS. (n = 5,4,6,4,4,4). i As in Fig. 2c, but for p62/SQSTM1 and β-ACTIN. Blots are representative of four independent experiments. j Ultrastructure of autophagic vacuoles in LPS-treated macrophages. TEM images of Zeb1WT and Zeb1∆M macrophages from mice treated with LPS for 3 h. Yellow asterisks: autophagic vacuoles in Zeb1WT macrophages, two with increased electron density (autolysosomes). N nucleus, M mitochondria, ER endoplasmic reticulum. Scale bar: 1000 nm. A representative macrophage from a 4–5 mice pool for each genotype and condition. At least 6 pictures were analyzed for each genotype and condition. Graph bars in Fig.  2 represent mean values +/− SEM with two-tailed unpaired Mann–Whitney test. p ≤ 0.001 (***), p ≤ 0.01 (**) or p ≤ 0.05 (*) levels, or non-significant (ns) for values of p > 0.05. Raw data along p values for statistical analyses are included in the Source Data file.
Fig. 3
Fig. 3. Metformin depends on ZEB1 expression in macrophages for its anti-inflammatory effects.
a Experimental design for the in vivo and ex vivo treatment with Metformin (MET). b Oxygen consumption rates (OCR) of Zeb1WT macrophages, either untreated or subjected to the LPS, Metformin + LPS or LPS + LPS protocols as in (a), were assessed by Seahorse XF Cell Mito Stress Test Kit. Average from at least two independent experiments each including two mice per genotype and condition, each in triplicate. Quantification of basal OCR and Spare Respiratory Capacity of Zeb1WT macrophages (n = 5,6,4,7). Untreated is set to 100. c As in (b), but for Zeb1∆M macrophages. d Il6 mRNA levels in peritoneal macrophages from Zeb1WT and Zeb1∆M untreated (PBS), treated with Metformin, LPS or Metformin + LPS (n = 4,5,4,5,4,5,4,5). e Zeb1WT and Zeb1∆M mice were injected i.p. with PBS or LPS, Metformin + LPS or LPS + LPS. IL6 serum levels were measured by ELISA 3 h after the last LPS injection. (n = 6,4,7,3,4,4,5,4 mice). f Intracellular IL6 was assessed by FACS in F4/80+ peritoneal macrophages from Zeb1WT and Zeb1∆M subjected to the indicated treatments. A representative plot of at least three independent experiments. g Quantification of IL6+ macrophages in (f) (n = 7,5,2,2,8,7,8,8,5,4). h Cytokine/chemokine production was assessed in the supernatant of peritoneal macrophages from Zeb1WT and Zeb1∆M mice subjected to the indicated treatments. n = 4 with a pool of two mice per sample. i GSEA plots for negative regulation of inflammatory response signature comparing LPS versus Metformin + LPS in Zeb1WT or Zeb1∆M macrophages or Metformin + LPS in Zeb1WT versus Zeb1∆M macrophages. j Venn diagram and gene ontology Cytoscape analysis on the effect of Metformin (MET) in the gene signature of LPS (MET + LPS versus LPS) for each genotype. Specific Metformin signatures for Zeb1WT (blue) Zeb1∆M (orange) or shared signatures (green). Each node shows selected DEGs associated with its own GO cluster. Graph bars in Fig. 3 represent mean values +/− SEM with two-tailed unpaired Mann–Whitney test. p ≤ 0.001 (***), p ≤ 0.01 (**) or p ≤ 0.05 (*) levels, or non-significant (ns) for values of p > 0.05. Numerical values had been added for 0.05 < p < 0.075. Raw data along p values for statistical analyses are included in the Source Data file.
Fig. 4
Fig. 4. ZEB1 mediates Metformin’s immunosuppression-mimicking effect by reducing mitochondrial content and ROS levels.
a GSEA plots for “Superoxide metabolic process” signature comparing macrophages from Zeb1WT and Zeb1∆M mice subjected to the indicated treatments. b Zeb1WT and Zeb1∆M mice were injected i.p. with PBS, LPS, Metformin + LPS, or LPS + LPS and ROS production was assessed by FACS for CH2-DCFDA staining in F4/80+ cells. A representative plot of 6–15 mice per genotype and condition in four independent experiments. CH2-DCFDA MFI in macrophages (n = 7,3,13,15,12,13,4,5 mice). c As in (b), macrophages were assessed for MTG staining (n = 7,7,13,13,9,10,6,7 mice). d As in (b), macrophages were assessed for TMRM (n = 9,6,15,14,11,11,6,8 mice). e At the indicated time, human CD14+ PBMCs from a healthy donor and septic patients were assessed for MTG and TMRM staining. Representative FACS plots (n = 5 individuals per condition) and MFI quantification. f A representative blot of at least four independent experiments to assess MT-CO1 and P-p65 in human macrophages treated as indicated. g Quantification of MT-CO1 (n = 5,4,5,5,5) and P-P65 expression relative to GAPDH (n = 5,4,4,4,5) in all experiments for (f). h GSEA plot for “Positive regulation of mitochondrial translation” annotation comparing macrophages from LPS-treated Zeb1WT and Zeb1∆M mice. i Mitochondrial translation in macrophages from Zeb1WT and Zeb1∆M mice either untreated or treated with LPS or LPS + LPS was assessed by FACS for L-HPG with Alexa Fluor® 647 picolyl azide. Representative plots of n = 7 independent experiments. Quantification analysis of all experiments. j CH2-DCFDA staining of macrophages from Zeb1WT and Zeb1∆M mice treated with LPS or doxycycline + LPS. The FACS plots shown are representative of a total of 4–5 mice per genotype and condition assessed in two independent experiments. k Il6 mRNA in macrophages from Zeb1WT and Zeb1∆M mice either untreated or treated with LPS or doxycycline + LPS. Average of 5–6 mice for each genotype assessed in two independent experiments (n = 4,5,5,5,6,7). Graph bars in Fig. 4 represent mean values +/− SEM with two-tailed unpaired Mann–Whitney test. p ≤ 0.001 (***), p ≤ 0.01 (**) or p ≤ 0.05 (*) levels, or non-significant (ns) for values of p > 0.05. Raw data along p values for statistical analyses are included in the Source Data file.
Fig. 5
Fig. 5. Metformin requires ZEB1 expression in macrophages for its anti-inflammatory effects in psoriatic disease lesions.
a Schematic of the protocols used in the Imiquimod (IMQ) mouse model. Ten-to-twelve weeks age male mice treated with Imiquimod and either PBS, doxycycline, or lactate. b H&E staining of histological ear sections of mice either untreated and treated with Imiquimod, Lactate + Imiquimod, or Doxycycline + Imiquimod. Scale bar, 50 μm. c Quantification of the epidermal ear thickness assessed in four pictures from at least four mice per condition as in (b) (n = 3,5,4,4 mice for each condition). Quantification of the ear thickness of four mice per condition. d Lactate levels in the supernatant of peritoneal macrophages from wild-type mice left untreated or treated with PBS + Imiquimod, Doxycycline + Imiquimod, or Lactate + Imiquimod (n = 3,4,3,4). e Western blot for ZEB1, MT-CO1, TOMM20 and GAPDH in peritoneal wild-type macrophages treated as in (b). f Representative pictures from three independent experiments of Zeb1WT and Zeb1∆M mice after 7 days of treatment with PBS, Metformin, Imiquimod or Metformin + Imiquimod. g As in (f), but ear sections were counterstained for H&E. Scale bar: 50 μm. h As in (f), epidermal ear thickness in four mice per genotype and condition in three independent experiments was quantified by ImageJ. Four separate areas in two pictures were quantified for each mouse ear (n = 4). I CD68 and ZEB1 staining along with DAPI in the skin samples from healthy donors and psoriatic patients as well as synovial membrane samples from osteoarthritis and PsA patients. Representative captions of at least two independent experiments. Scale bar: 25 μm. j MFI quantification and representative FACS plots for MTG staining in CD14+ PBMCs from six PsA patients relative to the MTG’s MFI of six healthy controls (n = 6). k As in (j), but CH2-DCFDA staining in CD14+ PBMCs from four healthy donors and four PsA patients (n = 4). Graph bars in Fig. 4 represent mean values +/− SEM with two-tailed unpaired Mann–Whitney test. p ≤ 0.001 (***), p ≤ 0.01 (**) or p ≤ 0.05 (*) levels, or non-significant (ns) for values of p > 0.05. Numerical values had been added for 0.05 < p < 0.075. Raw data along p values for statistical analyses are included in the Source Data file.
Fig. 6
Fig. 6. ZEB1 inhibits mitochondrial protein translation by restricting amino acid transport.
a GSEA plot “Amino acid transport signature in Zeb1WT macrophages under the indicated treatments. b Slc7a8 mRNA in macrophages from Zeb1WT and Zeb1∆M mice subjected to the indicated treatments. Average of 4–10 mice per genotype and condition in three independent experiments (n = 8,8,7,8,4,5,7,5). c Representative blot of five independent experiments for SLC7A8 and GAPDH in peritoneal macrophages under the indicated treatments. Quantification of SLC7A8 relative to GAPDH (n = 5). d Glucose uptake by peritoneal macrophages from Zeb1WT and Zeb1∆M treated as indicated and assessed 4 h after the last LPS dose (n = 5). e As in (d), but for glutamine uptake (n = 4). f As in (d), but for intracellular BCAAs in cell lysates 4 h after the last LPS dose (n = 6). g As in (f), but for intracellular glutamine (n = 7) and glutamate (n = 8) levels corrected by cell protein levels. h Relative mtDNA copy number in macrophages from Zeb1WT and Zeb1∆M mice treated as indicated and cultured with (left panel) or without (right panel) glutamine in the medium (n = 5). i Western blots for p70S6K, P-P70S6K, and GAPDH in Zeb1WT and Zeb1∆M peritoneal macrophages treated as indicated. A representative blot and quantification of P-p70s6k normalized to p70s6k (n = 4). (j) Western blots for for P-p70s6k, P70S6K, IL6, SLC7A8, and GAPDH in PBMCs of three healthy donors and three septic patients at 0 and 72 h. Representative blot of two independent experiments, with 2-3 patients per condition. Quantification of P-p70s6k protein levels normalized to p70s6k (n = 6), as well as IL6 (n = 7) and SLC7A8 (n = 5) normalized to GAPDH. k ZEB1 mRNA in PBMCs from septic patients at 0 h (n = 11) and 72 h (n = 10), healthy donors (n = 10), and PsA patients (n = 8). l As in (k), but for SQSTM1 in septic patients (n = 9,5) and Healthy/PsA (n = 6), IL4 in septic patients (n = 12,10) and Healthy/PsA (n = 10,9), IL6 in septic patients (n = 8,4) and Healthy/PsA (n = 4,7), SLC2A1 in septic patients (n = 11) and Healthy/PsA (n = 10), and SLC7A8 in septic patients (n = 9,11) and Healthy/PsA (n = 8). Graph bars in Fig. 6 represent mean values +/− SEM with two-tailed unpaired Mann–Whitney test. p ≤ 0.001 (***), p ≤ 0.01 (**) or p ≤ 0.05 (*) levels, or non-significant (ns) for values of p > 0.05. Raw data along p values for statistical analyses are included in the Source Data file.
Fig. 7
Fig. 7. Schematic summary model.
ZEB1 regulates inflammation and immunosuppression in macrophages and is required for the anti-inflammatory and ROS-inhibiting effects of Metformin.

References

    1. Cecconi M, Evans L, Levy M, Rhodes A. Sepsis and septic shock. Nature. 2018;392:75–87. - PubMed
    1. Medzhitov R. The spectrum of inflammatory responses. Nature. 2021;374:1070–1075. - PubMed
    1. van der Poll T, van de Veerdonk FL, Scicluna BP, Netea MG. The immunopathology of sepsis and potential therapeutic targets. Nat. Rev. Immunol. 2017;17:407–420. doi: 10.1038/nri.2017.36. - DOI - PubMed
    1. Fullerton JN, Gilroy DW. Resolution of inflammation: a new therapeutic frontier. Nat. Rev. Drug Discov. 2016;15:551–567. doi: 10.1038/nrd.2016.39. - DOI - PubMed
    1. Cheng SC, et al. Broad defects in the energy metabolism of leukocytes underlie immunoparalysis in sepsis. Nat. Immunol. 2016;17:406–413. doi: 10.1038/ni.3398. - DOI - PubMed

Publication types