. 2023 Nov 17;14(1):7473.
doi: 10.1038/s41467-023-43038-z.

Simultaneous selection of nanobodies for accessible epitopes on immune cells in the tumor microenvironment

Affiliations

Simultaneous selection of nanobodies for accessible epitopes on immune cells in the tumor microenvironment

Thillai V Sekar et al. Nat Commun. .

Abstract

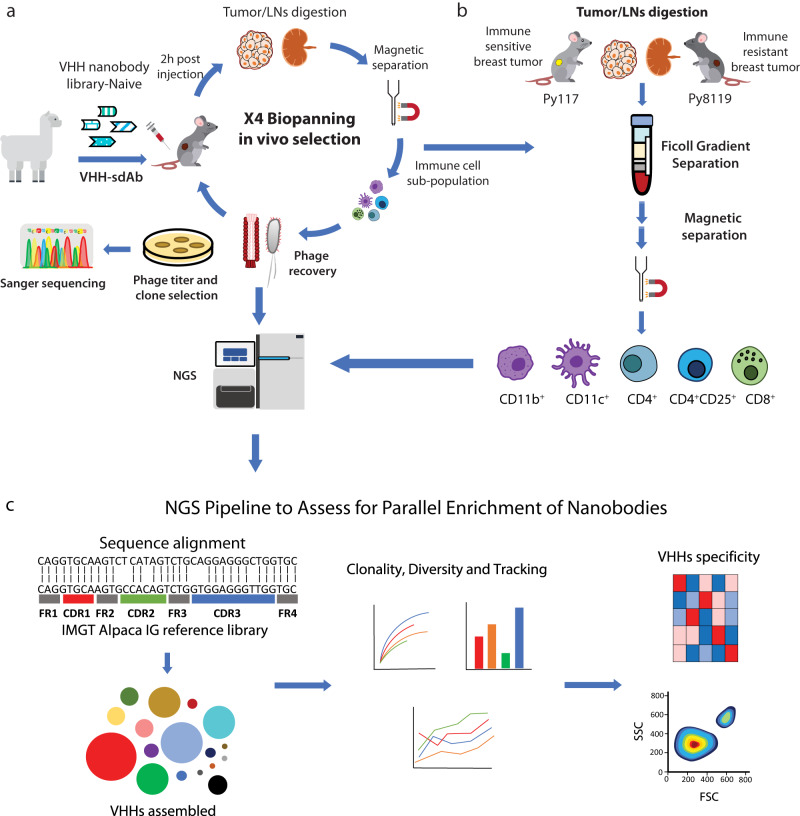
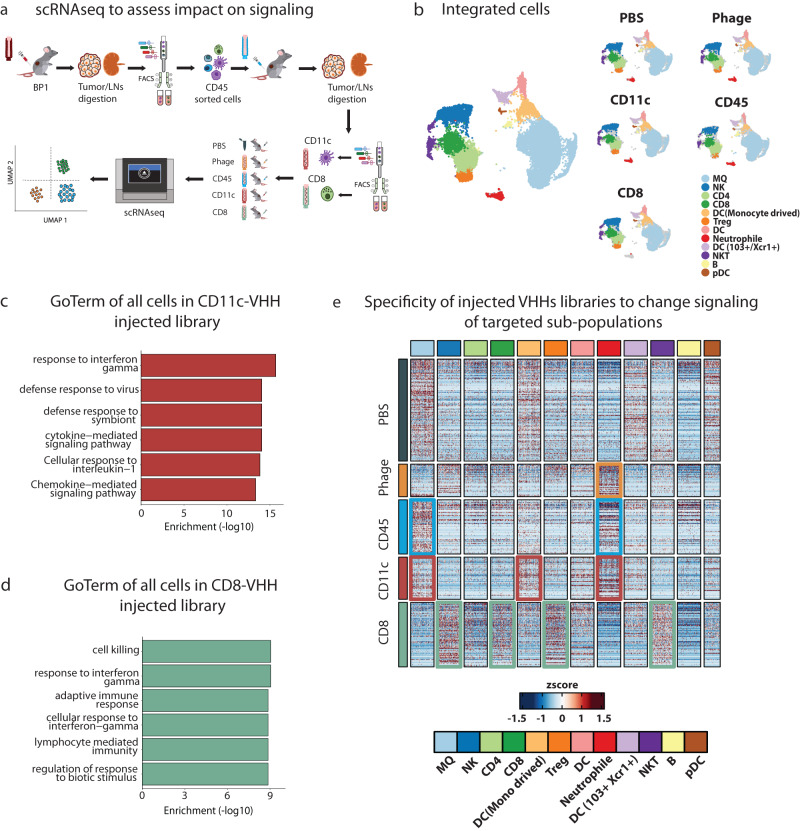
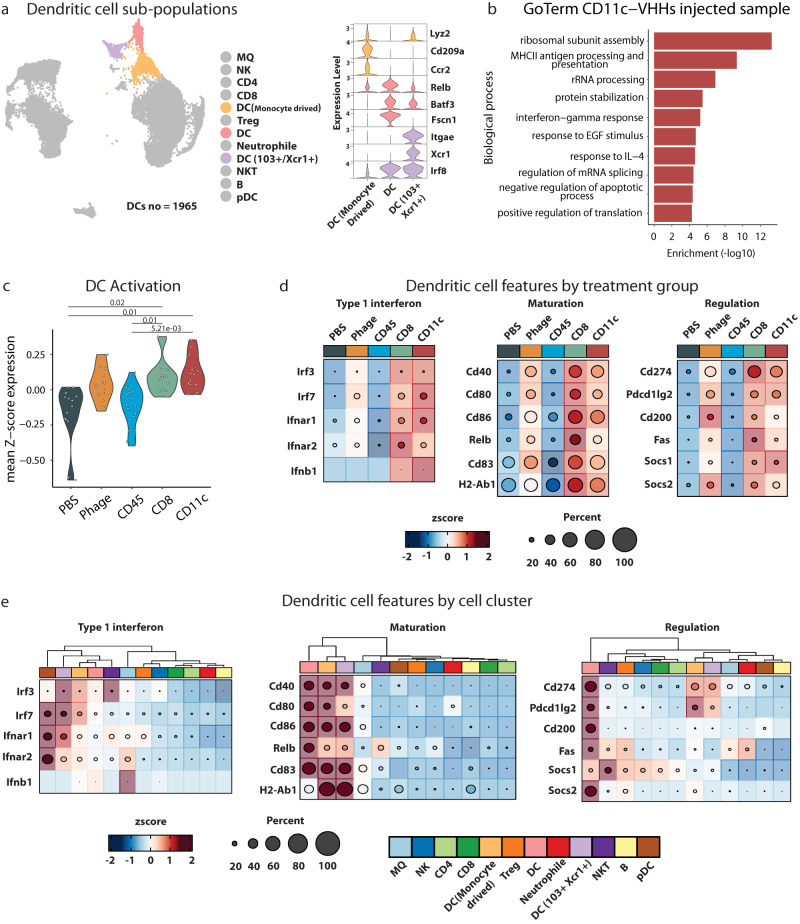
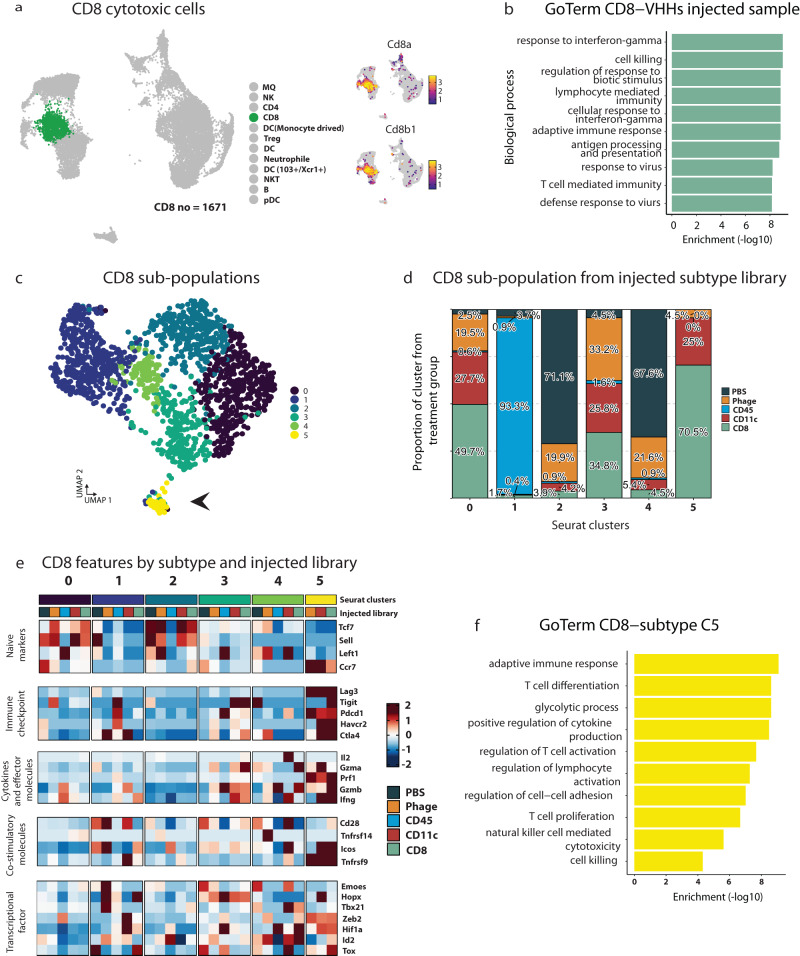
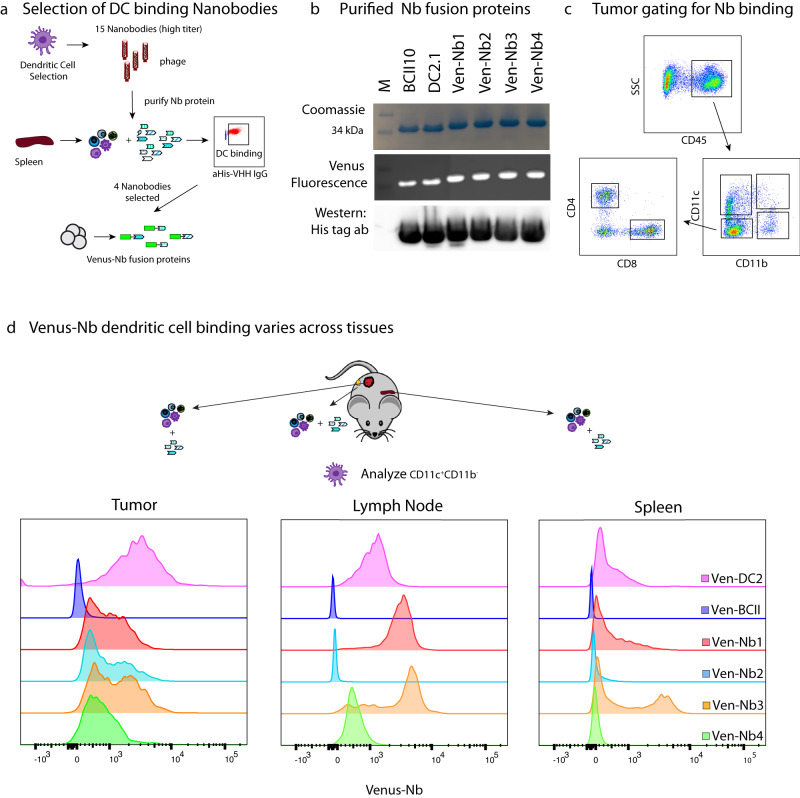
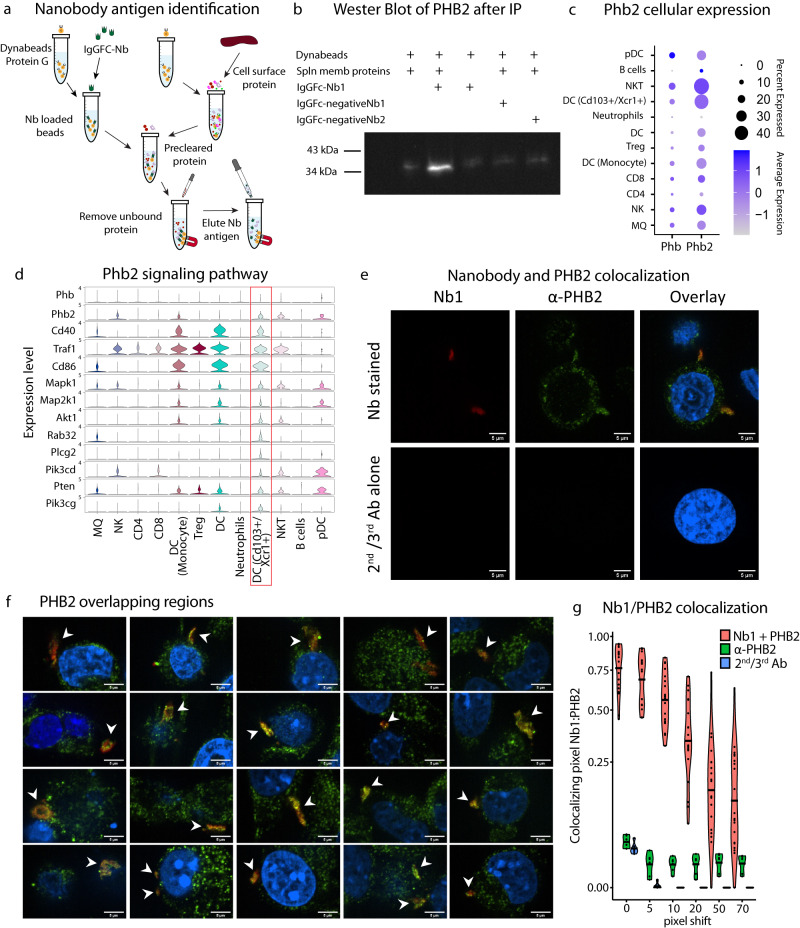
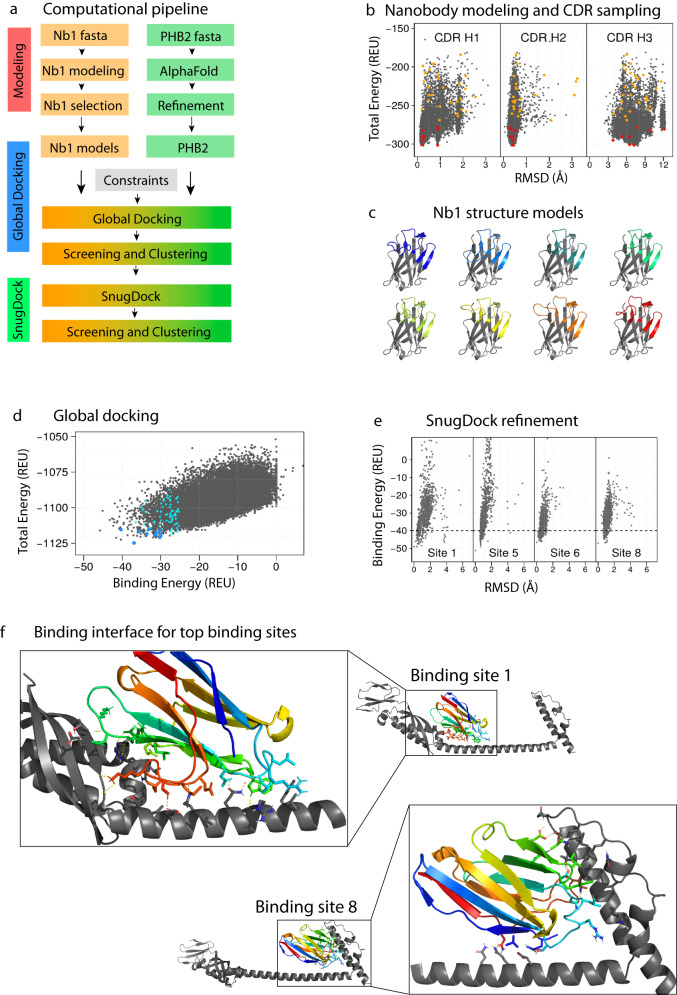
In the rapidly advancing field of synthetic biology, there exists a critical need for technology to discover targeting moieties for therapeutic biologics. Here we present INSPIRE-seq, an approach that utilizes a nanobody library and next-generation sequencing to identify nanobodies selected for complex environments. INSPIRE-seq enables the parallel enrichment of immune cell-binding nanobodies that penetrate the tumor microenvironment. Clone enrichment and specificity vary across immune cell subtypes in the tumor, lymph node, and spleen. INSPIRE-seq identifies a dendritic cell binding clone that binds PHB2. Single-cell RNA sequencing reveals a connection with cDC1s, and immunofluorescence confirms nanobody-PHB2 colocalization along cell membranes. Structural modeling and docking studies assist binding predictions and will guide nanobody selection. In this work, we demonstrate that INSPIRE-seq offers an unbiased approach to examine complex microenvironments and assist in the development of nanobodies, which could serve as active drugs, modified to become drugs, or used as targeting moieties.


Conflict of interest statement

The authors declare no competing interests.

Figures

Fig. 1
Fig. 1. In vivo biopanning for selection of VHH nanobodies that target the immune TME and assessment.
a In vivo biopanning schema of VHH-nanobody phage display harvesting tumor and draining LN analyzed by NGS and viral titer then amplified CD45+ cells for a total of four rounds. b Each immune cell sub-population was sorted from immune-sensitive (Py117) and immune resistant (Py8119) tumors and LNs via ficoll gradient followed by magnetic beads separation for each round, then samples were sequenced to evaluate selection and enrichment. c NGS analysis pipeline for each round of biopanning. Reads were aligned to Alpaca IG reference, all regions of VHHs CDRs were assembled, followed by clonality assessment, diversity assessment, and clone tracking for enrichment. Llama and mouse illustrations were adapted from https://www.svgrepo.com/svg/162/llama, https://creazilla.com/nodes/7772730-mouse-clipart under creative commons license (CC0).
Fig. 2
Fig. 2. Diversity and enrichment across in vivo biopanning to validate the approach.
a VHH alignment showing the diversity in CDR1, CDR2 and CDR3 regions. b Frequencies of CDR3 amino acid length in the library, Py117 and Py8119 samples demonstrate an equal distribution across the samples with a median length of 18 aa. Top clone proportion (c) and rare clonal proportion (d) showing summary proportion of VHHs with specific indices and counts in Py117 and Py8119 tumor samples from BP0 to BP4. e Rarefication curve assessed the diversity of BP1 to BP4 in Py117 and Py8119 tumor samples through extrapolation and subsampling showing the reduction in diversity after BP1. f Percentage of unique VHH numbers in tumor samples of Py117 and Py8119.
Fig. 3
Fig. 3. Selection and evaluation of nanobodies developed by in vivo biopanning.
Tracking Top VHHs either in BP0 towards BP4 (a) or in BP4 backward to BP0 (b) demonstrates the biological enrichment of the biopanning process in vivo. c Distribution of VHHs’ density after biopanning, where titration followed by Sanger sequencing theoretically provides the most abundant clones, such as the top 25%. and NGS allows for deeper assessment of biopanning with a boarder range of assessment at a multiplexed scale. d Experimental distribution of abundance by density of all enriched clones in BP3 and BP4 identified by NGS only or clones also identified by Sanger showing deeper identification of enriched clones where Sanger identified the most abundant clones. e Log2 counts of clones identified by NGS in BP3-BP4 from all cell sub-types (n = 2087 clones) in compared to clones selected for Sanger sequencing clones (n = 156 clones), median represented by red line. f Relative enrichment of VHHs in each row across the five cell subtypes from BP3-4 that identify VHHs with cell type specificity.
Fig. 4
Fig. 4. ScRNAseq to explore functional changes introduced by VHHs in target immune cells.
a Schema for scRNAseq experimental outline to determine functional changes in target immune cell populations. b Cell populations across all samples showing harmonized and integrated samples (left), cells clustered by sample type showing comparable distribution of cell populations regardless of the samples (right). c, d GO term enrichment of upregulated genes in CD11c-VHHs and CD8-VHHs library injected mice respectively were performed using enricher package, significance was determined by Fisher exact test (−log10) of adjusted p value by benjamini–hochberg (BH) method. e Heatmap showing differential gene expression analysis (DGE) between samples (rows) and their expression distribution across cell populations (columns). Colored boxes highlighted cell sub-population that showed most DEGs in the respected sample (rows). For example, in CD11c sample most altered cell populations were DC (Monocytes derived) and Neutrophil (red boxes). In the CD8 sample, the most altered cell populations were NK, CD8, Treg, and NKT (green boxes). Source data are provided as a Source Data file. Mouse illustration was adapted https://creazilla.com/nodes/7772730-mouse-clipart under creative commons license (CC0).
Fig. 5
Fig. 5. Transcriptional changes introduced by CD11c VHHs injected library.
a DC populations and their example of canonical markers used in the annotation process. b GO term enrichment of upregulated genes in CD11c-VHHs library injected mice in DCs subpopulations were performed using enricher package, significance was determined by Fisher exact test (−log10) of adjusted p value by benjamini-hochberg (BH) method. c Mean expression of DC activation GO term genes identified in VHHs library injected mice (F Welch test with Holm adjusted p value). d, e Heatmap showing Type 1 interferon, maturation, and regulations genes expression in all samples and cell subpopulations respectively. Source data are provided as a Source Data file.
Fig. 6
Fig. 6. Transcriptional changes introduced by CD8 VHHs injected library.
a CD8 T cells and expression of their canonical markers. b GO term enrichment of upregulated genes in CD8-VHHs library injected mice in CD8 T cells were performed using enricher package, significance was determined by Fisher exact test (−log10) of adjusted p value by benjamini-hochberg (BH) method. c UMAP plot showing the CD8 sub-populations by sub-clustering CD8 T cells. Black arrows refer to sub-population cluster 5. d Histogram showing relative distribution of CD8+ T cell sub-populations based upon sample type. e Heatmap showing naïve markers, immune checkpoint, cytokines and effector molecules, co-stimulatory molecules, and transcriptional factor genes expression in CD8 T cells sub-populations and injected libraries. f GO term enrichment of upregulated genes in CD8-VHHs library injected mice in CD8 T cells cluster 5, enrichment was performed using enricher package, significance was determined by Fisher exact test (−log10) of adjusted p value by benjamini-hochberg (BH) method. Source data are provided as a Source Data file.
Fig. 7
Fig. 7. DC-VHHs selection and differential binding of VHHs across immune cells and tissues.
a Pipeline to select VHHs that preferably bind to dendritic cells and then generate Venus-VHH fusions. b Purified fusion protein by ÄKTA pure detected by Coomassie blue staining, Venus fluorescence, and Immunoblot using α−His antibody (representative of 3 independent experiments). c Flowcytometry gating strategy to select cells sub-populations CD11c+, CD11b+, CD8+, and CD4+. d Detection of the selected Venus fusion DC-VHHs, BCII10-VHH, and DC2.1-VHH in the tumor, spleen, and LN of Py117 tumor-paired mice (representative experiment) from three independents experiments. Source data are provided as a Source Data file. Mouse illustration was adapted https://creazilla.com/nodes/19275-cartoon-grey-mouse-clipart under creative commons license (CC0).
Fig. 8
Fig. 8. Identification and verification of Nb1 binding to Phb2.
a Nanobody pull-down and antigen identification pipeline using immunoprecipitation. b Western blot of α-PHB2 protein after pulled-down by Nb-FC fusion protein (IgGFC-Nb1) (representative of 3 independent experiments) c Dot plot for Phb and Phb2 expression across immune cell populations. d Violin plot showing the Phb2 signaling pathway across immune cells populations, revealing the greatest expression in the DC CD103+/Xcr1+ population (red box). e Representative confocal images from two independent experiments of Nb1 and PHB2 colocalization in MC38 cells with the upper row Nb1/α-PHB2 stained and lower row secondary and tertiary antibody alone control. The first column is the nanobody channel red, then α-PHB2 green, and the overlay with Höchst 33342 blue (scale 5 μm). f Representative confocal images from two independent experiments of Nb1 colocalization with membranous regions expressing PHB2 from 20 different cells (white arrows). g Mander’s colocalization coefficient M1 of Nb1 pixel overlapping PHB2 pixel (mean represented by black line) for Nb1 and α-PHB2 (n = 20 images), α-PHB2 antibody alone (n = 6) and 2nd/3rd antibodies alone (n = 6) from two independent experiments with six incrementing pixel shift configurations. Source data are provided as a Source Data file.
Fig. 9
Fig. 9. Computational modeling for docking predictions of Nb1 to PHB2.
a Computational protocol for modeling and docking using Rosetta and AlphaFold. b Modeling of Nb1: Rosetta total energy vs. RMSD for each individual CDR. The best representative model for each cluster is shown in orange circles, and the top eight are shown in red. c Cartoon representation of the eight selected Nb1 candidates for computational docking. d Rosetta total energy vs. Rosetta binding energy after global docking. The best representative model for each cluster is shown in cyan circles, and the top 11 are shown in blue circles. e SnugDock binding energy vs RMSD results for binding sites 1, 5, 6 and 8 (full results in Supplementary Fig. 7e). f Cartoon representation of binding sites 1 (left) and 8 (right). PHB2 is shown in gray, while Nb1 is shown with rainbow color. The residues forming critical interactions are shown as sticks, and hydrogen bonds are shown as yellow dash lines.

References

    1. Hegde PS, Chen DS. Top 10 challenges in cancer immunotherapy. Immunity. 2020;52:17–35. doi: 10.1016/j.immuni.2019.12.011. - DOI - PubMed
    1. Murciano-Goroff YR, Warner AB, Wolchok JD. The future of cancer immunotherapy: microenvironment-targeting combinations. Cell Res. 2020;30:507–519. doi: 10.1038/s41422-020-0337-2. - DOI - PMC - PubMed
    1. Zhang Y, Zhang Z. The history and advances in cancer immunotherapy: understanding the characteristics of tumor-infiltrating immune cells and their therapeutic implications. Cell Mol. Immunol. 2020;17:807–821. doi: 10.1038/s41423-020-0488-6. - DOI - PMC - PubMed
    1. Sodir, N. M., et al. MYC instructs and maintains pancreatic adenocarcinoma phenotype. Cancer Discov.10, 588–607 (2020). - PubMed
    1. Kortlever RM, et al. Myc cooperates with Ras by programming inflammation and immune suppression. Cell. 2017;171:1301–1315 e1314. doi: 10.1016/j.cell.2017.11.013. - DOI - PMC - PubMed

Publication types

MeSH terms

Associated data