. 2023 Nov 17;14(1):7476.
doi: 10.1038/s41467-023-43292-1.

GDF11 slows excitatory neuronal senescence and brain ageing by repressing p21

Affiliations

GDF11 slows excitatory neuronal senescence and brain ageing by repressing p21

Di-Xian Wang et al. Nat Commun. .

Abstract

As a major neuron type in the brain, the excitatory neuron (EN) regulates the lifespan in C. elegans. How the EN acquires senescence, however, is unknown. Here, we show that growth differentiation factor 11 (GDF11) is predominantly expressed in the EN in the adult mouse, marmoset and human brain. In mice, selective knock-out of GDF11 in the post-mitotic EN shapes the brain ageing-related transcriptional profile, induces EN senescence and hyperexcitability, prunes their dendrites, impedes their synaptic input, impairs object recognition memory and shortens the lifespan, establishing a functional link between GDF11, brain ageing and cognition. In vitro GDF11 deletion causes cellular senescence in Neuro-2a cells. Mechanistically, GDF11 deletion induces neuronal senescence via Smad2-induced transcription of the pro-senescence factor p21. This work indicates that endogenous GDF11 acts as a brake on EN senescence and brain ageing.


Conflict of interest statement

The authors declare no competing interests.

Figures

Fig. 1
Fig. 1. GDF11 is predominantly expressed in the EN in the adult mouse, marmoset and human brain.
ae Schematic diagrams of the brain of mouse (a), and the red box in the cerebral cortex shows the location where the images were taken. Immunofluorescence double labelling (b, c, 2 double-labelled neurons are indicated as examples in (b, c)) and quantification (d, e, n = 6 images from 3 mice) of GDF11 (green, b) and NeuN (red, b) or GDF11 (green, c) and CaMKIIα (red, c) in the cerebral cortices of the mice aged 3 months (3 M). f Representative images of immuno-electron microscopy (Immuno-EM) of GDF11 labelled with nanogold particles (there are many GDF11 labelled black dots and only some examples are indicated with red arrows) in the cerebral cortex of the mice aged 3 M (n = 3 mice). Nuc, nucleus; Den, dendrite. g Immunofluorescence double labelling of GDF11 (green, arrow) and GABA (red, double arrowheads) (n = 3 mice). h Immunofluorescence double labelling of GDF11 (green) together with Olig2 (red, left), GFAP (red, middle), Iba1 (red, middle) in the cerebral cortex (Cx) and Dcx (red, right) in the dentate gyrus (DG) of the mice aged 3 M (n = 3 mice). The GDF11 negative cells are indicated by arrows in (h). i Schematic diagrams of the brain of the marmoset (one aged 62 M and another aged 70 M), and the red box in the cerebral cortex shows the location of the images (n = 2 marmosets). jo Immunofluorescence double labelling (j, m, n, o) and quantification (k, l) of GDF11 (green) together with CaMKIIα (red, j, k, l, 2 double-labelled neurons are indicated as examples in (j); n = 8 images from 2 marmosets) or GABA (red, m), Olig2 (red, n) or GFAP (red, o). The GDF11 negative cells are indicated by arrows in (m, n, q). p Schematic diagrams of the human brain. The red box in the cerebral cortex shows the location of the images. qs Immunofluorescence double labelling (q, male patient aged 24 years (Y) and female patient aged 23Y diagnosed with intractable epilepsy and the focus of epileptic cortices had to be removed surgically) and quantification (r, s, n = 4 patients, male patient aged 23Y, male patient aged 52Y, female patient aged 54Y and male patient aged 60Y suffered brain injury) of GDF11 (green) together with CaMKIIα (red) in the cerebral cortex of patients and 2 double-labelled neurons are indicated by arrows in (q). t Immunofluorescence double labelling of GDF11 (green) together with GABA (red, left), Olig2 (red, middle), GFAP (red, middle) and Iba1 (red, right) in the cerebral cortex of patients (n = 4 patients). The GDF11 negative cells are indicated by arrows in (t). Scale bars, as shown on the images, 30 μm (b, c), 250 nm (f), 10 μm (g), 40 μm (j, m, n, o), 20 μm (h, q, t). Data are presented as mean ± SEM. Source data are provided with this paper.
Fig. 2
Fig. 2. Selective deletion of GDF11 in the EN of the CNS accelerates their own senescence preferentially in the insular, piriform and cingulate cortices and shortens lifespan in mice.
a Quantification by qPCR of the relative mRNA of GDF11 in the brain of the WT mice aged 3 M, 9 M or 36 M (n = 3 mice/group). b Immunofluorescence double labelling of GDF11 (green) and CaMKIIα (red) in the cerebral cortices of the mice aged 3 M, 9 M and 36 M. One GDF11+CaMKIIα+ neuron is indicated by an arrow as an example per group. c Quantification of the average gray value of GDF11 in GDF11+CaMKIIα+ neurons in the cerebral cortices of the mice aged 3 M, 9 M and 36 M (3 M, n = 140; 9 M, n = 160; 36 M, n = 232 cells). dg Representative images (d) and quantification (eg) of the SA-β-Gal+ cells in layers 4 and 5 (d, up, and e, the dashed lines indicate the borders of layers 4 and 5, WT, n = 6; GDF11f/f, n = 8; GDF11cKO, n = 6), layer 6a (d, middle, and f layer 6a is the deep layer cortex near the corpus callosum (CC), WT, n = 8; GDF11f/f, n = 8; GDF11cKO, n = 8) of the insular cortex (IC), and layers 2 and 3 of the piriform cortex (d, down, and g the dashed lines indicate the borders of layers 2 and 3, WT, n = 8; GDF11f/f, n = 10; GDF11cKO, n = 10) of GDF11cKO or GDF11f/f or WT mice aged 10 M. h–j Representative images (h) and quantification of the SA-β-Gal+ cells in the cingulate cortex of GDF11cKO or GDF11f/f mice aged 10 M (i, GDF11f/f, n = 8; GDF11cKO, n = 6) and 17 M (j, GDF11f/f, n = 3; GDF11cKO, n = 4). Examples of the SA-β-Gal+ cells are indicated by double arrowheads in (d, h). k A schematic summary on the distribution of the SA-β-Gal+ cells in the brain of GDF11cKO or GDF11f/f mice aged 10 M and 17 M. l Representative images of double labelling of SA-β-Gal staining (blue) and immunofluorescence of NeuN (fluorescence shown in white) in the insular cortex of GDF11cKO or GDF11f/f mice aged 10 M. Examples of the SA-β-Gal+NeuN+ neurons are indicated by red arrowheads. m Representative images of double labelling of SA-β-Gal staining (blue) and immunohistochemical staining of CaMKIIα (brown) in the cerebral cortices of GDF11cKO or GDF11f/f mice aged 10 M. Examples of the SA-β-Gal+CaMKIIα+ ENs are indicated by black arrows. n Survival curves of GDF11f/f (n = 35 mice) and GDF11cKO mice (n = 15 mice) which died naturally, and log-rank test P value was shown. Median survival is 25 months in GDF11f/f mice and 22.8 months in GDF11cKO mice. Scale bars, as shown on the images, 20 μm (b, d up, m), 40 μm (d, middle and down), 50 μm (h) and 10 μm (l). Data are presented as mean ± SEM. *P < 0.05, **P < 0.01. a (F (2, 6) = 6.672, e 0.0298; 3 M versus 36 M, P = 0.0270), c (F (2529) = 18.77, P < 0.0001; 3 M versus 9 M, P < 0.0001; 3 M versus 36 M, P < 0.0001; 9 M versus 36 M, P = 0.5477), e (F (2, 17) = 20.14, P < 0.0001; WT versus GDF11f/f, P = 0.9950; GDF11f/f, versus GDF11cKO, P < 0.0001), f (F (2, 21) = 4.825, P = 0.0189; WT versus GDF11f/f, P = 0.9963; GDF11f/f, versus GDF11cKO, P = 0.0322) and g (F (2, 25) = 11.61, P = 0.0003; WT versus GDF11f/f, P = 0.4738; GDF11f/f, versus GDF11cKO, P = 0.0002). One-way ANOVA with post Tukey multiple comparisons test. i (P = 0.3427) and j (P = 0.0280), unpaired two-tailed t test. Source data are provided with this paper.
Fig. 3
Fig. 3. In vitro loss of GDF11 induces cellular senescence phenotypes and senescence-associated transcriptional programs.
a Immunofluorescence image of NeuN (green) in Neuro-2a cells (n = 6 fields). Scale bar, 40 μm. b PCR of the cell genomes verified successful knockout of the targeted part of exon 2 of GDF11 in Neuro-2a cells (GDF11KO) (n = 3 clones of GDF11KO cells). c Verification of GDF11 knockout by comparing the mRNA enrichment tracks of GDF11 between GDF11KO and WT Neuro2a cells by bulk RNA-seq. d Quantification of the relative mRNA of GDF11 in the GDF11KO and WT Neuro-2a cells by qPCR (n = 3 biological repeats/group). e, f Western blot (e) and Immunofluorescence of GDF11 (f, scale bar, 40 μm) in GDF11KO or WT Neuro-2a cells (n = 3 biological repeats/ group). g, h Representative images (g) and quantification (h, GDF11KO, n = 13; WT, n = 12 fields) of the SA-β-Gal+ cells (blue) in GDF11KO and WT Neuro-2a cells. All cells are indicated by black stars, and a few representative SA-β-Gal+ cells are indicated by black arrows. Scale bar, 50 μm. i Quantification of SA-β-Gal+ cells in 3 independent clones of GDF11KO and WT Neuro-2a cells (GDF11KO, n = 3; WT, n = 3 clones). j, k Representative images (j, DAPI, blue) and quantification (k, GDF11KO, n = 234 cells; WT, n = 211 cells) of the nuclei of GDF11KO and WT Neuro-2a cells. Scale bar, 3 μm. l Volcano plot of upregulated (706) and downregulated (411) genes caused by deletion of GDF11 in Neuro-2a cells and revealed by bulk-RNA-seq (n = 3 clones). m Bulk RNA-seq gene ontology (GO) analysis reveals the top 10 enriched biological processes downregulated by GDF11 deletion in Neuro-2a cells, and the logarithm base 2 of the fold change below −1 was included. n Heatmap of downregulated (11) or upregulated (1) genes involved in “lipid metabolic process” listed in m or “lipid droplets” caused by deletion of GDF11 in Neuro-2a cells, and the logarithm base 2 of the fold change above 1 or below −1 was included. o Representative images of transmission electron microscope (TEM) show the ultrastructure features of GDF11KO and WT Neuro-2a cells. Cell nucleus (Nuc), lipofuscin (light blue arrows), neurosecretory granules (red double arrowheads) and mitochondrion (brown arrowheads) are indicated as examples. Scale bars, 2 μm. pr Representative TEM images (p, lipofuscins, light blue arrows) and quantification of the number (Q, GDF11KO, n = 20 cells; WT, n = 20 cells) or the area (r, GDF11KO, n = 141; WT, n = 85 lipofuscins) of lipofuscins in the GDF11KO and WT Neuro-2a cells. Scale bars, 500 nm. su Representative TEM images (s, mitochondrion, brown arrowheads; neurosecretory granules, red double arrowheads) and quantification of the number (t, GDF11KO, n = 10 cells; WT, n = 10 cells) or the area (u, GDF11KO, n = 299; WT, n = 254 mitochondria) of the mitochondria of the GDF11KO and WT Neuro-2a cells. Scale bars, 500 nm. v Quantification of the number of neurosecretory granules (GDF11KO, n = 8 cells; WT, n = 10 cells) of the GDF11KO and WT Neuro-2a cells. Data are presented as mean ± SEM. *P < 0.05, **P < 0.01 and “ns” indicates not significant, d (P < 0.0001), h (P < 0.0001), i (P = 0.0024), k (P = 0.0030), q (P = 0.0002), r (P = 0.0274), t (P = 0.8009), u (P < 0.0001), v (P = 0.0047), unpaired two-tailed t test. Source data are provided with this paper.
Fig. 4
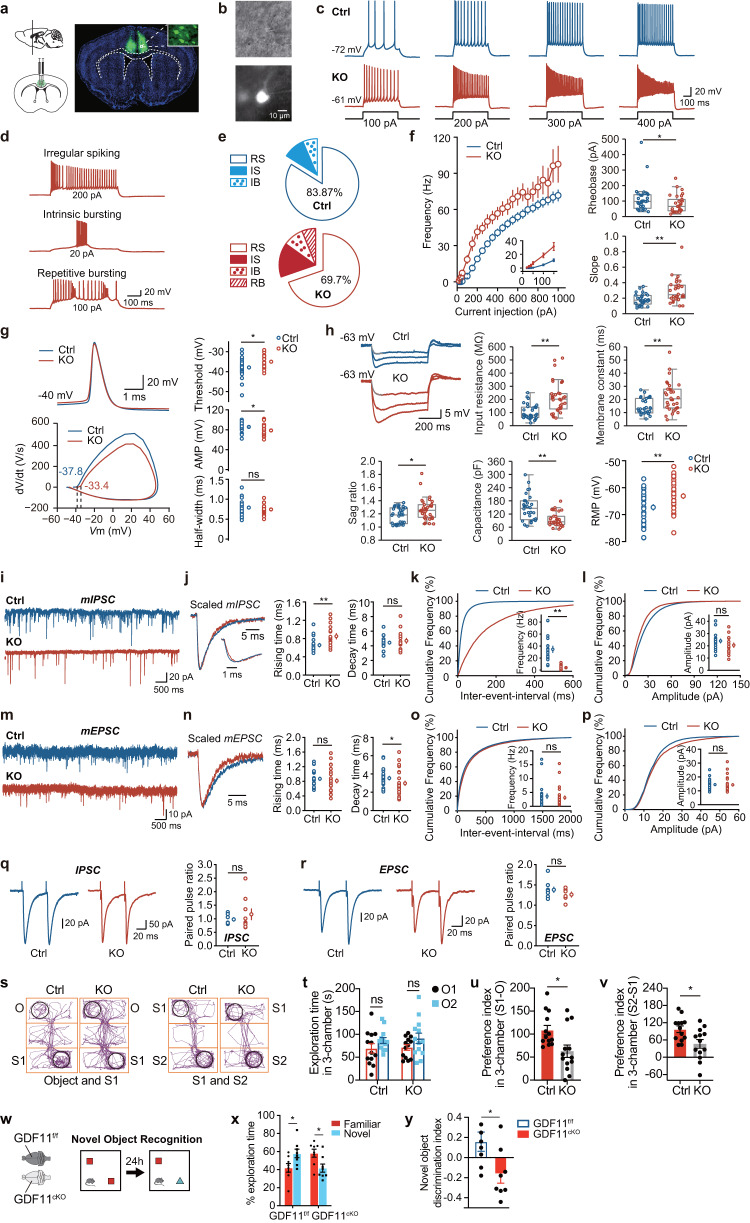
Fig. 4. Selective deletion of GDF11 in the EN causes their own hyperexcitability and deteriorates social cognition and object recognition memory in mice.
a Schematic diagrams (left) and representative images (right) of the cingulate gyrus 2 (Cg2), in the prefrontal cortex of GDF11f/f mice aged 4M-5M, where bilateral focal injection of AAV9-CaMKIIα-Cre-P2A-GFP virus (KO) or AAV9-CaMKIIα-GFP virus (Ctrl) was received at age of 2–3 M and survived for two more months. b Infrared-differential interference contrast (IR-DIC) image (top) and GFP fluorescent image (bottom) of an example of GFP+ EN which is undergoing whole-cell patch clamp recording (n = 64 cells from six mice). c Representative whole-cell recordings in brain slice of a control EN (in Cg2 of GDF11f/f mice, Ctrl, blue) and a GDF11 deleted-EN (in Cg2 of fGDF11cKO mice, KO, red) show the firing of action potentials (AP) in response to a series of step current injections. d Examples show typical firing patterns of GFP+ EN of fGDF11cKO mice. e Pie graphs show the percentage of GFP+ EN with diverse firing patterns (RS, regular spiking; IS, irregular spiking; IB, intrinsic bursting; RB, repetitive bursting) in WT or KO mice. f Left, plots of the AP frequency as a function of injected currents. Curves are color coded (Ctrl, blue, n = 31 cells from three mice; KO, red, n = 33 cells from three mice). Inset shows the beginning of the curve. Right, plots of the rheobase (Ctrl: 113 ± 16 vs. KO: 81 ± 10 pA, P = 0.049) and slope (Ctrl: 0.18 ± 0.01 vs. KO: 0.30 ± 0.03, P = 0.000) in the two groups (Ctrl, n = 31 cells from three mice; KO, n = 30 cells from three mice). g Left, representative AP waveforms (top) and phase plots (bottom) from Ctrl (blue) or KO (red) group. Right, plots of the AP threshold (Ctrl: −37.9 ± 0.8 vs. KO: −35.0 ± 0.7 mV, P = 0.014), amplitude (AMP) (Ctrl: 85.8 ± 1.6 vs. KO: 78.6 ± 2.2 mV, P = 0.010) and half-width (Ctrl: 0.79 ± 0.03 vs. KO: 0.74 ± 0.03 ms, P = 0.30) in the two groups (Ctrl, n = 29 cells from three mice; KO, n = 24 cells from three mice). h Left-top, representative membrane potential responses to negative current pulses from Ctrl (blue) or KO (red) groups. Plots of the input resistance (Ctrl: 104 ± 10 vs. KO: 214 ± 21 MΩ, P = 0.000), membrane constant (Ctrl: 14.4 ± 1.1 vs. KO: 22.1 ± 2.0 ms, P = 0.003), Sag ratio (Ctrl: 1.18 ± 0.02 vs. KO: 1.27 ± 0.03, P = 0.033), membrane capacitance (Ctrl: 147 ± 11 vs. KO: 95 ± 5 pF, P = 0.000) and RMP (Ctrl: −67.3 ± 1.0 vs. KO: −63.1 ± 0.9 mV, P = 0.004) in the two groups (Ctrl, n = 31 cells from three mice; KO, n = 33 cells from three mice). i Representative whole-cell recordings of mIPSC from the EN in GDF11f/f mice (Ctrl, blue) and fGDF11cKO mice (KO, red). j Left, scaled mIPSC examples in the two groups. Right, plots of rising time (Ctrl: 0.65 ± 0.04 vs. KO: 0.85 ± 0.06 ms, P = 0.005) and decay time (Ctrl: 4.44 ± 0.21 vs. KO: 4.69 ± 0.34 ms, P = 0.53) of mIPSCs in the two groups (Ctrl, n = 18 cells from four mice; KO, n = 16 cells from four mice). k, l Cumulative frequency curve of the inter-event-interval (k) and amplitude (l) of mIPSCs. Insets show the group plots of mIPSC frequency (k, Ctrl: 34.6 ± 5.2 vs. KO: 4.0 ± 0.9 Hz, P = 0.000) and amplitude (l, Ctrl: 24.0 ± 1.6 vs. KO: 20.5 ± 1.8 pA, P = 0.16). mp Recordings of mEPSCs (Ctrl, n = 24 cells from four mice; KO, n = 28 cells from 4 mice) and similar plots as the mIPSCs shown above. Rising time (n, ctrl: 0.87 ± 0.05 vs. KO: 0.81 ± 0.06 ms, P = 0.46); Decay time (n, ctrl: 3.54 ± 0.20 vs. KO: 2.98 ± 0.24 ms, P = 0.041); Frequency (o, Ctrl: 3.66 ± 0.84 vs. KO: 3.13 ± 0.65 Hz, p = 0.82); Amplitude (p, Ctrl: 14.5 ± 0.8 vs. KO: 14.3 ± 0.9 pA, P = 0.33). q, r Representative traces showing IPSC (q, left) or EPSC (r, left) evoked by extracellular electric stimulations for the comparison of paired-pulse ratio (PPR) in GDF11f/f mice (Ctrl, blue) and fGDF11cKO mice (KO, red). Group plots of PPR for IPSC (q, right, Ctrl, n = 7 cells from 3 mice: 0.98 ± 0.07 vs. KO, n = 9 cells from three mice: 1.16 ± 0.20, P = 0.92) and EPSC (r, right, Ctrl, n = 9 cells from 3 mice: 1.38 ± 0.07 vs. KO, n = 6 cells from three mice: 1.26 ± 0.06, P = 0.24). s Track diagrams in the 3-chamber test (3CT) between the fGDF11cKO (KO) and GDF11f/f (Ctrl) mice aged 4–5 M. O object, S1 stranger mouse, S2 new stranger mouse. t Quantification of the exploration time in 3CT (KO, n = 13; Ctrl, n = 13 mice) on objects between the fGDF11cKO (KO) and GDF11f/f (Ctrl) mice aged 4–5 M. O1, object 1; O2, object 2. u Quantification of the preference index (S1-O) between the S1 and object in the KO and Ctrl groups (KO, n = 13; Ctrl, n = 13 mice). v Quantification of the preference index (S2-S1) between the S2 and S1 in the KO and Ctrl groups (KO, n = 13; Ctrl, n = 13 mice). w Schematic diagram of the novel object recognition test (NORT) between the GDF11cKO and GDF11f/f mice aged 10 M. Red squares indicate the familiar toy while blue triangle indicates a novel toy. x Quantification of the percentage of exploration time (GDF11cKO, n = 9; GDF11f/f, n = 6 mice) on the familiar or a novel toy in the GDF11cKO and GDF11f/f mice aged 10 M. y Quantification of the novel object discrimination index ((novel-familiar)/(novel + familiar)) between the familiar or a novel toy in the GDF11cKO and GDF11f/f mice aged 10 M (GDF11cKO, n = 9; GDF11f/f, n = 6 mice). Data are presented as mean ± SEM. Whisker boxplots in (f, h) represent the median and interquartile range; whiskers represent 1.5× interquartile range. *P < 0.05, **P < 0.01 and “ns” represents not significant. f (Rheobase/Slope), h (Input resistance/Membrane constant/Sag ratio/Capacitance), j (Rising time), k, n (Decay time), oq Mann–Whitney U test. g, h (RMP), j (Decay time), l, n (Rising time), r, u (P = 0.0118), v (P = 0.0128), x (GDF11f/f: Familiar versus Novel, P = 0.0331; GDF11cKO: Familiar versus Novel, P = 0.0188) and y (P = 0.0254), unpaired two-tailed t test. t (Ctrl: O1 versus O2, P = 0.3210; KO: O1 versus O2, P = 0.2200), two-way ANOVA with post Sidak’s multiple comparisons test. Source data are provided with this paper.
Fig. 5
Fig. 5. In vivo selective deletion of GDF11 in the EN drives transcriptional programs associated with brain ageing and prunes and shortens their apical dendrites.
a Schematic diagrams of the cingulate gyrus 2 (Cg2), in the prefrontal cortex of GDF11f/f mice aged 4–5 M, where bilateral focal injection of AAV9-CaMKIIα-Cre-P2A-GFP virus (KO) or AAV9-CaMKIIα-GFP virus (Ctrl) was received at age of 2–3 M and survived for two more months. b UMAP of the clustered 16 cell types in snRNA-seq of the Cg2 in both 3 KO mice and 3 control mice (Ctrl) aged 4–5 M. c Violin chart of the relative mRNA of GDF11 by snRNA-seq in KO-GFP+, KO-GFP-, Ctrl-GFP+ or Ctrl-GFP- EN. The KO-EN were divided into KO-GFP+ and KO-GFP- groups whereas “Ctrl-EN” were divided into Ctrl-GFP+ and Ctrl-GFP groups. d and e, Heatmap shows the average transcription of downregulated and upregulated ageing-related genes (d) and SASP-related genes (e) in snRNA-seq of KO-GFP+, KO-GFP, Ctrl-GFP+ or Ctrl-GFP EN. f Confocal images (Left) and 3D-reconstruction (Right) of representative EN from Ctrl (Top) or KO (Bottom) groups. Dendrites and soma are presented in red, and axons are in blue. Scale bar, 50 μm. g, h Plots of the number of intersections of dendrites (g) in the two groups (Ctrl, n = 11 cells from three mice; KO, n = 11 cells from three mice) and the group data showing the number of total dendrite intersections (h, Ctrl: 448 ± 28 vs. KO: 346 ± 36, P = 0.028). ik Group data show the total number of apical dendrite intersections (i, Ctrl: 238 ± 17 vs. KO: 181 ± 18, P = 0.036), the total length of apical dendrites (j, Ctrl: 3.77 ± 0.28 vs. KO: 2.83 ± 0.34 mm, P = 0.044), and the apical branch orders against the averaged dendrite length (k, branch order 1, Ctrl: 445 ± 28 vs. KO: 403 ± 22 μm, P = 0.26; branch order 2, Ctrl: 115 ± 3 vs. KO: 93 ± 8 μm, P = 0.017; order 3, Ctrl: 91 ± 4 vs. KO: 70 ± 6 μm, P = 0.007; branch order 4, Ctrl: 72 ± 6 vs. KO: 56 ± 7 μm, P = 0.12) in the two groups (Ctrl, n = 11 cells from three mice; KO, n = 11 cells from three mice). ln Group data comparing the number of total basal intersections (l, Ctrl: 207 ± 15 vs. KO: 162 ± 22, P = 0.11), total basal dendrite length (m, Ctrl: 2.73 ± 0.18 vs. KO: 2.16 ± 0.29 mm, P = 0.11) and the basal branch orders against the averaged dendrite length (n, branch order 1, Ctrl: 102 ± 4 vs. KO: 102 ± 8 μm, P = 0.98; branch order 2, Ctrl: 82 ± 3 vs. KO: 82 ± 9 μm, P = 0.32; order 3, Ctrl: 69 ± 8 vs. KO: 59 ± 2 μm, P = 0.25) in the two groups (Ctrl, n = 11 cells from three mice; KO, n = 11 cells from three mice). o, p Plots of the axon distance from soma against the number of intersections (o) in the two groups (Ctrl, n = 11 cells from three mice; KO, n = 11 cells from three mice). Group data show the number of total axon branches intersections (p, Ctrl: 239 ± 17 vs. KO: 190 ± 28, P = 0.15). q Confocal examples of dendritic spines (red arrows indicate the big mushroom spines while yellow arrows point to small mushroom spines) in the two groups. Scale bar, 5 μm. r, s Group data show total spine density per 10 μm (r, Ctrl: 6.28 ± 0.23 vs. KO: 1.61 ± 0.13/10 μm, P = 0.000) and mushroom spine diameter (s, Ctrl: 0.66 ± 0.01 vs. KO: 0.80 ± 0.02 μm, P = 0.000) in two groups (Ctrl, n = 68 dendrites from 16 cells; KO, n = 70 dendrites from 16 cells). t Plots of spine density against the mushroom spine diameter in the two groups (Ctrl, n = 16 cells from three mice; KO, n = 16 cells from three mice). u A schematic summary: GDF11 deletion results in hyperexcitability of the EN as reflected by an enhancement in their firing frequency (due to increased input resistance and elevated RMP) and a decrease in mIPSC frequency. In addition, GDF11 deletion in the EN prunes and shortens their apical dendrites, reduces their dendritic mushroom spine density while enlarges its size. Data are presented as mean ± SEM. *P < 0.05, **P < 0.01. h, i, j, k, l, m, n, p, unpaired two-tailed t test; r, s, Mann–Whitney U test. Source data are provided with this paper.
Fig. 6
Fig. 6. Loss of GDF11 upregulates p21 both in vivo and in vitro.
a, b SnRNA-seq GO analysis reveals the top ten enriched biological processes of upregulated (a) or downregulated (b) in the KO-GFP+ EN in comparison with the KO-GFP- EN, and the EN were obtained from the Cg2 of the “KO” mice and the “Ctrl” mice aged 4–5 M. c Volcano plot shows upregulated and downregulated DEGs in the KO-GFP+ EN in comparison with the Ctrl-GFP+ EN. Some of the top upregulated and downregulated genes were annotated. c, d FC fold change. P value was calculated using Wilcox test and adjusted for multiple testing using Benjamini–Hochberg correction. d Volcano plot shows upregulated and downregulated DEG in the KO-GFP+ EN in comparison with the KO-GFP- EN. Some of the top upregulated and downregulated genes were indicated. e UMAP visualization highlights the distribution and the transcription of Cdkn1a/p21 in the identified cell types in snRNA-seq. f Dot plot representing the frequency and average transcription of Cdkn1a/p21 in the identified cell types in snRNA-seq. g, h Relative mRNA of Cdkn1a/p21 (g) or p53 (h) among four types of EN: Ctrl-GFP-, Ctrl-GFP+, KO-GFP- and KO-GFP+ by snRNA-seq. i Heatmap of upregulated (10) and downregulated (6) genes involved in “cellular senescence” caused by deletion of GDF11 in Neuro-2a cells, and the logarithm base 2 of the fold change above 1 or below −1 was included. Data are presented as mean ± SEM. *P < 0.05, **P < 0.01 and “ns” indicates not significant. a, b Hypergeometric test with Benjamini and Hochberg (BH) correction. Source data are provided with this paper.
Fig. 7
Fig. 7. In vivo selective deletion of GDF11 in excitatory neurons induced their own senescence requires p21.
a, b Genetic strategy for generation of p21f/f mice (a) and CaMKIIα-Cre; GDF11f/f; p21f/f mice (b) to selectively delete both GDF11 and p21 in CaMKIIα+ neurons through Cre/Loxp system. cg Representative images (c) and quantification (dg) of the SA-β-Gal+ cells in the cingulate cortex (c, up, and d, n = 4 per group), layers 4 and 5 (c, middle, and e GDF11f/f, n = 4; GDF11cKO, n = 3; CaMKIIα-Cre; GDF11f/f;p21f/f, n = 5), layer 6a (c middle, and f layer 6a is the deep layer cortex near the corpus callosum (CC), GDF11f/f, n = 5; GDF11cKO, n = 4; CaMKIIα-Cre; GDF11f/f;p21f/f, n = 4) of the insular cortex (IC), and layers 2 and 3 of the piriform cortex (c down, and g the dashed lines indicate the borders of layers 2 and 3, GDF11f/f, n = 8; GDF11cKO, n = 4; CaMKIIα-Cre; GDF11f/f;p21f/f, n = 8) of CaMKIIα-Cre; GDF11f/f;p21f/f or GDF11cKO or GDF11f/f mice aged 17 M. Examples of the SA-β-Gal+ cells are indicated by double arrows. Scale bars, as shown on the images, 50 μm (c, up and middle) and 20 μm (c, middle and down). Data are presented as mean ± SEM. *P < 0.05, **P < 0.01. d (F (2, 9) = 72.52, P < 0.0001; GDF11f/f versus GDF11cKO, P = 0.0006; GDF11cKO versus CaMKIIα-Cre;GDF11f/f;p21f/f, P < 0.0001; GDF11f/f versus CaMKIIα-Cre;GDF11f/f;p21f/f, P = 0.0004), e (F (2, 9) = 78.16, P < 0.0001; GDF11f/f versus GDF11cKO, P = 0.0020; GDF11cKO versus CaMKIIα-Cre;GDF11f/f;p21f/f, P < 0.0001; GDF11f/f versus CaMKIIα-Cre;GDF11f/f;p21f/f, P < 0.0001), f (F (2, 10) = 49.87, P < 0.0001; GDF11f/f versus GDF11cKO, P < 0.0001; GDF11cKO versus CaMKIIα-Cre;GDF11f/f;p21f/f, P < 0.0001; GDF11f/f versus CaMKIIα-Cre;GDF11f/f;p21f/f, P = 0.0347) and g (F (2, 17) = 102.8, P < 0.0001; GDF11f/f versus GDF11cKO, P = 0.0227; GDF11cKO versus CaMKIIα-Cre;GDF11f/f;p21f/f, P < 0.0001; GDF11f/f versus CaMKIIα-Cre;GDF11f/f;p21f/f, P = 0.0001), One-way ANOVA with post Tukey multiple comparisons test. Source data are provided with this paper.
Fig. 8
Fig. 8. Loss of GDF11 upregulates pSmad2 and Smad3 and enhances Smad2 binding to the promoter of p21.
a Quantification by qPCR of the relative p21 mRNA in the GDF11KO and WT Neuro-2a cells (n = 3 clones). be Immunofluorescence representative images (b) and quantification of the number of p21+ cells per field (c, n = 5 fields/group), the proportion of p21+ cells (d, n = 6 fields/group) or the average gray value of p21 per cell (e, GDF11KO, n = 420 cells; WT, n = 280 cells) in the GDF11KO and WT Neuro-2a cells. Scale bar, 25 μm. Examples of the p21+ cells are indicated by double arrowheads. fh The same snRNA-seq data were used, as described in Fig. 5a. f Rank for regulons in the EN based on regulon specificity score (RSS). The EN were obtained from the Cg2 of the “KO” mice and the “Ctrl” mice aged 4–5 M. g Regulons activity analysis based on area under the curve (AUC) in the identified cell types in snRNA-seq of the “KO” mice and the “Ctrl” mice aged 4–5 M. The activity of regulon Smad3 (highlighted in red) is high in the EN. h Cytoscape network visualization of genes including GDF11, Cdkn1a (p21), Smad2, Smad3 (highlighted in red) and their transcription factors (TFs, yellow). im Representative images (i and l) and quantification by densitometry of western blot analysis of Smad2 (j), phosphorylated Smad2 (pSmad2, k) and Smad3 (m) in the total protein extracted from the GDF11KO and WT Neuro-2a cells (n = 3 biological repeats/group). n ChIP-qPCR assessment of the enrichment of Smad2 at the promoter of Cdkn1a/p21 in the GDF11KO and WT Neuro-2a cells (n = 3 biological repeats/group). o A proposed working model for loss of GDF11 on cellular senescence. Loss of GDF11 upregulates pSmad2, enhances nuclear entry of Smad2/3 tricomplex and then Smad2 binds to the promoter of p21 and promotes the pro-senescence factor p21 transcription, and eventually causes cellular senescence. Data are presented as mean ± SEM. *P < 0.05, **P < 0.01 and “ns” indicates not significant. a (P = 0.0037), c (P = 0.0033), d (P = 0.0157), e (P < 0.0001), j (P = 0.6648), k (P = 0.0040) and m (P = 0.0299), unpaired two-tailed t test. n (IgG: WT versus GDF11KO, P = 0.57; Smad2: WT versus GDF11KO, P < 0.001), two-way ANOVA with Sidak’s test. Source data are provided with this paper.
Fig. 9
Fig. 9. Schematic summary of the GDF11 effects on excitatory neuronal senescence and brain ageing.
Evidence of both in vitro (left) and in vivo (right) indicates that growth differentiation factor 11-Smad2/3-p21 pathway acts as a brake on excitatory neuronal senescence and brain ageing.

References

    1. Higgins-Chen AT, Thrush KL, Levine ME. Aging biomarkers and the brain. Semin. Cell Dev. Biol. 2021;116:180–193. doi: 10.1016/j.semcdb.2021.01.003. - DOI - PMC - PubMed
    1. Hou Y, et al. Ageing as a risk factor for neurodegenerative disease. Nat. Rev. Neurol. 2019;15:565–581. doi: 10.1038/s41582-019-0244-7. - DOI - PubMed
    1. Hernandez-Segura A, Nehme J, Demaria M. Hallmarks of cellular senescence. Trends Cell Biol. 2018;28:436–453. doi: 10.1016/j.tcb.2018.02.001. - DOI - PubMed
    1. Baker DJ, Petersen RC. Cellular senescence in brain aging and neurodegenerative diseases: evidence and perspectives. J. Clin. Investig. 2018;128:1208–1216. doi: 10.1172/JCI95145. - DOI - PMC - PubMed
    1. Jurk D, et al. Postmitotic neurons develop a p21-dependent senescence-like phenotype driven by a DNA damage response. Aging Cell. 2012;11:996–1004. doi: 10.1111/j.1474-9726.2012.00870.x. - DOI - PMC - PubMed

Publication types

Substances

Associated data

LinkOut - more resources