Review
. 2023 Dec:440:108899.
doi: 10.1016/j.heares.2023.108899. Epub 2023 Oct 30.

Individual similarities and differences in eye-movement-related eardrum oscillations (EMREOs)

Affiliations
Review

Individual similarities and differences in eye-movement-related eardrum oscillations (EMREOs)

Cynthia D King et al. Hear Res. 2023 Dec.

Abstract

We recently discovered a unique type of otoacoustic emission (OAE) time-locked to the onset (and offset) of saccadic eye movements and occurring in the absence of external sound (Gruters et al., 2018). How and why these eye-movement-related eardrum oscillations (EMREOs) are generated is unknown, with a role in visual-auditory integration being the likeliest candidate. Clues to both the drivers of EMREOs and their purpose can be gleaned by examining responses in normal hearing human subjects. Do EMREOs occur in all individuals with normal hearing? If so, what components of the response occur most consistently? Understanding which attributes of EMREOs are similar across participants and which show more variability will provide the groundwork for future comparisons with individuals with hearing abnormalities affecting the ear's various motor components. Here we report that in subjects with normal hearing thresholds and normal middle ear function, all ears show (a) measurable EMREOs (mean: 58.7 dB SPL; range 45-67 dB SPL for large contralateral saccades), (b) a phase reversal for contra- versus ipsilaterally-directed saccades, (c) a large peak in the signal occurring soon after saccade onset, (d) an additional large peak time-locked to saccade offset and (e) evidence that saccade duration is encoded in the signal. We interpret the attributes of EMREOs that are most consistent across subjects as the ones that are most likely to play an essential role in their function. The individual differences likely reflect normal variation in individuals' auditory system anatomy and physiology, much like traditional measures of auditory function such as auditory-evoked OAEs, tympanometry and auditory-evoked potentials. Future work will compare subjects with different types of auditory dysfunction to population data from normal hearing subjects. Overall, these findings provide important context for the widespread observations of visual- and eye-movement related signals found in cortical and subcortical auditory areas of the brain.


Figures

Figure 1.
Figure 1.
(a) Schematic of horizontal-vertical task and color schemes for subsquent presentation of results as a function of visual target locations. Subjects were asked to fixate on a center point on the screen (black dot) until it disappeared and a target (green dot) appeared. Subjects then saccaded to the target and held fixation until the target turned red, signaling the end of the trial. (b, c) The color code represents saccade direction to target locations. For vertical targets (b), the color code for saccade direction indicates either upward or downward movement and does not change between left and right ear recordings. For horizontal targets (c), the color code for saccade direction is relative to the ears, not to visual space. Contralateral targets are in the hemi-field opposite the ear canal recording and ipsilateral targets are in the same hemi-field as the ear canal recording. Data will be plotted according to this color scheme for Figures 4 and 5.
Figure 2.
Figure 2.
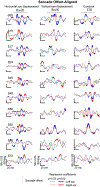
Coefficients of linear regression fits for individual subjects, aligned to saccade onset. Blue traces are left ear data and red traces are right ear data. Thick line segments indicate epochs of time in which the corresponding regression coefficient differed from zero (p<0.05). The time window for analysis of aggregate statistical significance as provided in Table 1 is marked by the horizontal black bar at the top of each column (−5 to 70 ms with respect to saccade onset). Y-axis units are standard deviations per degree (horizontal and vertical eye displacement columns) or simply standard deviations (“constant” column) and vary across panels as indicated by the calibration bars. See Supplementary Figure 1 for individual subject data plotted on the same graphs for comparison purposes.
Figure 3:
Figure 3:
Coefficients of linear regression fits to saccade-offset-aligned responses. Conventions same as Figure 2. The time window for evaluation of aggregate statistical significance of regression coefficients (Table 1) was defined as −25 to 50 ms with respect to saccade offset as denoted by a black bar at the top of each column. Thick lines indicate when the waveform differs significantly from zero (p<0.05). See Supplementary Figure 1 for individual subject data plotted on the same graphs for comparison purposes.
Figure 4.
Figure 4.
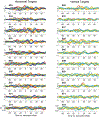
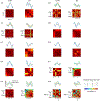
EMREOs recorded during saccades to horizontal targets show more consistent patterns within and across subjects compared to responses during saccades to vertical targets. Average microphone waveforms, z-scored and aligned to saccade onset, are shown for all subjects (y-axis units = standard deviation relative to baseline variation). Each waveform trace is a subject’s averaged microphone response to a single target (both ears combined; see Figure 1 for color code). Red-orange-yellow traces are responses during saccades to contralateral targets and indigo-blue-green traces are to ipsilateral targets. For horizontal targets, in the first 30 ms after saccade onset, every subject has the expected phase inversion with change in saccade direction and amplitude; latency and phase direction of peaks are aligned. In the 40 to 90 ms time window, which coincides with saccade offsets, there are peaks with latency shifts that appear to align to saccade duration. For vertical targets, no consistent pattern in waveform amplitude or latency can be discerned across subjects.
Figure 5:
Figure 5:
Similar to Figure 4 but aligned to saccade offset. Offset responses to horizontal saccade targets reveal patterns similar to those seen in onset responses but are not as well organized. A phase inversion of the response with change in saccade direction is seen in all subjects. The waveforms align with the first peak/trough around 5 ms and the second peak trough around 20 ms after saccade offset. The responses return to pre-saccade baseline levels by approximately 60 ms in all subjects. Vertical offset responses are quite variable across subjects and similarities in response patterns across subjects do not easily emerge.
Figure 6.
Figure 6.
Peak/trough amplitudes and latencies are more consistent across subjects during saccades to contralateral than ipsilateral targets. (a-b). Each trace is an individual subject’s averaged microphone response to the 18 degree contralateral (a) or ipsilateral (b) horizontal target location, aligned to saccade onset. Waveforms are more similar across subjects for contralateral targets than for ipsilateral targets. Overall, amplitudes of ipsilateral responses appear slightly smaller in individual subjects compared to contralateral responses. (c). Sound level of EMREOs associated with the 18 degree contralateral or ipsilateral target locations for individual subjects (left and right ears computed separately; see “Methods: Estimating EMREO sound amplitude” for details. (d-e) The variance-to-mean ratio of EMREO amplitude (d) and latency (e) is smaller for contralateral vs ipsilateral horizontal target locations, where amplitude and latency were computed based on the maximum peak (contralateral) or trough (ipsilateral) observed in a window 0–35 ms after saccade onset (the peaks and troughs used for these analyses were expressed in units of Z-scores not dB). Both amplitudes and latencies of ipsilateral responses are more variable across subjects compared to contralateral responses.
Figure 7.
Figure 7.
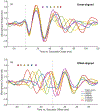
Relationship between timing of EMREO peaks and saccade onset/offset. (a) Grand-averaged waveforms (n=10) to contralateral horizontal visual targets aligned to saccade onset. The latency of the first peak (i.e. in the 0-to-40 ms time window) is consistent across different target locations (different saccade durations), but later peaks (i.e. 40 to 90 ms after onset) are delayed by amounts that depend on target location (different colors) and corresponding saccade duration (colored circles above the waveforms). (b) Same data as in panel (a) but aligned on saccade offset. The first positive-going peak after offset occurs at approximately 20 ms for all target locations.
Figure 8.
Figure 8.
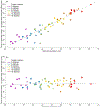
(a) Individual variation in saccade duration is associated with individual variation in EMREO peak timing for the later part of the EMREO waveform. The first peak after saccade offset was identified and its latency with respect to saccade onset was computed (y-axis) and expressed as a function of saccade duration (x-axis). Target locations are coded by color and each subject is identified with a unique symbol. By definition, the latency of this peak will scale with saccade duration, but the relationship could have been different for different subjects. Instead, we see that the relationship between saccade duration and the latencies of peaks clusters well around a single regression line for all subjects. (b) Similar to panel (a) but plots the latency of the first peak after saccade onset as a function of saccade duration. As before, saccades to each target location cluster together (by color) but the latency of this peak is unrelated to saccade duration.
Figure 9.
Figure 9.
Average peak-trough amplitude scales with target location (colored bars; peaks and troughs obtained within 0–35 ms window after saccade onset for contralateral saccades; see also the population grand-average waveforms from Figure 7a). However, the range is narrow, such that pooling across locations loses little information: the gray bar for the 10 subjects (20 ears) tested represents the population mean and standard error of the peak-to-trough amplitude. In short, the peak-trough amplitude 0–35 ms after onset of a contraversive saccade provides a good metric for EMREO amplitude, regardless of target location, providing a means for comparison across studies using different target locations and permitting use of a single contralateral target location if testing time/trial counts is a limiting factor in future studies.
Figure 10.
Figure 10.
Reproducibility of EMREO waveforms across blocks and recording days in individual subjects. For each subject and recording block, an average EMREO waveform was computed for the 0–35 ms window in which the EMREO waveform was relatively insensitive to target location, permitting pooling across targets (as shown in Figure 9). The top panels show these average waveforms within each block. The lower panels show the correlations between these average waveforms across blocks.

Update of

References

    1. Abbasi H, King CD, Lovich S, Röder B, Groh JM, Bruns P (2023) Audiovisual temporal recalibration modulates eye movement-related eardrum oscillations. International Multisensory Research Forum.
    1. Bahill AT, Clark MR, Stark L (1975) The main sequence, a tool for studying human eye movements. Mathematical Biosciences 24:191–204.
    1. Baloh RW, Sills AW, Kumley WE, Honrubia V (1975) Quantitative measurement of saccade amplitude, duration, and velocity. 25:1065–1065. - PubMed
    1. Blauert J (1997) Spatial hearing. Cambridge, MA: MIT Press.
    1. Bröhl F, Kayser C (in press) Detection of spatially-localized sounds is robust to saccades and concurrent eye movement-related eardrum oscillations (EMREOs). J Neurosci. - PMC - PubMed

Publication types