. 2023 Dec 7;186(25):5457-5471.e17.
doi: 10.1016/j.cell.2023.10.017. Epub 2023 Nov 17.

ABLs and TMKs are co-receptors for extracellular auxin

Affiliations

ABLs and TMKs are co-receptors for extracellular auxin

Yongqiang Yu et al. Cell. .

Abstract

Extracellular perception of auxin, an essential phytohormone in plants, has been debated for decades. Auxin-binding protein 1 (ABP1) physically interacts with quintessential transmembrane kinases (TMKs) and was proposed to act as an extracellular auxin receptor, but its role was disputed because abp1 knockout mutants lack obvious morphological phenotypes. Here, we identified two new auxin-binding proteins, ABL1 and ABL2, that are localized to the apoplast and directly interact with the extracellular domain of TMKs in an auxin-dependent manner. Furthermore, functionally redundant ABL1 and ABL2 genetically interact with TMKs and exhibit functions that overlap with those of ABP1 as well as being independent of ABP1. Importantly, the extracellular domain of TMK1 itself binds auxin and synergizes with either ABP1 or ABL1 in auxin binding. Thus, our findings discovered auxin receptors ABL1 and ABL2 having functions overlapping with but distinct from ABP1 and acting together with TMKs as co-receptors for extracellular auxin.

Keywords: ABL1; ABL2; ABP1; ABP1-like proteins; TMKs; auxin; transmembrane kinases.


Conflict of interest statement

Declaration of interests The authors declare no competing interests.

Figures

Figure 1.
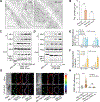
Figure 1.. ABP1–5 suppresses auxin responses in Arabidopsis.
Representative auxin responses in Col-0, abp1-TD1 (abp1), pABP1::ABP1–5;abp1-TD1 (ABP1–5;abp1) and pABP1::ABP1;abp1-TD1 (ABP1;abp1) lines are presented here. (A-C) The phenotype of epidermal pavement cells (PC) in Arabidopsis cotyledons of Col-0, abp1, ABP1–5;abp1 and ABP1;abp1 with CK (DMSO) and 20 nM NAA treatment (A). Scale bar, 50 μm. (B-C) Quantitative analysis of PC interdigitation is depicted by the number of lobes per cell (B) and margin roughness (C). Cotyledons from different lines were treated with CK and 20 nM NAA as described in (A). n > 147 independent cells for each treatment. ns denotes not significant; **p < 0.01;****p < 0.0001; one-way ANOVA. (D-F) ROP2 and ROP6 activity assays using the protoplasts of Col-0, abp1, ABP1–5;abp1 and ABP1;abp1 treated with 50 nM NAA for 10 min. Active ROP2 (E) and ROP6 (F) levels (the amount of GTP-bound ROP2 or RO6 divided by the amount of total ROP2 or ROP6) were measured. Auxin-induced activity (NAA) relative to control (CK, designated as “1”) is shown. Data are mean ± SD (n = 4 independent experiments). ns denotes significant; *p < 0.05; ***p < 0.001; one-way ANOVA. (G-I) Auxin-promotion of hypocotyl elongation and cotyledon bending in Col-0, abp1, ABP1–5;abp1 and ABP1;abp1 (G). 5-day-old seedlings were treated with 0, 2.5 and 5 μM IAA for 2 days, respectively, and hypocotyl length (H) and cotyledon angles (I) were measured and quantified. Scale bar, 2 mm. Data are mean ± SD (n > 28 independent seedlings). Different and same letters indicate values with statistically significant (p < 0.05; Tukey HSD) and non-significant (p > 0.05; Tukey HSD) differences, respectively. See also Figure S1.
Figure 2.
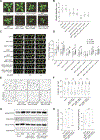
Figure 2.. ABL1/ABL2-TMKs auxin sensing complexes on the cell surface.
(A-B) The ABL1 protein localization in Arabidopsis young leaves was detected by the immune colloidal gold technique (A) and quantification (B). CE, cell wall, and extracellular region. ECE, regions except for cell wall and extracellular region. Scale bar, 500 nm. Data are mean ± SD (n > 10 regions). ns denotes not significant; ****p < 0.0001; one-way ANOVA. (C-D) The interaction between ABL1/ABL2 and TMK1 by co-immunoprecipitation from Arabidopsis seedlings expressing pTMK1::TMK1-GFP (TMK1-GFP) treated with different concentrations of NAA for 15 min or treated with 5 μM NAA for different time periods. Proteins from TMK1-GFP and BRI1-GFP (as a negative control) seedlings were immunoprecipitated using GFP-Trap and tested by Western blotting analysis using anti-ABL1 and anti-ABL2 antibodies (top two panels), respectively. Input amounts for ABL1, ABL2, TMK1-GFP and BRI1-GFP are shown (in middle and bottom panels). (E-F) Quantitative analysis of ABL1, ABL2 and TMK1 association before and after treatments (E) with indicated concentrations of NAA for 15 min in (C), and (F) with 5 μM NAA for different time periods in (D). Data are mean ± SD (n = 3 independent experiments). (G-H) FRET analysis between ABL1-GFP and mCherry-TMK1-ex in tobacco leaves. The representative heatmap of sensitized emission efficiencies of FRET between mCherry-TMK1-ex and ABL1-GFP or ABL1-M2-GFP (G). Images were obtained from the cell boundary region (dotted lines). Scale bar, 10 μm. Quantitative analysis of changes in the FRET-SE efficiency after 100 nM NAA treatment for 5 min (H). n = 45 cells for each treatment. ns denotes not significant; ***p < 0.001; two-sided Student’s t-test. See also Figure S2, Table S1 and S2.
Figure 3.
Figure 3.. ABLs and ABP1 exhibit overlapping and distinct functions in plant development.
(A) The morphology of 4-week-old soil-grown seedlings from Col-0, abp1, abl1, abl2, abp1;abl1, abp1;abl2, abl1/2, and abp1;abl1/2. The abp1;abl1/2 phenotype was rescued by pABL1::ABL1, pABP1::ABP1, or pABL1::ABP1, but not by pABP1::ABP1–5 and pABL1::ABL1-M2. Scale bar, 1 cm. (B) Quantitative analysis of fresh weights of seedlings as described in (A). Data are mean ± SD (n > 16 independent seedlings). Different and same letters indicate values with statistically significant (p < 0.05; Tukey HSD) and non-significant (p > 0.05; Tukey HSD) difference, respectively. (C) Phenotype of pavement cells in 3-week-old the fifth pair true leaves of Col-0, abl1/2, abp1;abl1/2, ABP1;abp1;abl1/2 and ABL1;abp1;abl1/2. Scale bar, 100 μm. (D) Quantitative analysis of PC interdigitation. Pavement cell area, length, indentation width, and the number of lobes per cell were analyzed. Data are mean ± SD (n > 332 independent cells). Different letters indicate values with statistically significant differences (p < 0.05; Tukey HSD). See also Figure S3.
Figure 4.
Figure 4.. ABP1 and ABLs exhibit an overlapping function in the regulation of auxin responses.
(A) ROP2 (top panel) and ROP6 (bottom panel) activation by auxin (5 μM NAA) in Col-0, abp1;abl1/2, abp1;abl1/2 and ABP1 complementation line pABP1::ABP1;abp1;abl1/2 (ABP1;abp1;abl1/2) seedlings (7-day-old) as described in Figure 1D. (B) The relative ROP2 and ROP6 activity levels in (A) were quantified by ImageJ software by measuring the intensity of the bands. The activity is the amount of GTP-bound ROP (top) divided by total ROP (bottom). Data are mean ± SE (n = 3 independent experiments). (C-D) Auxin-induced hypocotyl elongation in Col-0, abp1;abl1/2, ABP1 and ABL1 complementation lines ABP1;abp1;abl1/2 and pABL1::ABL1;abp1;abl1/2 (ABL1;abp1;abl1/2) (C). The hypocotyl length was quantified in (D). n = 30 independent seedlings per line. Different and same letters indicate values with statistically significant (p < 0.05; Tukey HSD) and non-significant (p > 0.05; Tukey HSD) differences, respectively. (E-F) Rapid phosphoproteomics analysis of 5-day-old Col-0 and abp1;abl1/2 seedlings treated with CK (DMSO) or 1 μM IAA for 1 min (E) and 5 min (F). Scatter plot and heatmap analyses show that most of the differential expressed phosphorylation sites in IAA vs CK for 1 min (E) or 5 min (F) of Col-0 were not regulated by IAA in the abp1;abl1/2 mutant, suggesting that ABP1 and ABL1/2 are required for IAA-induced rapid global phospho-response. Log2 fold change variations of the analyzed sites were shown with boxplots. See also Figure S3 and Table S3.
Figure 5.
Figure 5.. ABL1 and ABP1 function through their interaction with TMKs.
(A-B) The seedling morphology of 4-week-old soil-grown Col-0, abp1;abl1, tmk1+/−;tmk4, abp1;tmk1+/−;tmk4, abl1;tmk1+/−;tmk4, abp1;abl1;tmk1+/−;tmk4, pABP1::ABP1;abp1;abl1;tmk1+/−;tmk4 (ABP1;abp1;abl1;tmk1+/−;tmk4) and pABL1::ABL1;abp1;abl1;tmk1+/−;tmk4 (ABL1;abp1;abl1;tmk1+/−;tmk4) lines (A). Scale bar, 1 cm. (B) Quantitative analysis of the rosette diameter of seedlings in (A). Data are mean ± SD (n = 14 independent seedlings). Different letters indicate values with statistically significant differences (p < 0.05; Tukey HSD). (C-D) Auxin-induced hypocotyl elongation in Col-0, abp1;abl1, tmk1+/−;tmk4, abp1;tmk1+/−;tmk4, abl1;tmk1+/−;tmk4, abp1;abl1;tmk1+/−;tmk4, ABP1;abp1;abl1;tmk1+/−;tmk4 and ABL1;abp1;abl1;tmk1+/−;tmk4 lines (C). Scale bar, 2 mm. (D) Quantitative analysis of hypocotyl length for seedlings in (C). Data are mean ± SD (n = 23 independent seedlings). Different and same letters indicate values with statistically significant (p < 0.05; Tukey HSD) and non-significant (p > 0.05; Tukey HSD) difference, respectively. (E-F) Defects in auxin-induced PC interdigitation in the abp1;abl1;tmk1+/−;tmk4 mutant were rescued by either ABP1 (ABP1;abp1;abl1;tmk1+/−;tmk4) or ABL1 (ABL1;abp1;abl1;tmk1+/−;tmk4) (E). Scale bar, 20 μm. (F) Quantitative analysis of PC interdigitation (lobe number/cell) in (E). (n > 267 independent cells). ns denotes not significant; ***p < 0.001; ****p < 0.0001; one-way ANOVA. (G-H) Auxin-induced ROP2 and ROP6 activation was abolished in the abp1;abl1;tmk1+/−;tmk4 mutants and rescued by ABP1. Protoplasts from Col-0, abp1;abl1;tmk1+/−;tmk4 and ABP1;abp1;abl1;tmk1+/−;tmk4 were treated with 50 nM NAA for 10 min. Quantitative analyses of relative ROP2 and ROP6 activity (H) are performed as described in Figure 1E and 1F. Data are mean ± SD (n = 3 independent experiments). ns denotes not significant; *p < 0.05; one-way ANOVA. See also Figure S4.
Figure 6.
Figure 6.. ABP1/ABL1 and TMK1 bind auxin synergistically.
(A-B) Auxin (IAA) binding to ABP1, ABL1, TMK1-ex, ABP1–5, and ABL1-M2 was measured by MST (microscale thermophoresis). Data points indicate the difference in normalized fluorescence (‰) generated by no-liganded or liganded fluorescently labeled proteins, and the curves show calculated fits. Data are representatives of three independent experiments. ABP1, ABP1–5, ABL1, ABL1-M2, and TMK1-ex proteins were expressed in Arabidopsis protoplasts. Auxin concentrations of 250 μM to 0.00763 μM for IAA dissolved in 0.5% DMSO in binding buffer were used for auxin-binding. (C) Quantification of binding affinity between IAA and fluorescently labeled ABP1, ABP1–5, ABL1, ABL1-M2, and TMK1-ex by MST in (A-B). ND denotes not detectable. Data are mean ± SD (n = 3 independent experiments). *P ≤ 0.05; one-way ANOVA. (D) pABL1::ABL1 but not pABL1::ABL1-M2 complements the abl1/2 mutant growth defects. See also Figure S5 and Table S2.
Figure 7.
Figure 7.. A model for the action of ABLs/ABP1 and TMKs as co-receptors for apoplastic auxin.
The extracellular domain of TMK1 synergizes with both ABP1 and ABLs in auxin binding and interacts with the apoplast-localized ABP1 and ABLs in an auxin-dependent manner. Thus, ABLs/ABP1 and TMKs form an extracellular auxin co-receptor system. Upon auxin perception, the activated TMK kinase domain directly phosphorylates a series of effectors that regulate many developmental processes such as pavement cell interdigitation, hypocotyl rapid elongation, leaf morphology, root gravitropism and fertility ,,– (Figures 5 and S4). Some internal functions that are still unknown, but likely regulated by ABLs/ABP1-TMKs complex were indicated with dotted lines.

Comment in

References

    1. Li L, Gallei M, and Friml J. (2022). Bending to auxin: fast acid growth for tropisms. Trends Plant Sci 27, 440–449. 10.1016/j.tplants.2021.11.006. - DOI - PubMed
    1. Xu T, Wen M, Nagawa S, Fu Y, Chen JG, Wu MJ, Perrot-Rechenmann C, Friml J, Jones AM, and Yang Z. (2010). Cell surface- and rho GTPase-based auxin signaling controls cellular interdigitation in Arabidopsis. Cell 143, 99–110. 10.1016/j.cell.2010.09.003. - DOI - PMC - PubMed
    1. Friml J, Gallei M, Gelova Z, Johnson A, Mazur E, Monzer A, Rodriguez L, Roosjen M, Verstraeten I, Zivanovic BD, et al. (2022). ABP1-TMK auxin perception for global phosphorylation and auxin canalization. Nature 609, 575–581. 10.1038/s41586-022-05187-x. - DOI - PubMed
    1. Bates GW, and Goldsmith MH (1983). Rapid response of the plasma-membrane potential in oat coleoptiles to auxin and other weak acids. Planta 159, 231–237. 10.1007/BF00397530. - DOI - PubMed
    1. Keller CP, and Van Volkenburgh E. (1996). Osmoregulation by oat coleoptile protoplasts (effect of auxin). Plant Physiol 110, 1007–1016. 10.1104/pp.110.3.1007. - DOI - PMC - PubMed

MeSH terms