Review
. 2024 Feb;42(1):77-114.
doi: 10.1016/j.ncl.2023.06.009. Epub 2023 Aug 7.

Updates in NMOSD and MOGAD Diagnosis and Treatment: A Tale of Two Central Nervous System Autoimmune Inflammatory Disorders

Affiliations
Review

Updates in NMOSD and MOGAD Diagnosis and Treatment: A Tale of Two Central Nervous System Autoimmune Inflammatory Disorders

Laura Cacciaguerra et al. Neurol Clin. 2024 Feb.

Abstract

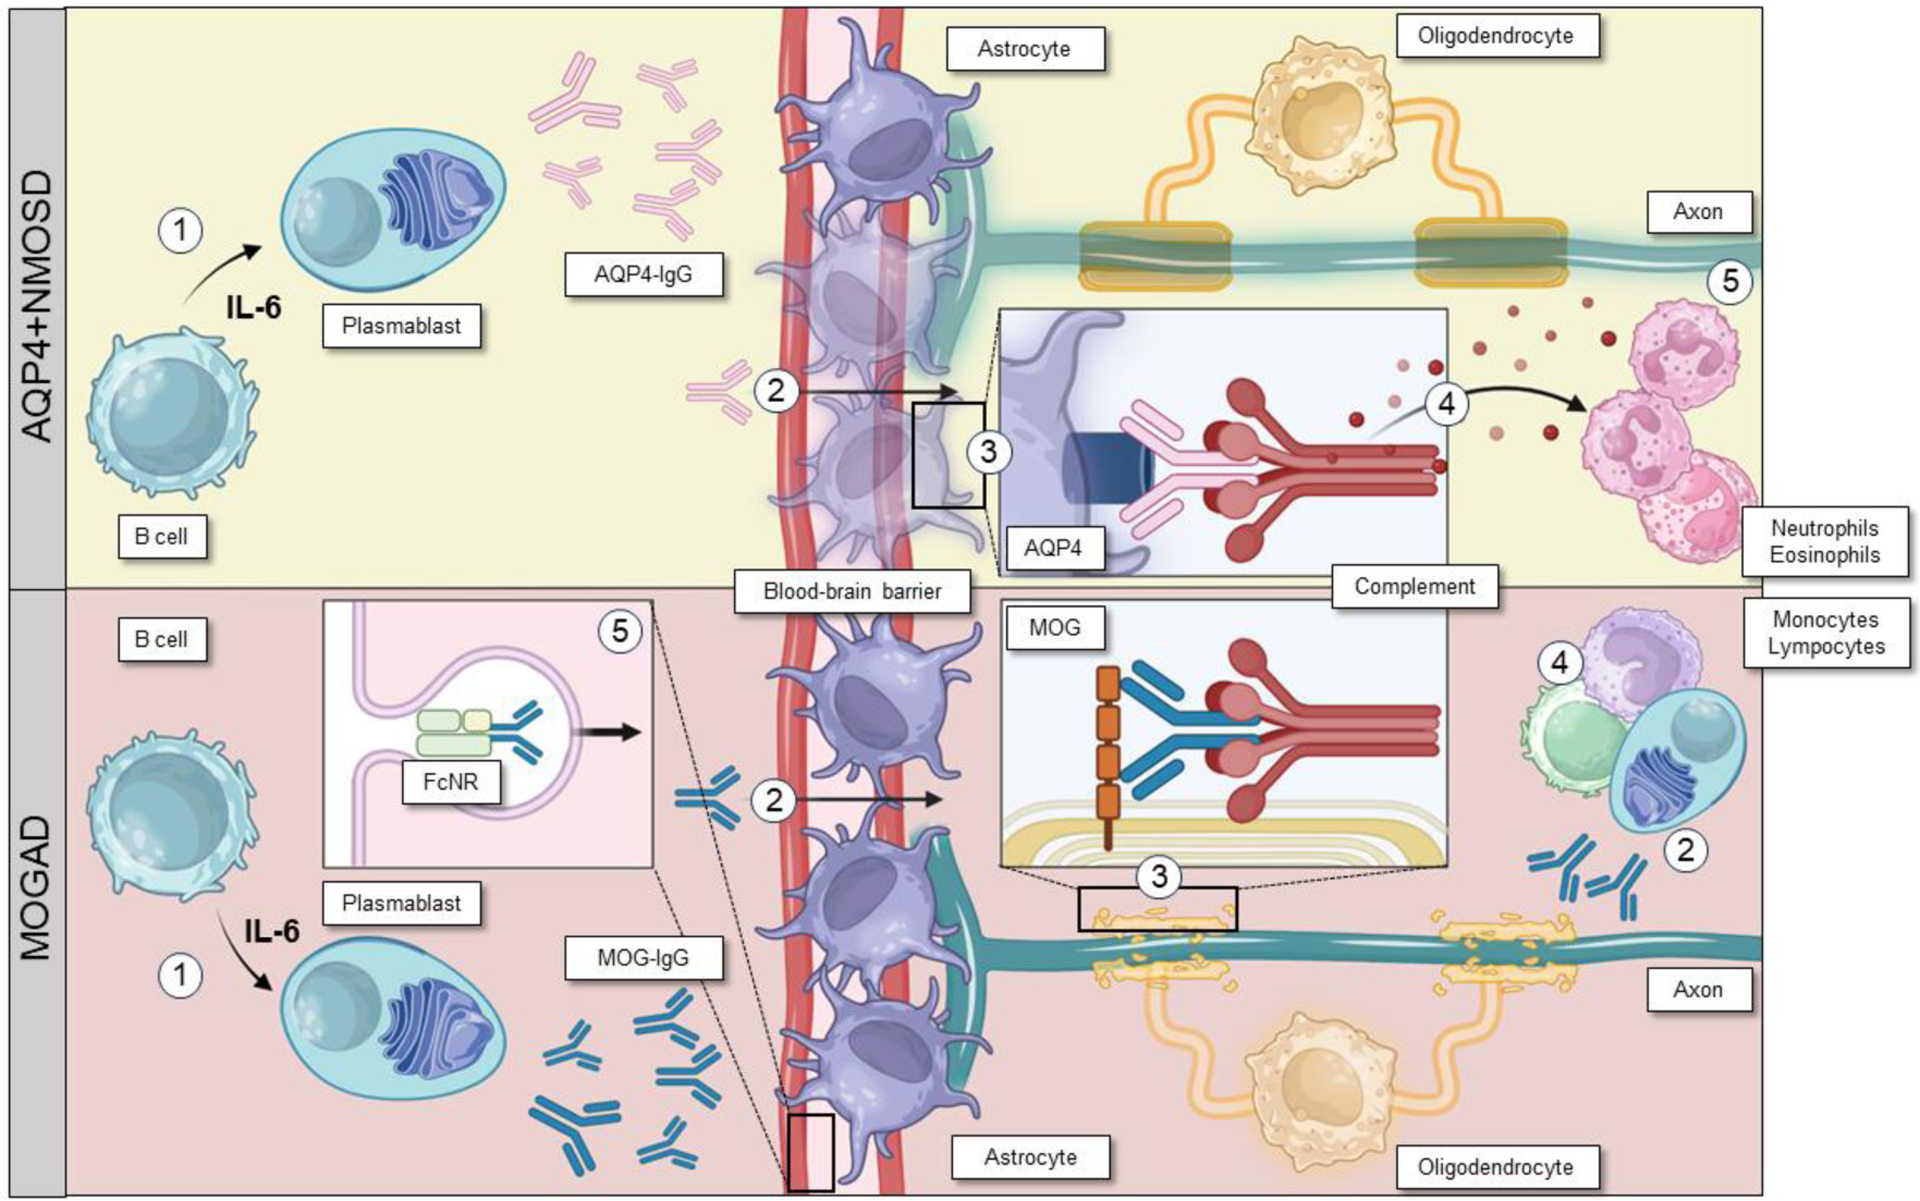
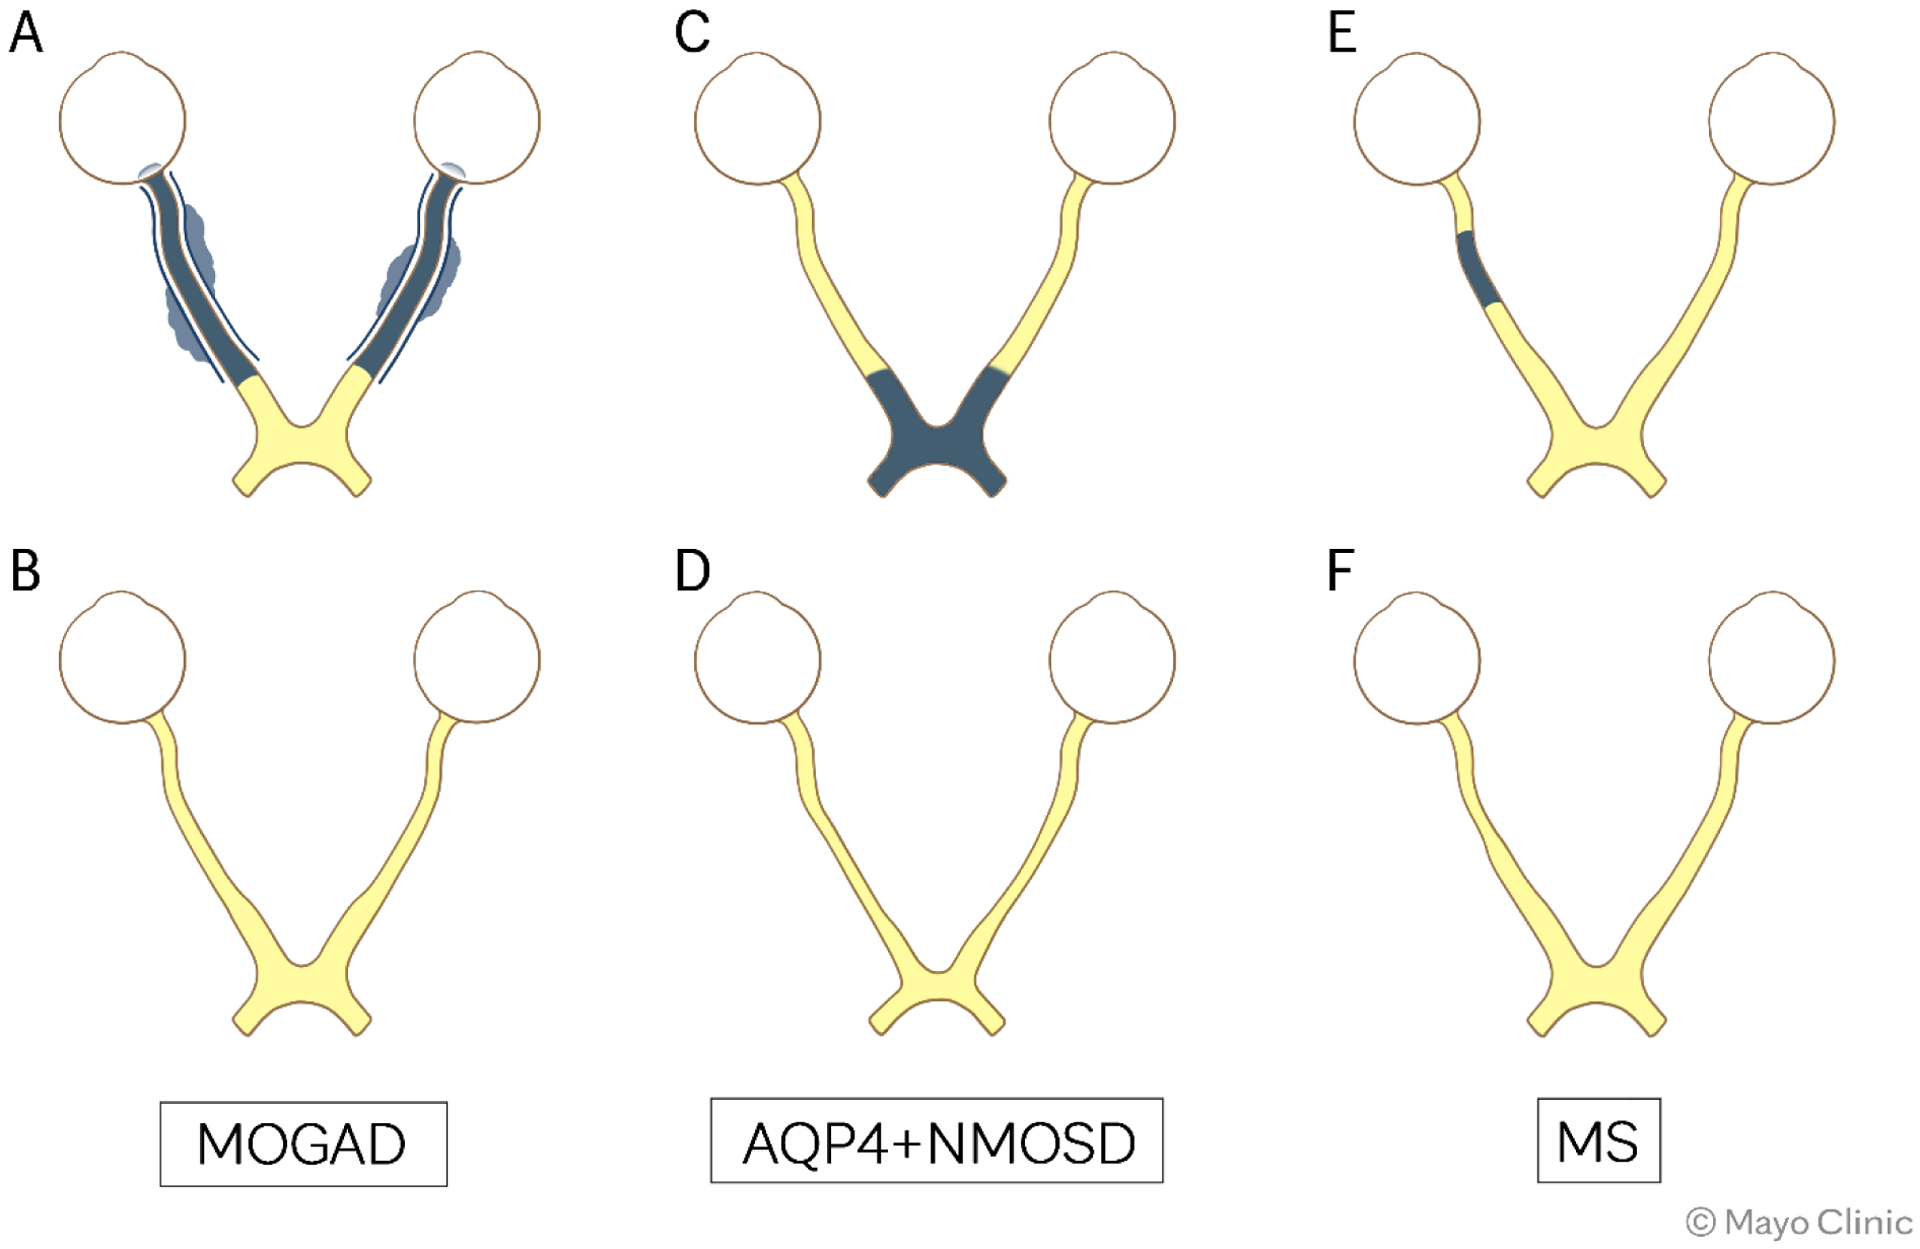
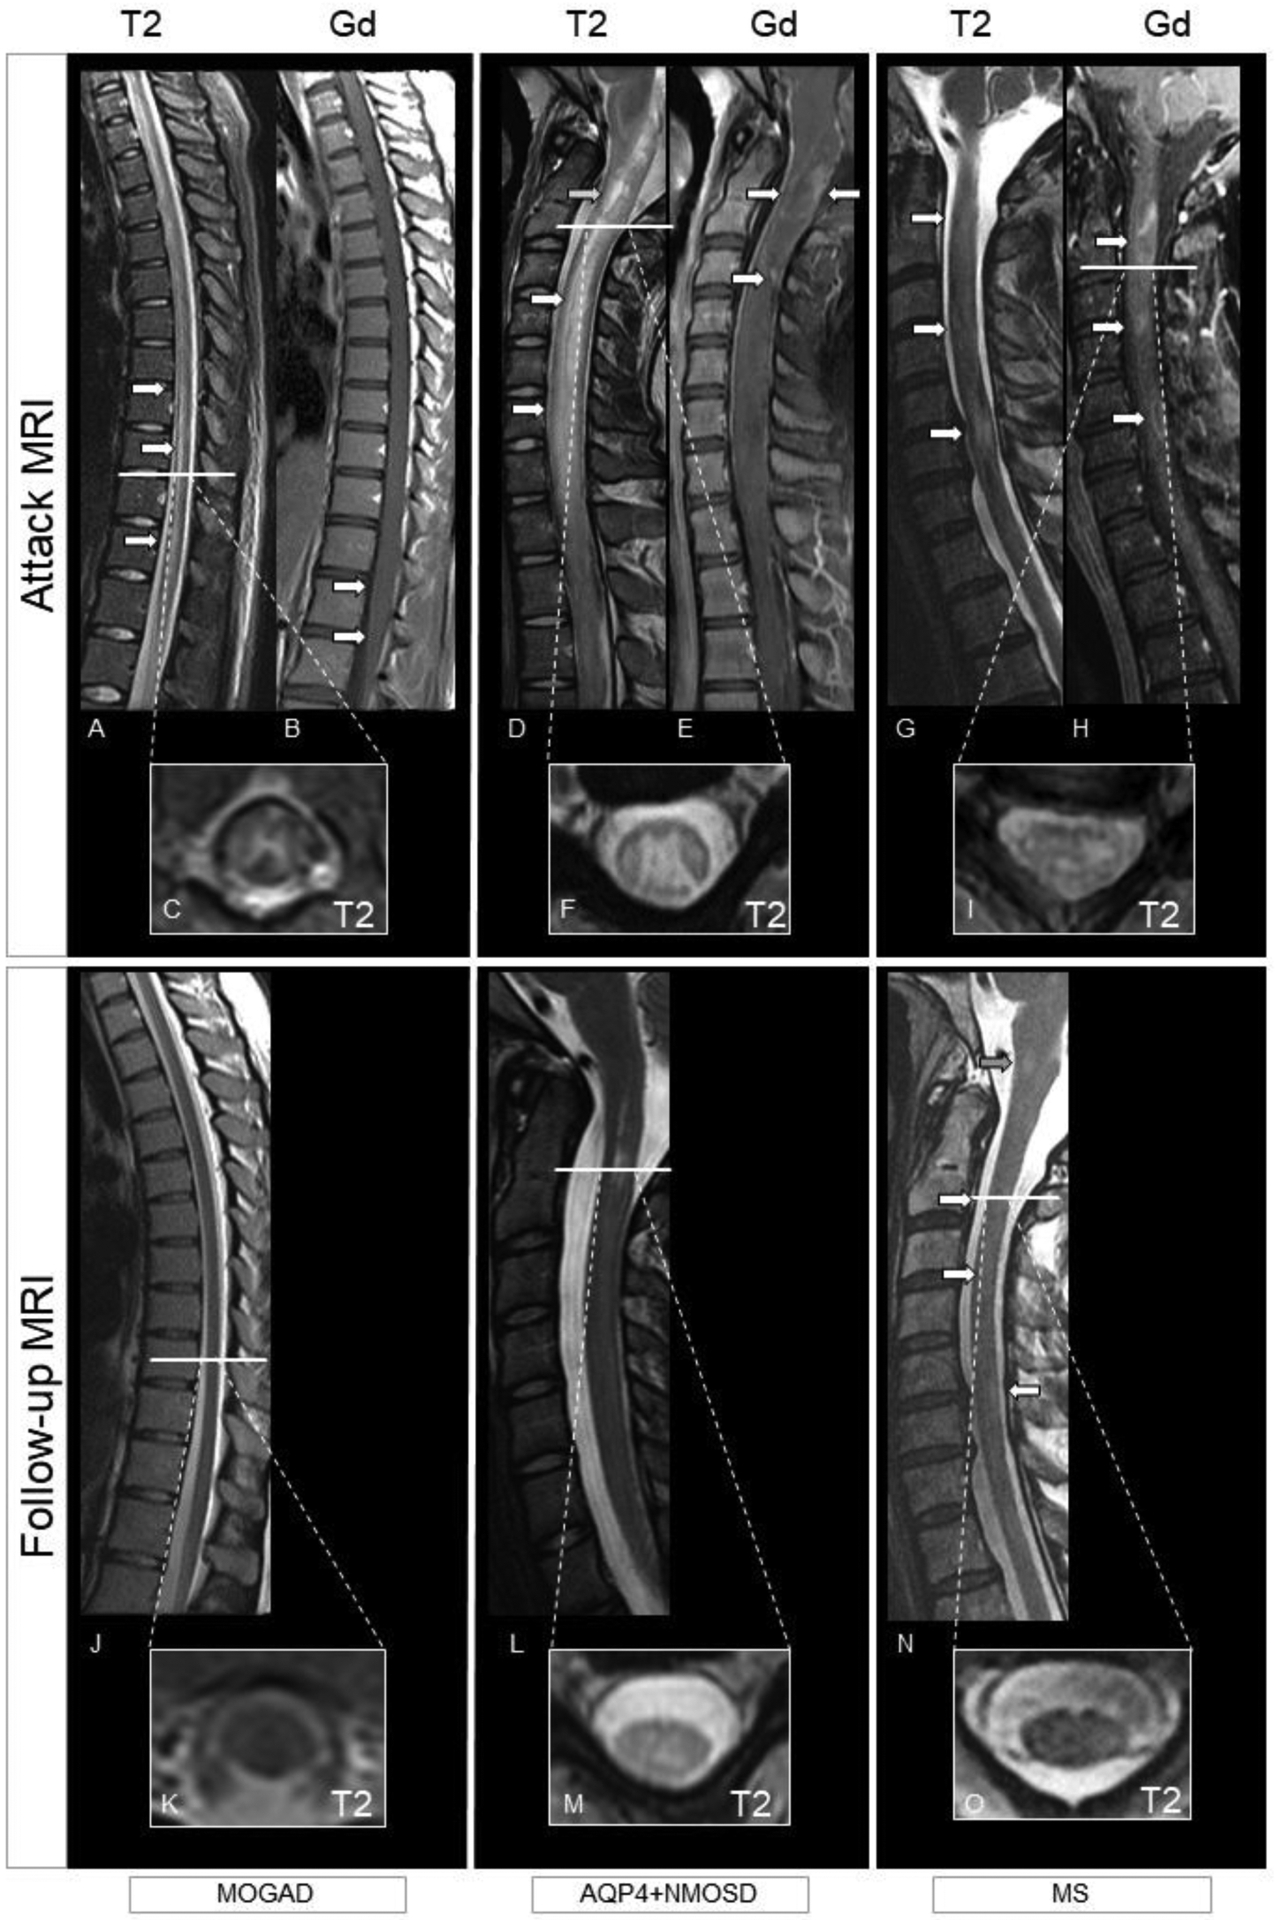
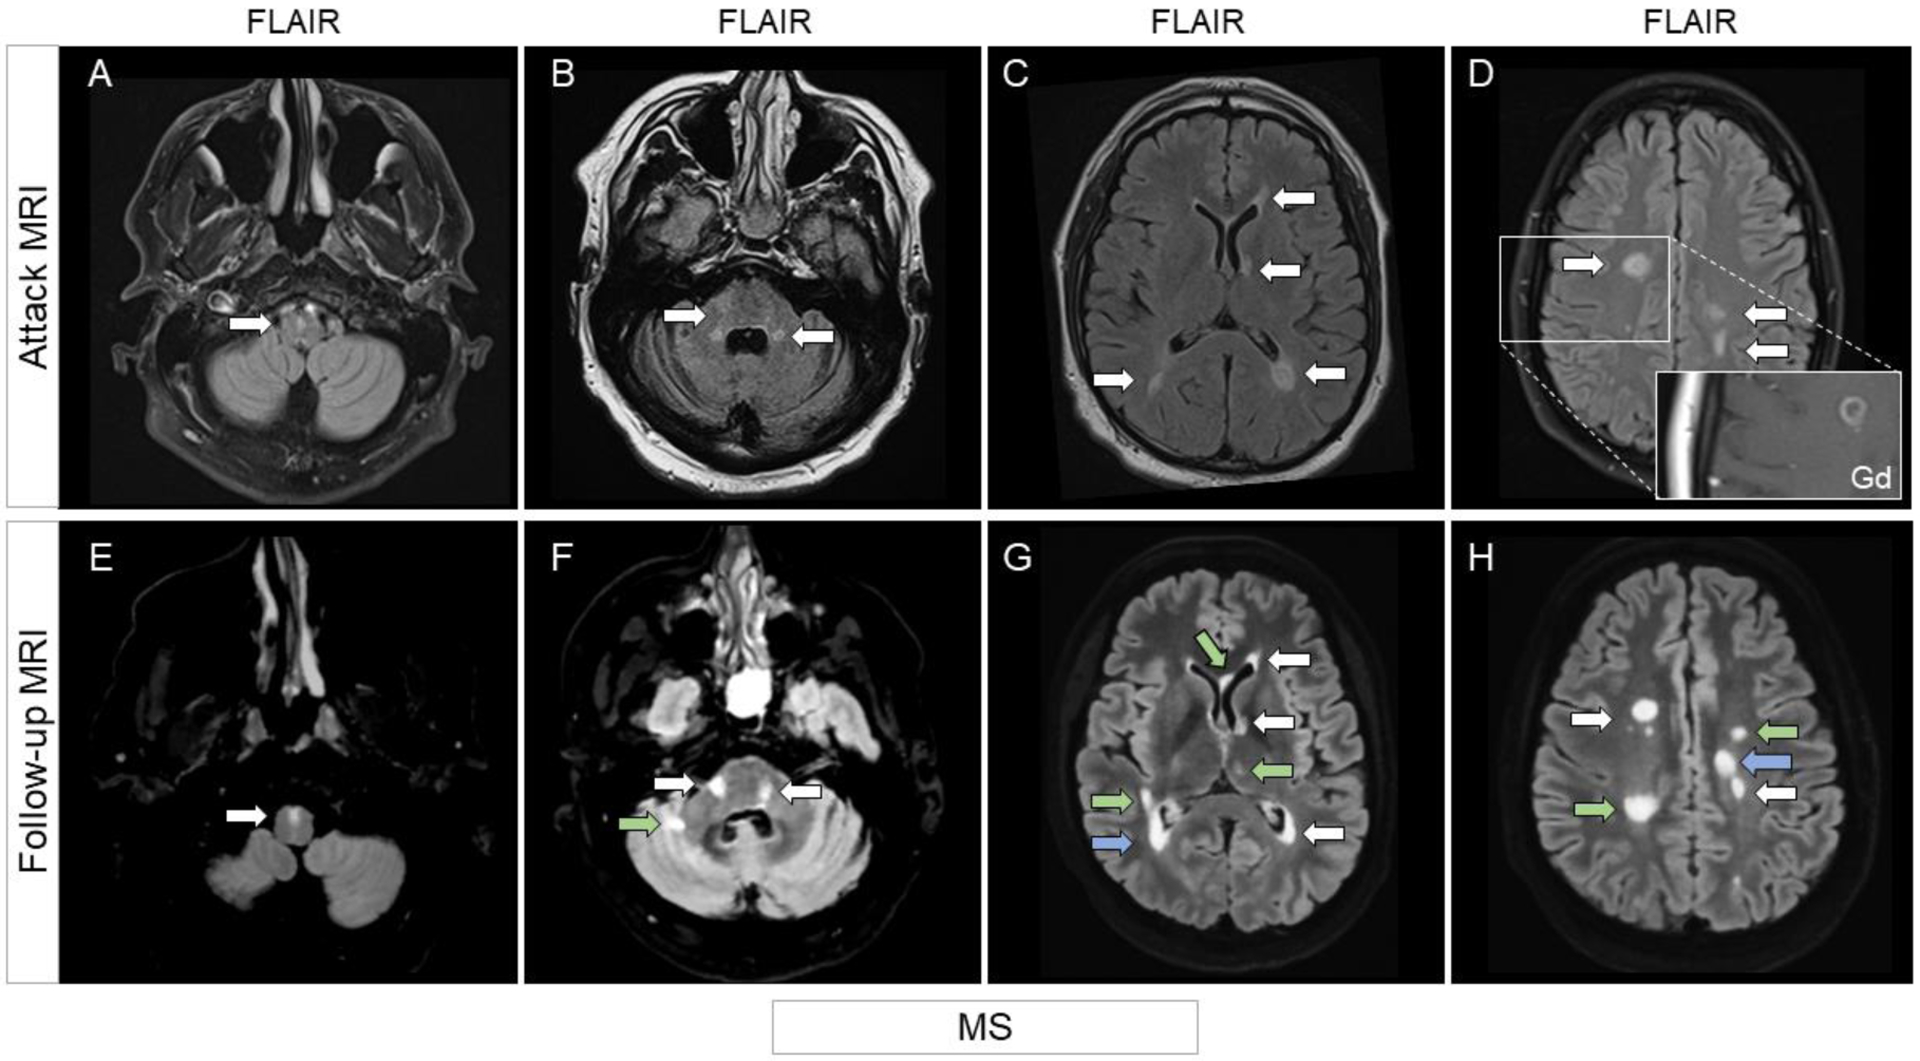
Aquaporin-4-IgG positive neuromyelitis optica spectrum disorder (AQP4+NMOSD) and myelin-oligodendrocyte glycoprotein antibody-associated disease (MOGAD) are antibody-associated diseases targeting astrocytes and oligodendrocytes, respectively. Their recognition as distinct entities has led to each having its own diagnostic criteria that require a combination of clinical, serologic, and MRI features. The therapeutic approach to acute attacks in AQP4+NMOSD and MOGAD is similar. There is now class 1 evidence to support attack-prevention medications for AQP4+NMOSD. MOGAD lacks proven treatments although clinical trials are now underway. In this review, we will outline similarities and differences between AQP4+NMOSD and MOGAD in terms of diagnosis and treatment.

Keywords: AQP4-IgG; Diagnosis; MOG; MOG-IgG; Treatment; aquaporin-4; myelin oligodendrocyte glycoprotein; neuromyelitis optica spectrum disorder.


Figures

Figure 1.
Figure 1.. Schematic representation of AQP4+NMOSD and MOGAD pathogenesis.
AQP4+NMOSD: 1. Interleukin-6 promotes differentiation of B cells into AQP4-IgG secreting plasmablasts; 2. AQP4-IgGs reach the blood stream and cross the blood-brain barrier; 3. AQP4-IgGs bind to AQP4 on astrocytes and activate the complement cascade through the classical pathway leading to astrocyte damage; 4. The release of anaphylatoxins after complement activation recruit granulocytes, which will ultimately damage neurons and eventually, although not primarily, oligodendrocytes (5). MOGAD: 1. Interleukin-6 promotes differentiation of B cells into MOG-IgG secreting plasmablasts; 2. MOG-IgGs reach the blood stream and cross the blood-brain barrier, but recent evidence suggest they might also be produced intrathecally; 3. MOG-IgGs bind to MOG on oligodendrocytes and activate the complement cascade through the classical pathway leading to olygodendrocyte damage; 4. local inflammation recruits T cells and monocytes/macrophages; 5. MOG-IgGs recycling in the blood stream seems to contribute to the persistence of the mechanism of damage. Figure created with Biorender.com. Abbreviations: AQP4=aquaporin-4; AQP4+NMOSD=aquaporin-4-IgG positive neuromyelitis optica spectrum disorder; IL-6=interleukin-6; MOG=myelin oligodendrocyte; MOGAD=myelin oligodendrocyte glycoprotein antibody-associated disease.
Figure 2.
Figure 2.. MRI examples of optic neuritis in patients with MOGAD, AQP4+NMOSD, and MS.
Top row shows MRI findings during the acute phase (post-contrast T1-weighted images with fat saturation), while follow-up up imaging is displayed in the bottom row (pre-contrast T1-weighted images). Unless otherwise specified, images are all shown in axial view. MOGAD: Bilateral anterior optic neuritis (A, arrows) extending over 50% of optic nerve length on the right side (i.e., long optic neuritis), and short on the left side, with no or minimal residual optic nerve atrophy (B). AQP4+NMOSD: Bilateral optic neuritis (C, arrows) involving the chiasm (zoom-in picture, coronal detail) with mild residual atrophy (D). MS: Unilateral short left optic neuritis (E, arrow) with mild residual focal atrophy (F). Abbreviations: AQP4+NMOSD=aquaporin-4-IgG positive neuromyelitis optica spectrum disorder; Gd= post-contrast T1-weighted images; MOGAD=myelin oligodendrocyte glycoprotein antibody-associated disease; MS=multiple sclerosis; T1=pre-contrast T1-weighted images.
Figure 3.
Figure 3.. Schematic representation of optic neuritis in patients with MOGAD, AQP4+NMOSD, and MS.
Top row shows schematic representation of the optic nerve during the acute phase, while follow-up up is displayed in the bottom row. All images are shown in axial view. MOGAD: Bilateral anterior optic neuritis with accompanying optic disc edema extending over 50% of optic nerve length bilaterally with optic nerve sheaths and perioptic fat involvement (A) and minimal residual optic nerve atrophy (B). AQP4+NMOSD: Bilateral optic neuritis involving the chiasm (C) with residual atrophy (D). MS: Unilateral short right optic neuritis (E) with residual focal atrophy (F). Abbreviations: AQP4+NMOSD=aquaporin-4-IgG positive neuromyelitis optica spectrum disorder; Gd= post-contrast T1-weighted images; MOGAD=myelin oligodendrocyte glycoprotein antibody-associated disease; MS=multiple sclerosis.
Figure 4.
Figure 4.. MRI examples of myelitis in patients with MOGAD, AQP4+NMOSD, and MS.
Top row shows MRI findings during the acute phase (T2-weighted images and post-contrast T1-weighted images), while follow-up up imaging is displayed in the bottom row (T2-weighted images). MOGAD: Longitudinally extensive myelitis (i.e., T2-lesion extending over at least three continuous vertebral segments) with a linear appearance involving the thoracic cord down to the conus (A, arrows, sagittal view). There is associated H-sign (i.e., exclusive involvement of the grey matter; C, axial view). Enhancement is absent, except for a mild leptomeningeal enhancement of the conus (B, arrows, sagittal view). The T2-lesion completely resolved on T2-weighted images at follow-up (J, sagittal view and K, axial view), with no evident atrophy. AQP4+NMOSD: Longitudinally extensive myelitis with a T2-lesion starting from the area postrema and involving the cervical cord (D, arrows, sagittal view) with associated swelling. Intralesional increased focal T2-hyperintensity similar to the CSF (i.e., brighter spotty lesion) is also present (D, green arrow). The T2-lesion is centrally located in both the grey and the white matter (F). Enhancement is inhomogeneous (E, arrows, sagittal view). At follow-up, the T2-lesion reduced in size on T2-weighted images (L, sagittal and M axial view) although still present. Residual atrophy of the cord is particularly evident on axial view (M). MS: Multiple focal short spinal cord T2-lesions (G, arrows, sagittal view) located in the peripheral white matter (I, axial view). All lesions enhance, with the bottom lesion showing a ring-pattern of enhancement (H, arrows, sagittal view). T2-lesions reduce in size and prominence of T2-hyperintensity persist on follow-up T2-weighted images (N, arrows, sagittal view and O, axial view). The patient also developed an interval T2-lesion (N, green arrow). Abbreviations: AQP4+NMOSD=aquaporin-4-IgG positive neuromyelitis optica spectrum disorder; Gd=post-contrast T1-weighted images; MOGAD=myelin oligodendrocyte glycoprotein antibody-associated disease; MS=multiple sclerosis; T2=T2-weighted images.
Figure 5.
Figure 5.. Schematic representation of myelitis in patients with MOGAD, AQP4+NMOSD, and MS.
Top row shows spinal cord findings during the acute phase (T2-weighted images and post-contrast T1-weighted images), while follow-up up imaging is displayed in the bottom row (T2-weighted images). MOGAD: Longitudinally extensive myelitis with a linear T2-lesion appearance involving the lower cervical and upper to middle thoracic cord and another lesion in the conus (A, sagittal view). There is associated H-sign with the T2-lesion restricted to grey matter (C, axial view). Minimum linear enhancement and leptomeningeal enhancement of the conus (B, sagittal view). The T2-lesion completely resolved on T2-weighted images at follow-up (J, sagittal view and L, axial view), with no evident atrophy. Gadolinium enhancement resolved (K). AQP4+NMOSD: Longitudinally extensive myelitis with a T2-lesion involving the cervical and thoracic cord (D, sagittal view) with elongated ring enhancement (E). The T2-lesion is centrally located in both the grey and the white matter (F, axial view). At follow-up, the lesion is smaller on T2-weighted images (M, sagittal and O axial view) although still present. Gadolinium enhancement resolved (N). MS: Multiple focal short spinal cord T2-lesions (G, sagittal view) located in the peripheral white matter (I, axial view). One lesion shows homogeneous nodular enhancement (H, sagittal view). T2-lesions reduce in size and persist on follow-up T2-weighted images (P, sagittal view and R, axial view) with development of focal left sided spinal cord atrophy particularly evident on axial images (R). A new interval T2-lesion is also present (P). Gadolinium enhancement resolved (Q). Abbreviations: AQP4+NMOSD=aquaporin-4-IgG positive neuromyelitis optica spectrum disorder; Gd=post-contrast T1-weighted images; MOGAD=myelin oligodendrocyte glycoprotein antibody-associated disease; MS=multiple sclerosis; T2=T2-weighted images.
Figure 6.
Figure 6.. MRI examples of brain lesions in patients with MOGAD.
Top row shows MRI findings during the acute phase, while follow-up up imaging is displayed in the bottom row. Images are in axial view. Poorly defined (i.e., fluffy) T2-lesions in the entire medulla and cerebellum (A, arrows), completely resolving at follow-up imaging (E). Bilateral fluffy T2-lesions in the middle cerebellar peduncles (B, arrows) with reduction in size but persistence at follow-up (F, arrows) with accompanying fourth ventricle ex vacuo enlargement. Bilateral fluffy T2-lesions of the thalami (C, arrows) in a patient with prominent leptomeningeal enhancement (zoom-in picture, post-contrast T1-weighted sequence) undergoing complete resolution at follow-up (G). Patient with cerebral cortical encephalitis showing an extensive cortical T2-lesion (D, arrow) with focal enhancement (zoom-in picture, post-contrast T1-weighted sequence), completely resolved at follow-up (H). Abbreviations: FLAIR=fluid-attenuated inversion recovery; Gd=post-contrast T1-weighted images; MOGAD=myelin oligodendrocyte glycoprotein antibody-associated disease.
Figure 7.
Figure 7.. Schematic representation of brain lesions in patients with MOGAD.
Top row shows brain findings during the acute phase, while follow-up up is displayed in the bottom row. Images are all shown on axial view. T2-lesion involving the entire medulla (A), completely resolving at follow-up (F). Bilateral fluffy T2-lesions in the middle cerebellar peduncles (B) resolved at follow-up (G). Bilateral fluffy T2-lesions of the thalami and additional lesions in the white matter (C) undergoing complete resolution at follow-up (H). Cerebral cortical encephalitis with an extensive cortical T2-lesion (D) accompanied by leptomeningeal enhancement (E). Both cortical lesion and enhancement completely resolved at follow-up (I, J). Abbreviations: FLAIR=fluid-attenuated inversion recovery; Gd=post-contrast T1-weighted images; MOGAD=myelin oligodendrocyte glycoprotein antibody-associated disease.
Figure 8.
Figure 8.. MRI examples of brain lesions in patients with AQP4+NMOSD.
Top row shows MRI findings during the acute phase, while follow-up up imaging is displayed in the bottom row. Images are shown in axial view. T2-lesion in the area postrema (A, arrow) almost invisible but still present at follow-up (F, zoomed-in picture, arrow). T2-lesion involving the dorsal pons abutting to the fourth ventricle (B, arrow) with complete resolution at follow-up (G). Periependymal T2-lesion (C, arrow) with corresponding linear ependymal enhancement (zoom-in picture, post-contrast T1-weighted sequence), persisting at follow-up (H, arrow). T2-lesion involving the splenium of the corpus callosum in another patient (D, arrow), significantly reduced in size but still visible at follow-up (I, arrow). Multiple small nonspecific T2-lesions in the subcortical white matter (E, arrows), persisting unchanged at follow-up (J, arrows). Additional interval T2-lesions are observed as well (J, green arrows). Abbreviations: AQP4+NMOSD=aquaporin-4-IgG positive neuromyelitis optica spectrum disorder; FLAIR=fluid-attenuated inversion recovery; Gd=post-contrast T1-weighted images.
Figure 9.
Figure 9.. Schematic representation of brain lesions in patients with AQP4+NMOSD.
Top row shows brain findings during the acute phase, while follow-up up is displayed in the bottom row. Images are all shown on axial view. T2-lesion in the area postrema (A) smaller but still present at follow-up (F). Posterior T2-lesion abutting to the fourth ventricle (B) smaller but still present at follow-up (G). T2-lesion in the corticospinal tract and splenium of the corpus callosum (C) smaller but still present at follow-up (H). Multiple small nonspecific T2-lesions in the subcortical white matter (D), persisting unchanged at follow-up (I). Additional interval T2-lesions are observed as well (I). The presence of linear ependymal enhancement (E), resolving at follow-up (J) is typical of AQP4+NMOSD. Abbreviations: AQP4+NMOSD=aquaporin-4-IgG positive neuromyelitis optica spectrum disorder; FLAIR=fluid-attenuated inversion recovery; Gd=post-contrast T1-weighted images.
Figure 10.
Figure 10.. MRI examples of brain lesions in patients with MS.
Top row shows MRI findings during the acute phase, while follow-up up imaging is displayed in the bottom row. Unless otherwise specified, images are all shown on FLAIR sequences, axial view. Small T2-lesion in the anterior medulla (A, arrow), unchanged at follow-up (E, arrow). Multiple T2-lesions in the peripheral pons and abutting on the fourth ventricles (B, arrows), still visible at follow-up (F, arrows) with additional interval T2-lesions (F, green arrow). Multiple ovoid periventricular T2-lesions abutting on the lateral ventricles (C, arrows). T2-lesions persisted at follow-up (G, arrows), at times increasing in size (G, blue arrow). Additional interval T2-lesions (G, green arrows) are shown as well. White matter T2-lesions (D, arrows), one showing ring enhancement (zoom-in picture, post-contrast T1-weighted sequence). T2-lesions persisted at follow-up (H, arrows), at times increasing in size (H, blue arrow). Additional interval T2-lesions (H, green arrows) are shown as well. Abbreviations: FLAIR=fluid-attenuated inversion recovery; Gd=post-contrast T1-weighted images; MS=multiple sclerosis.
Figure 11.
Figure 11.. Schematic representation of brain lesions in patients with MS.
Top row shows brain findings during the acute phase, while follow-up up imaging is displayed in the bottom row. Images are all shown on axial view. Small peripheral T2-lesion in the anterior medulla (A), substantially unchanged at follow-up with additional interval T2-lesion (F). Multiple T2-lesions in the peripheral pons, trigeminal nerve, and abutting on the fourth ventricles (B), substantially unchanged at follow-up with additional interval lesion (G). Multiple ovoid periventricular, juxtacortical and deep white matter T2-lesions (C). T2-lesions persisted at follow-up (H), at times increasing in size. Additional juxtacortical interval T2-lesions are also visible (H). White matter T2-lesions and one cortical T2-lesion (D) persisting at follow-up with additional interval lesions development (I). Two of the lesions shown in C demonstrate open or closed ring enhancement, which is typically observed in MS (E) and resolves at follow-up (J). Abbreviations: FLAIR=fluid-attenuated inversion recovery; Gd=post-contrast T1-weighted images; MS=multiple sclerosis.

References

    1. Wingerchuk DM, Banwell B, Bennett JL, et al. International consensus diagnostic criteria for neuromyelitis optica spectrum disorders. Neurology. 2015;85(2):177–189. - PMC - PubMed
    1. Banwell B, Bennett JL, Marignier R, et al. Diagnosis of myelin oligodendrocyte glycoprotein antibody-associated disease: International MOGAD Panel proposed criteria. Lancet Neurol. 2023;22(3):268–282. - PubMed
    1. Lennon VA, Kryzer TJ, Pittock SJ, Verkman AS, Hinson SR. IgG marker of optic-spinal multiple sclerosis binds to the aquaporin-4 water channel. J Exp Med. 2005;202(4):473–477. - PMC - PubMed
    1. O’Connor KC, McLaughlin KA, De Jager PL, et al. Self-antigen tetramers discriminate between myelin autoantibodies to native or denatured protein. Nat Med. 2007;13(2):211–217. - PMC - PubMed
    1. Kunchok A, Chen JJ, Saadeh RS, et al. Application of 2015 Seronegative Neuromyelitis Optica Spectrum Disorder Diagnostic Criteria for Patients With Myelin Oligodendrocyte Glycoprotein IgG-Associated Disorders. JAMA Neurol. 2020;77(12):1572–1575. - PMC - PubMed