. 2023 Nov 18;14(1):7500.
doi: 10.1038/s41467-023-43030-7.

Adaptive traits of cysts of the snow alga Sanguina nivaloides unveiled by 3D subcellular imaging

Affiliations

Adaptive traits of cysts of the snow alga Sanguina nivaloides unveiled by 3D subcellular imaging

Jade A Ezzedine et al. Nat Commun. .

Abstract

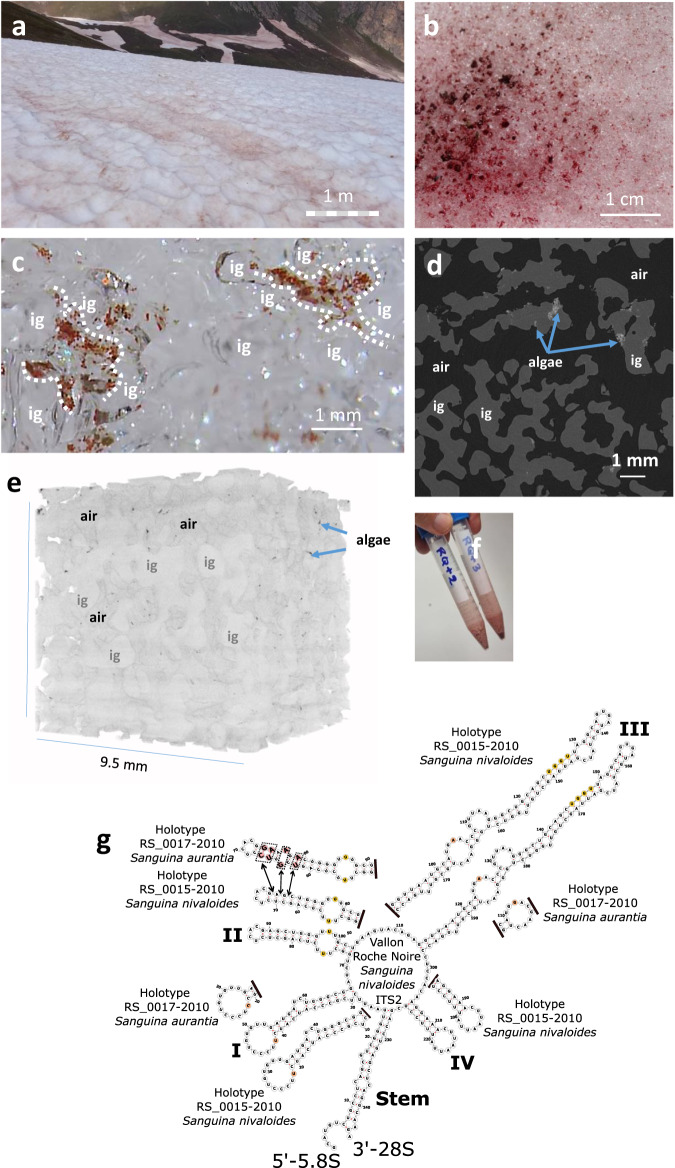
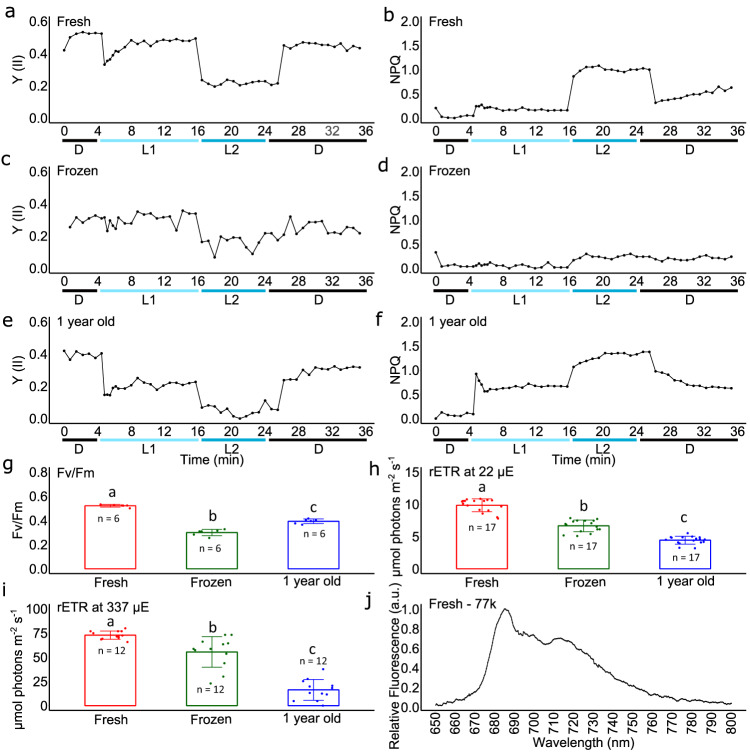
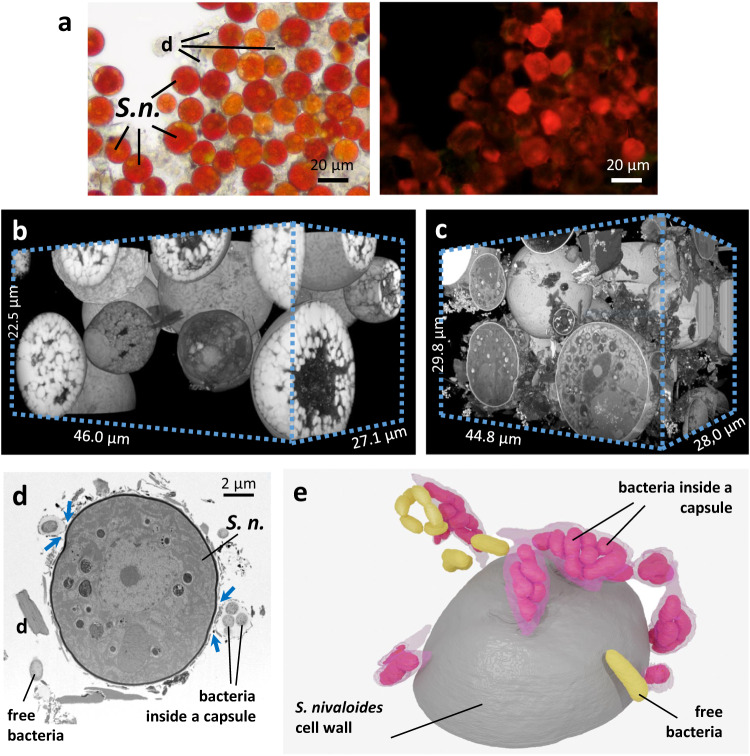
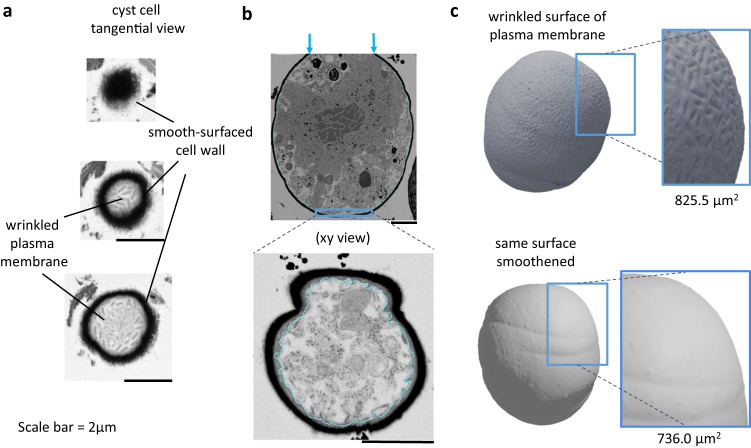
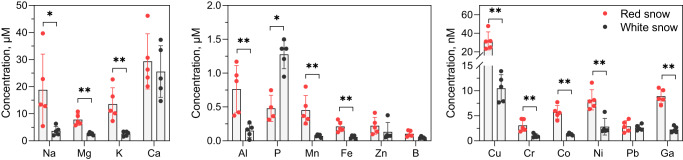
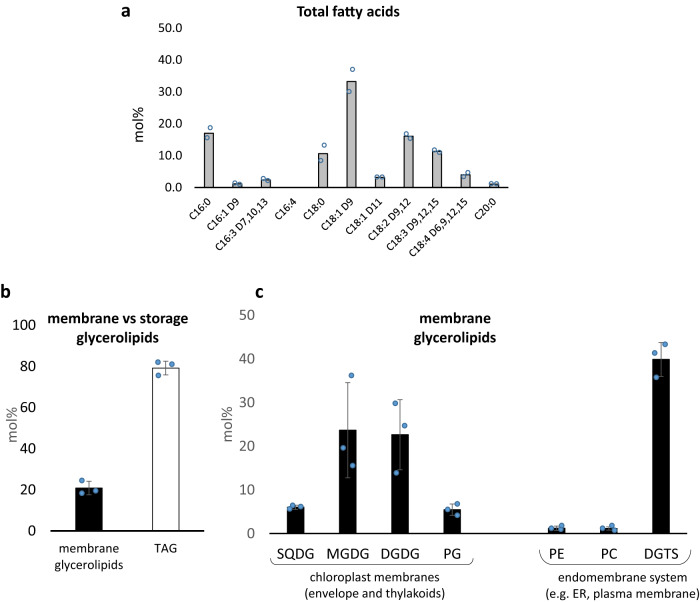
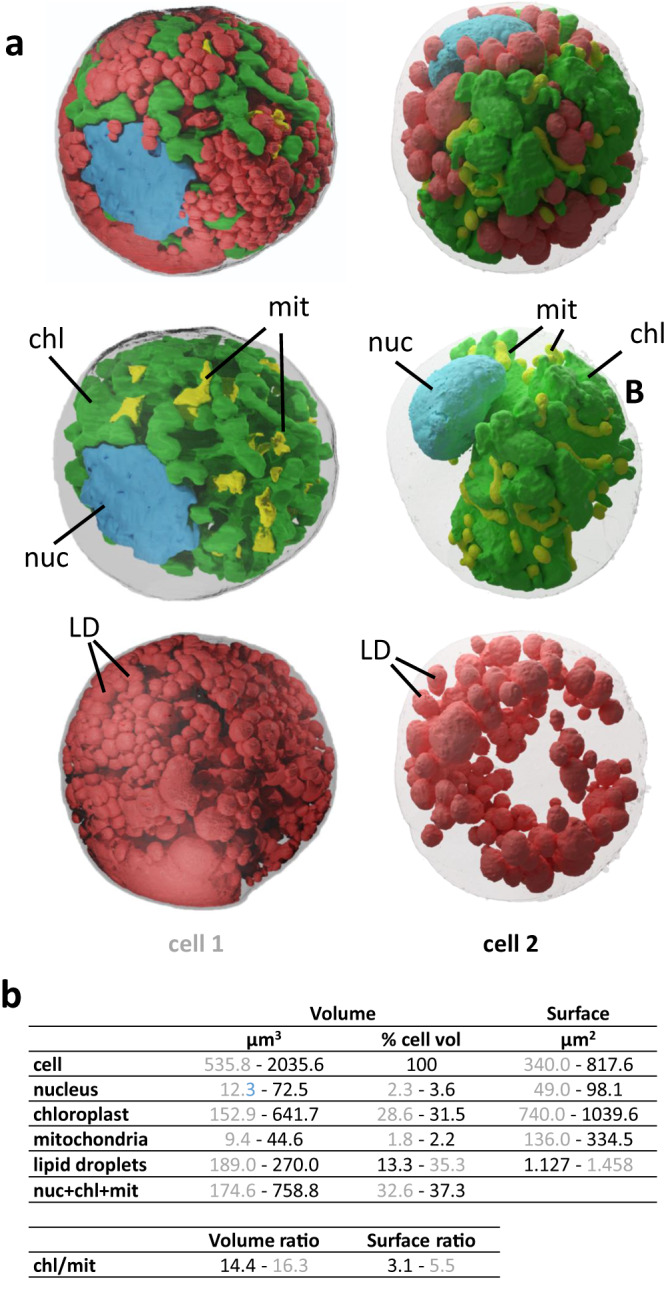
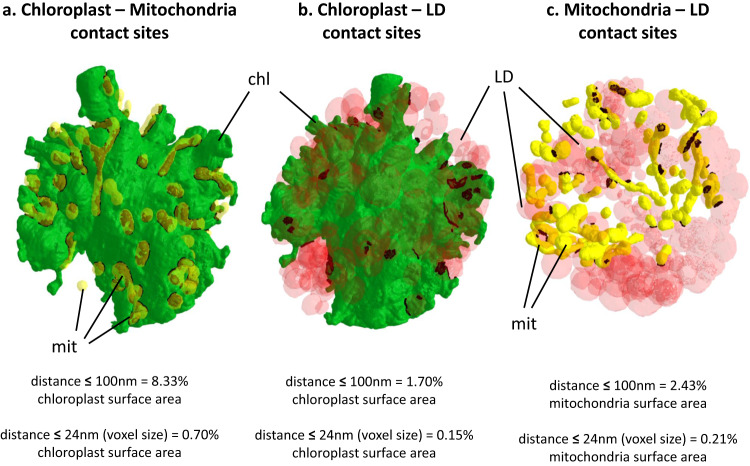
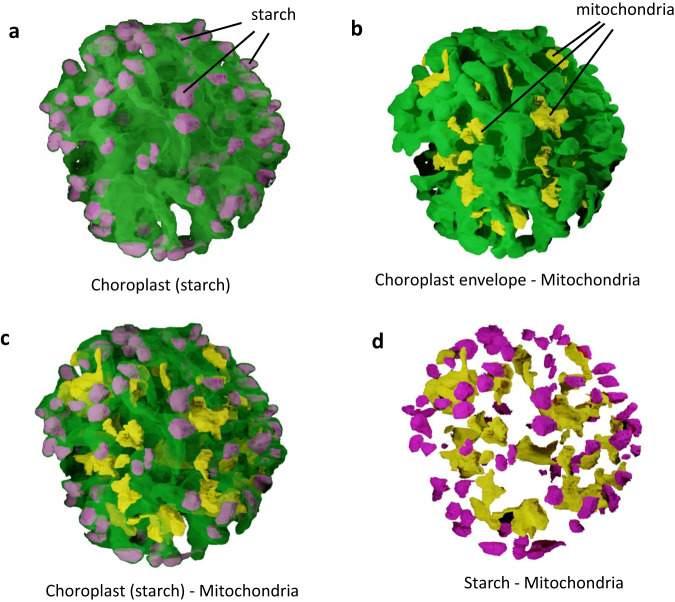
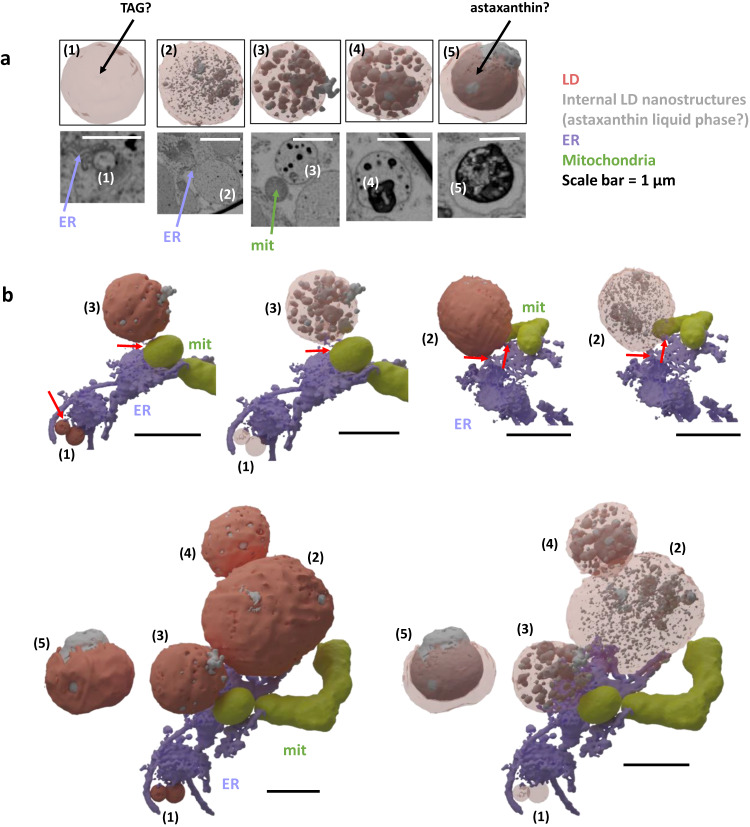
Sanguina nivaloides is the main alga forming red snowfields in high mountains and Polar Regions. It is non-cultivable. Analysis of environmental samples by X-ray tomography, focused-ion-beam scanning-electron-microscopy, physicochemical and physiological characterization reveal adaptive traits accounting for algal capacity to reside in snow. Cysts populate liquid water at the periphery of ice, are photosynthetically active, can survive for months, and are sensitive to freezing. They harbor a wrinkled plasma membrane expanding the interface with environment. Ionomic analysis supports a cell efflux of K+, and assimilation of phosphorus. Glycerolipidomic analysis confirms a phosphate limitation. The chloroplast contains thylakoids oriented in all directions, fixes carbon in a central pyrenoid and produces starch in peripheral protuberances. Analysis of cells kept in the dark shows that starch is a short-term carbon storage. The biogenesis of cytosolic droplets shows that they are loaded with triacylglycerol and carotenoids for long-term carbon storage and protection against oxidative stress.


Conflict of interest statement

The authors declare no competing interests.

Figures

Fig. 1
Fig. 1. Sanguina nivaloides blooms.
a Red snowfield in Vallon Roche Noire, 2300 m. a.s.l. The bar shows the scale in front of the perspective view. b Algal bloom view at the melting snow surface. c Red cysts in the liquid water fraction circulating between ice grains. The liquid water content, measured 10 cm below the snow surface, was 16 ± 4 mass %. Imaging with field digital microscope shows cysts only in the liquid water fraction, moving along water currents in interstices between ice grains. This observation was repeated 5 times with similar result. d X-Ray imaging of red snow. Air is shown in black, ice grains in dark gray, dust particles in white, and clusters of cysts in light grey (arrows) at the periphery of ice grains. e Volume view of red snow analyzed by X-Ray tomography. Cysts are detected at the periphery of ice grains, facing the reticulated air network. f Collected algal cells for laboratory analysis. Although present at the surface of snow, cysts sedimented after melting. g Assessment of algal species present in collected blooms based on ITS2 analysis. ITS2 secondary structures (including the ‘stem’ 5’− 5.8 S rRNA and 3’− 28 S rRNA) of algae sampled in Vallon Roche Noire and all other locations in this study, were predicted using RNAfold according to centroid algorithm. Obtained ITS2 structures were compared to S. nivaloides holotype RS 0015–2010 and S. aurantia holotype RS 0017–2010. All sequences matched holotype RS 0015-2010. Differences with holotype RS 0017–2010 are highlighted in pink, where additional complementary bases are present in helix II (5’-CG-3’, 5’-UA-3’, 5’-GA-3’). Single bases colored in brown are also different in helix I and III of S. aurantia in comparison to S. nivaloides. Pyrimidine - pyrimidine mismatch in Helix II and (G/U)GGU motif in helix III, specific of Viridiplantae, are shown in yellow. Black lines indicate no difference downstream of the structure. ig, ice grain.
Fig. 2
Fig. 2. Analysis of photosynthesis of Sanguina nivaloides collected within red snowfields in Vallon Roche Noire after various periods of conservation.
a, b Effective photochemical quantum yield of photosystem II (Y(II)) and non-photochemical quenching (NPQ) in freshly-collected cells. c, dY(II) and NPQ, in cells frozen 16 hours at -5 °C. e, f Y(II) and NPQ, in cells kept one year at + 4 °C. Prior to the onset of the measurements, cells were acclimated to darkness for 15 min. Chlorophyll fluorescence was recorded under different intensities of actinic light; starting with measurements in the dark (D), then at 22 (L1) and 337 (L2) µmol photons m−2 s−1 followed by 10 min of relaxation in the dark (D). gi Fv/Fm, and relative photosynthetic electron transfer, rETR, at 22 and 337 µE of freshly collected samples, frozen samples, and samples stored one year at + 4 °C. Fv/Fm, rETR 22 and rETR 337 mean values ± SD were based on n = 6, 17 and 12 independent measurements, respectively. For “fresh vs. frozen” comparisons, the P-value for Fv/Fm measurements based on a One-Way ANOVA test was 2.2 ×10⁻¹¹. For rETR 22 and rETR, 337 measurements, P-values based on a Kruskal-Wallis test were 3.0 × 10⁻¹⁰ and 1.2 × 10⁻⁶, respectively. One-sided ad hoc tests confirmed significant differences, shown with “a”, “b” and “c” letters on the barplots. P-values from Tukey HSD test for Fv/Fm for the samples “fresh vs. frozen”, “fresh vs. 1 year old” and “frozen vs. 1 year old” were 0.1 × 10⁻⁸, 0.1 ×10⁻⁸, and 2.0 × 10⁻⁶, respectively. P-values from Dunn’s test with Boneferroni correction for ETR 22 were 1.2 × 10⁻³, 0.1 × 10⁻⁵, and 1.6 × 10⁻³, respectively. P-values for ETR 337 were 3.3 × 10⁻², 0.1 × 10⁻⁵, and 5.1 × 10⁻³, respectively. j Low temperature fluorescence emission spectrum of a fresh sample of Sanguina nivaloides. The obtained data were normalized to the photosystem II emission peak at 685 nm.
Fig. 3
Fig. 3. FIB-SEM imaging of chemically-fixed and cryo-fixed S. nivaloides cysts.
a Light microphotographs of red snow. Right, bright field image of mature cysts, with lipids droplet visible inside cells, pigmented in red or orange due to the presence of astaxanthin and other carotenoids. Left, chlorophyll autofluorescence (excitation 495 nm; emission 521 nm). Fluorescence intensity is higher in orange cells and cells with apparent green spots. Debris and dust in the sample have no pigmentation nor fluorescence. This observation has been repeated 6 times with similar results. b Volume view of chemically-fixed cells analyzed by FIB-SEM. One FIB-SEM analysis has been performed with this fixation method. c Volume view of cryo-fixed cells analyzed by FIB-SEM. One FIB-SEM analysis has been performed with this fixation method. d Detection of bacteria associated to Sangina nivaloides cysts. Image from a FIB-SEM stack showing free and encapsulated bacteria. This observation has been repeated with similar result on all images from the FIB-SEM stack. e Three-dimensional model of bacteria at the vicinity of a Sangina nivaloides cyst. S. n. Sangina nivaloides, d debris.
Fig. 4
Fig. 4. Wrinkled plasma membrane of Sanguina nivaloides cysts.
a Tangential views of plasma membrane and cell wall in cross sections observed by FIB-SEM at variable depths. b Process of segmentation of plasma membrane based on EM image stacks. c Three-dimensional reconstruction of Sanguina nivaloides cyst plasma membrane. The 3D model with a wrinkled surface was filtered using the HC Laplacian smoothing method. The filter builds a new mesh based on the information of the average of the nearest vertices, and thus produces a smooth surface after three iterations. Based on the native wrinkled membrane and the computed smoothened one, surfaces are calculated and highlight a 12% area increase attributable to the plasma membrane architecture.
Fig. 5
Fig. 5. Analysis of the soluble elements in the liquid water fraction of red and white snow.
Elements were analyzed by ICPMS, and concentrations were normalized based on a 15% LWC, and expressed in M. Histograms were split based on the elemental concentration ranges, from 5–50 µM for the most abundant to <10 nM. Some elements such as C and N were not analyzed by this method. Analyzes was performed in 5 replicates. P-value was based on a Mann–Whitney test and considered significant as follows: *, P-value = 2.10−2; **, P-value = 8.10−3.
Fig. 6
Fig. 6. Quantitative analysis of fatty acids and glycerolipids in S. nivaloides cysts.
a Fatty acid profile in a total lipid extract. Lipids were extracted from S. nivaloides cells collected from bloom 2, and subjected to a methanolysis. Obtained fatty acid methyl esters were identified by mass spectrometry and quantified by gas chromatography coupled to flame ionization detection. Fatty acids are represented based on their carbon-chain lengths (from 16 to 20 carbon), and the positions of double bonds (Dx, numbered at the xth carbon from the carboxylic end). Relative proportions are expressed in mol%. The result is the average of two replicates. b Relative proportions of membrane and storage glycerolipids. Relative proportions are expressed in mol% of total glycerolipids. c Relative proportions of membrane glycerolipid classes. Relative proportions are expressed in mol% of membrane glycerolipids. Profiles shown in (b) and (c) were obtained from lipids extracted from bloom 4. Each result is the average of three replicates ± SD. DGDG digalactosyldiacylglycerol, DGTS diacylglyceryl-trimethylhomoserine, MGDG monogalactosyldiacylglycerol, PC phosphatidylcholine, PE phosphatidylethanolamine, PG phosphatidylglycerol, SQDG sulfoquinovosyldiacylglycerol, TAG triacylglycerol.
Fig. 7
Fig. 7. 3D cell architecture of S. nivaloides cysts.
a Analysis of chemically- and cryo-fixed cysts. Two cells are represented, cell 1 chemically fixed and cell 2, cryo-fixed. The internal organization shows the nucleus in blue, chloroplast in green, mitochondria in yellow, and lipids droplets in red. b Quantitative volumetric analysis of cell compartments. Data are shown in grey for cell 1 and in black characters for cell 2. nuc nucleus, mit mitochondria, chl chloroplast, LD lipid droplet.
Fig. 8
Fig. 8. Proximity between cellular organelles in S. nivaloides cysts.
a Chloroplast - mitochondria. b Chloroplast - lipid droplets. c Mitochondria – lipid droplets. Distances were measured as described earlier. Green, plastid surface; yellow, mitochondria surface; red, lipid droplets surface. Dark spots highlight proximity surfaces corresponding to points at a distance ≤ 100 nm between organelles. chl chloroplast, LD lipid droplet, mit mitochondria.
Fig. 9
Fig. 9. Proximity of mitochondria to chloroplast peripheral ends filled with starch.
a Localization of starch in protuberances at the periphery of the chloroplast. b Mitochondria proximity to the chloroplast envelope. c Relative localization of chloroplast, starch, and mitochondria. d Mitochondria distance to starch. Starch is visible in cells chemically fixed on the day of sampling, whereas it has been hydrolyzed in cells stored 5 days in the dark at 4 °C. The internal organization represents the chloroplast envelope, in green, starch in purple, and mitochondria, in yellow.
Fig. 10
Fig. 10. Lipid droplet biogenesis and astaxanthin loading.
a Different stages of cytosolic lipid droplet formation from stage 1 to a mature stage 5 filled with astaxanthin. Details of astaxanthin-rich liquid subdomains are only visible in cryo-fixed cells. Stages are defined based on their size, connection with the endoplasmic reticulum, shown in purple, and mitochondria, in yellow, and density of astaxanthin domains. Mature LDs are disconnected from mitochondria, suggesting that the TAG they contain is not metabolically available for β-oxidation, and may therefore be stored for long periods. This observation has been made on 2 other cells in the FIB-SEM stack of cryo-fixed S. nivaloides cysts with similar result. b Interaction of lipid droplets with the endoplasmic reticulum and mitochondria. Mit mitochondria, ER endoplasmic reticulum, LD lipid droplet.

References

    1. Engstrom PG, et al. Systematic evaluation of spliced alignment programs for RNA-seq data. Nat. Methods. 2013;10:1185–1191. doi: 10.1038/nmeth.2722. - DOI - PMC - PubMed
    1. Hoham R. W. & Remias D. Snow and Glacial Algae: a review. J. Phycol. (2019). - PMC - PubMed
    1. Remias D. Cell structure and physiology of alpine snow and ice algae. In: Plants in Alpine Regions (ed Lütz C.). Springer (2012).
    1. Aristotle. History of animals / Περί ζῴων ἱστορίαι. (c. 347-322 BC).
    1. Plinius C. Natural history / Naturalis historia. (c. 77).

Publication types